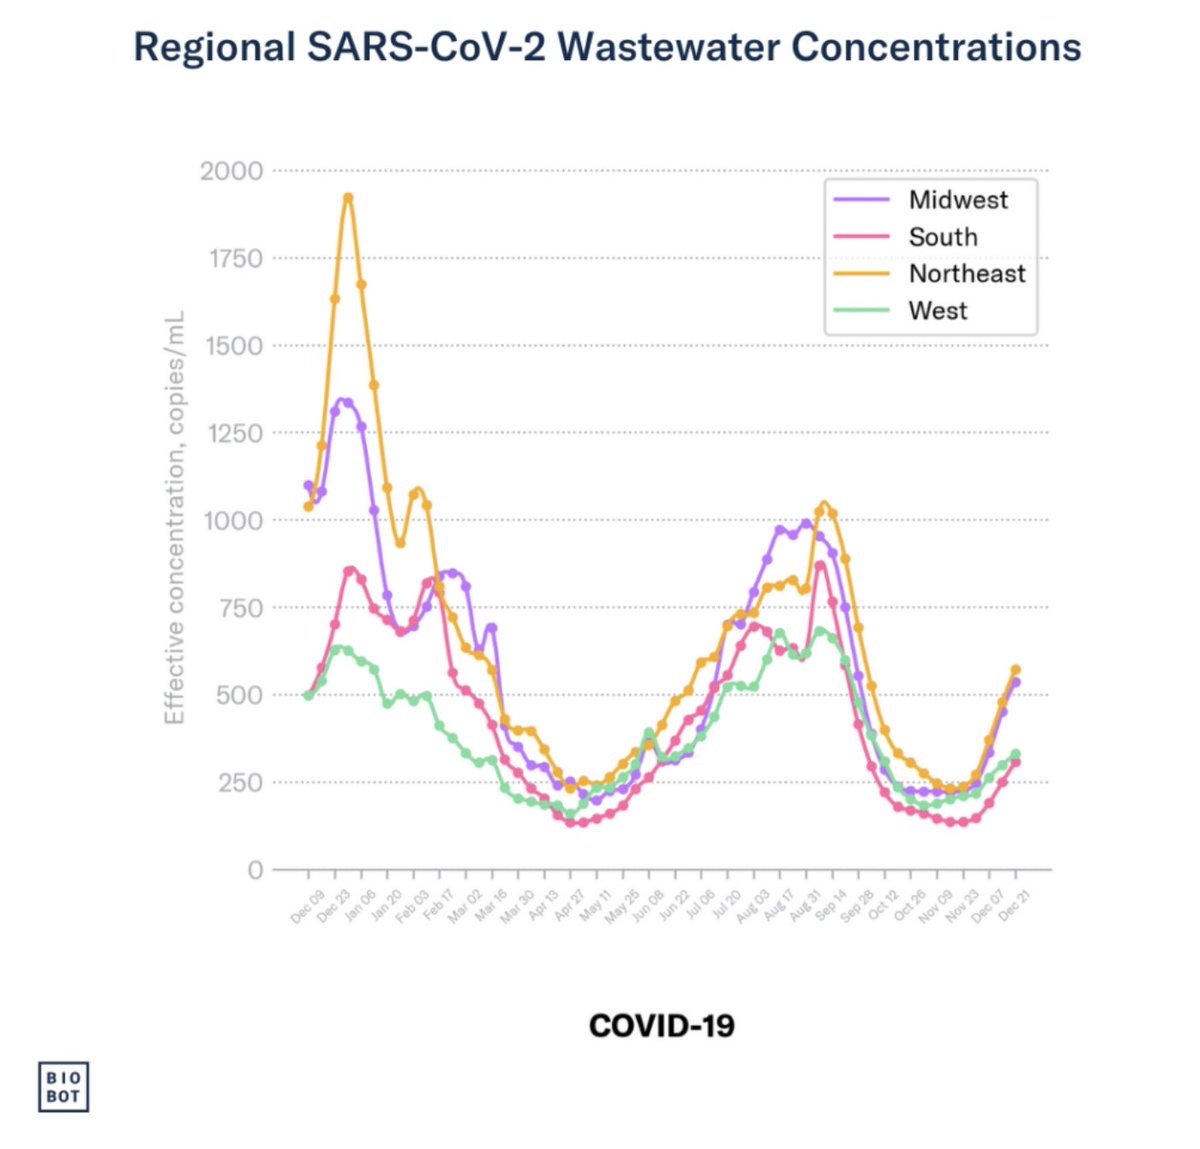
12-1/ My pathogen update for epi weeks 11-12 of 2025. The XEC COVID wave hasn't fully receded yet. Biobot shows that as of March 15, SARS2 wastewater levels haven't fallen to previous interwave gaps except for the Western region of the US.
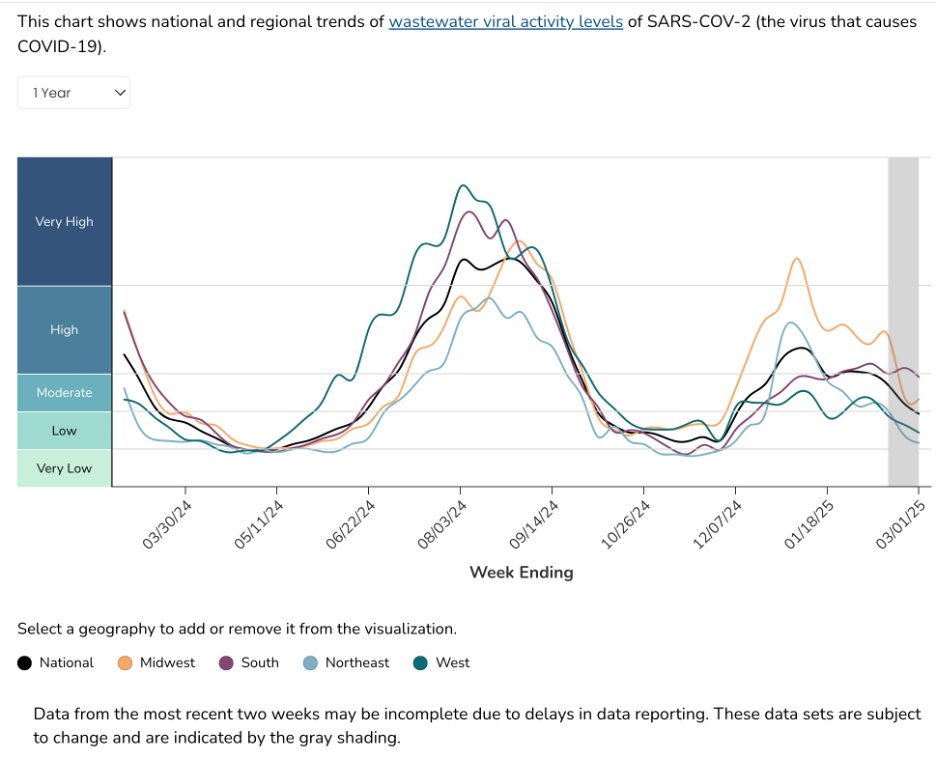
12-2/ The CDC's ww numbers indicate a long tail for this wave, but it shows the West and NE back to interwave levels. These numbers are all normalized to the previous year's numbers, so I don't know if this long tail may be an artifact of the way they normalize. I trust Biobot.
12-3/ If there is a long tail, it's due to the LP.8.1x brood that continues to gain traction against XEC.x. I expected the LP.8.1x's to top out at about 30%, but CoV-Spectrum shows they've reached 50%. O/c, there were only 3 LP.8.1x descendants a month ago. Now there are 19.
12-4/ If previous wastewater patterns hold, SARS2 will continue circulating at low levels during the interwave gaps. I wonder if these aren't mostly chronic infections, as seen by Marc Johnson @SolidEvidence in wastewater?
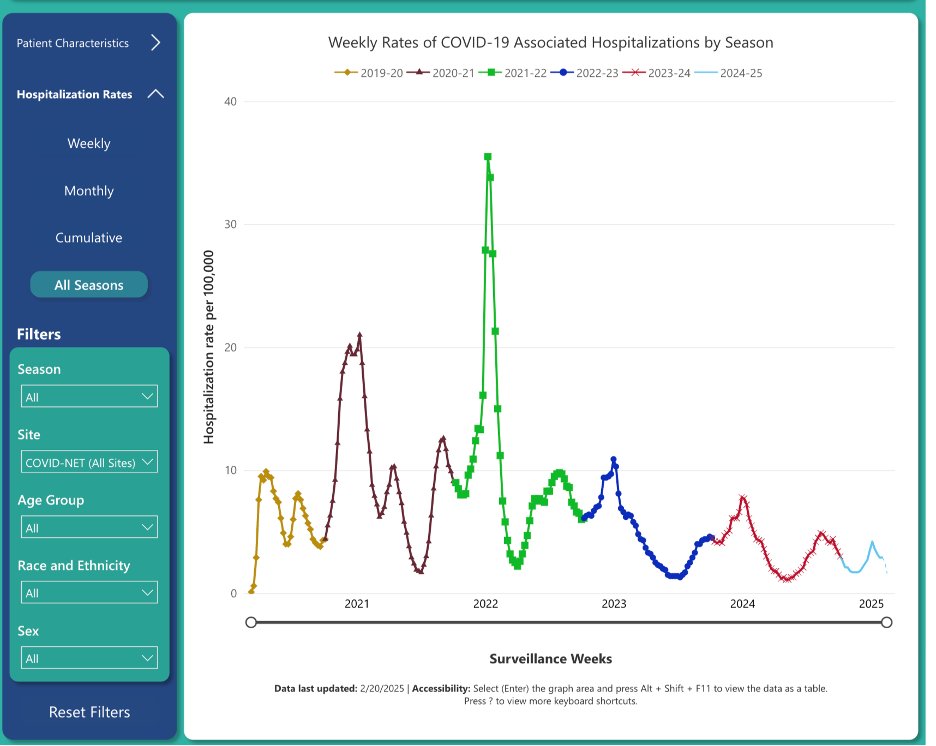
@SolidEvidence 12-5/If previous US patterns hold, we'll see probably see another wave peak in late summer. Maybe I'm an optimist, but I suspect the next wave's hospitalization rates won't exceed 5/100,000, and the weekly death rate will be lower than 0.25/100,000. We'll see.
@SolidEvidence 12-6/ On the HPAI A(H5) front, the CDC released it's monthly update. As of 19 March, there's still no sign of human-to-human transmission. Likewise there's nothing to indicate that our milk supply is a vector for A(H5) infections.
@SolidEvidence 12-7/ OTOH, the measles outbreak is still spreading. It's now grown to 309 cases in 14 TX counties, and 42 cases in 2 NM counties. And it has spread south of the border... (h/t to vaxopedia for the map)
@SolidEvidence 12-8/ The state of Chihuahua has a growing number of cases, with 400+ suspected and at least 32 confirmed cases. Mexico has issued a warning to its citizens asking them not to travel to Texas and seven other states in the U.S. due to a measles outbreak.
12-9/ The Mexican outbreak evidently started in a Mennonite community in Chihuahua whose members had visited infected communities in Texas. Likewise, Canada is seeing a big measles outbreak (h/t to Global News for the graphic).
12-10/ The Canadian outbreak started at a Mennonite gathering in New Brunswick last fall. It's spread o other Mennonite communities in Ontario and to the rest of the country. The NB case didn't catch it in the US, but brought it back from the Philippines. tinyurl.com/ms733yju
12-11/ The WHO publishes a monthly measles update for the world. The case numbers for Feb are still coming in, but January seems to have been a relatively "mild" month. And notice how the COVID pandemic interrupted suppressed measles transmission 2020-21.
10-1/ My pathogen update for epi weeks 9-10 of 2025. I'm renaming this a "pathogen update" because SARS-CoV-2 is fading into endemicity. That doesn't mean that COVID-19 won't remain a public health problem, but we've got a bunch of other pathogens that we need to keep our eye on.
10-2/ But speaking of COVID-19, the current wave is receding. Both the CDC's wastewater activity levels and Biobot's wastewater concentration chart show a downward trend in all regions of the US,
10-3/ This XEC wave had the lowest rates of hospitalizations, ED visits, and deaths of any variant wave so far (at least for the US). And rates of test positivity for RSV and Influenza outpaced COVID this respiratory season.
8-1/ My COVID update for epidemiological weeks 7-8 of 2025.
The current COVID wave continues to be the mildest in terms of hospitalizations and mortality since the pandemic began. And it doesn't look like LP.8.1 will break out to boost the current XEC wave.
8-2/ The CDC's wastewater survey shows SARS2 numbers are trending downward in all regions except the Midwest. Note: The CDC normalizes these against the previous year, so they don't give us absolute concentrations. Biobot does, but they haven't published an update in past 2 wks.
8-3/ While ED visits and deaths due to COVID remain low compared to previous waves, influenza is the respiratory virus causing the most ED visits — although we're probably past the peak for flu cases now.
6-1/ My COVID update for epidemiological weeks 5-6 of 2025.
Biobot's latest wastewater numbers indicate the current XEC wave has receded a bit—but we might see a secondary bump as the numbers level off in West and Midwest, and climb a bit in the South.
6-2/ As US COVID waves go, wastewater numbers indicate this has been on the low side, but we don't really know if the viral shedding of JN.1 and its descendants has remained consistent with previous variants.
6-3/ When it comes to ED visits, hospitalization, and mortality, this has been the mildest wave ever in the US. But...
4-1/ My COVID update for epidemiological weeks 3-4 of 2025.
For the 1st time since 1952, the CDC stopped publishing its Morbidity and Mortality Weekly Report (MMRW)—the last update was on 16 Jan. Is the Trump administration emulating Chinese secrecy practices?
4-2/ Other CDC data pages seem to be up and running, though. Their wastewater numbers seem to indicate the current XEC COVID wave has peaked. Biobot hasn't published an update recently, so I don't have a reality check for CDC's data.
4-3/ Biofire's proprietary Syndromic Trends also shows COVID dropping off as a percentage of detected respiratory viruses. RSV may also be on downward curve, but influenza is rising fast.
2-1/ Happy New Epidemiological Year! This is my COVID update for epidemiological weeks 1-2 of 2025.
Biobot shows wastewater concentrations rising steeply in the South and Midwest. 5 weeks into this wave nat'l ww concentrations have risen at ~2x rate of the previous KP.3x wave.
2-2/ CDC's ww graph shows a higher rise in the Midwest and less so in the South. Of course, the CDC normalizes its numbers against the previous year, so these are relative numbers—not avg SARS2/PMMoV concentrations in CpmL units. Biobot methodology seems more straightforward.
2-3/ COVID hospitalizations are on the rise, but for some reason, the CDC seems to be predicting that the data, once tabulated, will show a drop in hospitalizations in the final week of December. This seems counterintuitive, with wastewater numbers rising so steeply.
52-1/ COVID update for epidemiological weeks 51-52 of 2024.
Here we go again! National SARS2 wastewater numbers are climbing quickly, especially in the NE and Midwest.
52-2/ Of the big 3 respiratory viruses (per CDC), COVID still trails RSV and influenza in test positivity, but has now passed RSV in the number of ED visits.
52-3/ COVID deaths are probably still falling but hospitalizations (based on incomplete data) are rising. And a rise in deaths will follow as hospitalizations rise.