Iain Porter Profile picture
Mar 26 7 tweets 2 min read Read on X
DWP is using a sleight of hand in its disability benefit cuts impact assessment: Actual increase in poverty is closer to 400,000, not the 250,000 in the impact assessment.

Quick thread explaining why. 🧵1/7
There are 3 separate impacts shown at:

Changes to PIP increase poverty by 300,000 (Table B2) 2/7 assets.publishing.service.gov.uk/media/67e3fa66…DWP impact assessment: PIP cuts poverty impact of 300,000
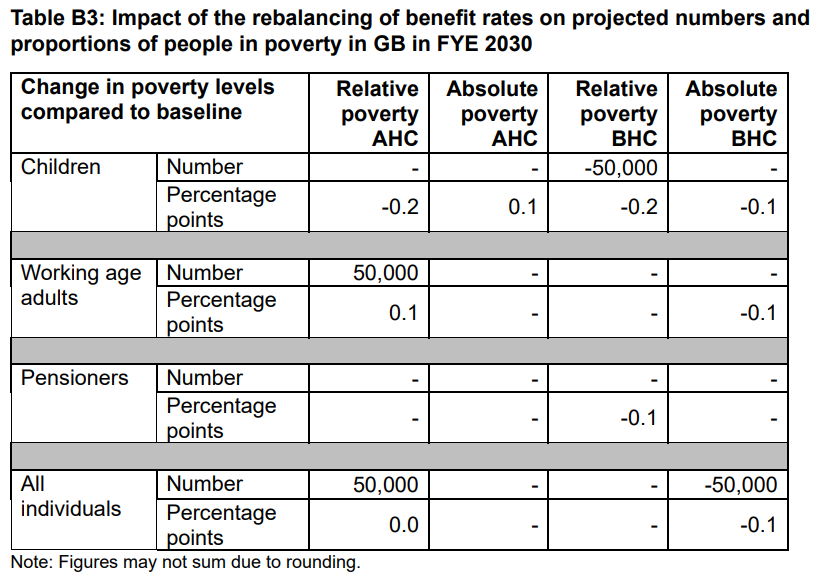
Changes to rates in Universal Credit increase poverty by 50,000 (Table B3) 3/7 DWP impact assessment: Total Universal Credit cuts increase poverty by 50,000
Reversing the previous Government’s planned changes to Work Capability Assessment (WCA) descriptors (which never happened in the end) reduces poverty by 150,000 (Table B4) 4/7 DWP impact assessment: Reversing previous Govt's WCA cuts (which never happened) reduce poverty by 150,000
The net effect of the three policies is an increase in poverty of 250,000 (Table B1) 5/7 DWP impact assessment: The three policies combined increase poverty by 250,000
BUT, this means the total effect of just policies 1 and 2 (i.e. the main cuts announced last week and today) is an increase in poverty of between 350,000 (i.e. 300k from Table B2 plus 50k from Table B3) and 400,000 (i.e. 250k from Table B1 plus 150k from Table B4). 6/7
In summary: The 250k net poverty rise in impact assessment is extra to an assumed 150k rise that previous Conservative plans would have created - even they never happened. But DWP has assumed that increase was already on the books and added to it. Real poverty impact is 400k. 7/7

• • •

Missing some Tweet in this thread? You can try to force a refresh
 

Keep Current with Iain Porter

Iain Porter Profile picture

Stay in touch and get notified when new unrolls are available from this author!

Read all threads

This Thread may be Removed Anytime!

PDF

Twitter may remove this content at anytime! Save it as PDF for later use!

Try unrolling a thread yourself!

how to unroll video
  1. Follow @ThreadReaderApp to mention us!

  2. From a Twitter thread mention us with a keyword "unroll"
@threadreaderapp unroll

Practice here first or read more on our help page!

More from @IainKPorter

Mar 18
Big picture today is Government chose to cut unprecedented £5bn of income from disabled people at highest risk of hardship. This drive for cost savings undermines any positive changes contained in the disability benefits green paper.

Here are some other big problems:🧵1/11 JRF Chief Executive Paul Kissack said:  "No truly moral choice would leave disabled people without the very support that is designed to allow them to lead a dignified life, nor would it leave them facing hardship. These would be unprecedented disability benefits cuts.  “Ideas like the Right to Try Guarantee help to remove the barriers that prevent people from working but enormous cuts mean the Government risks undermining these positives. Making it harder for people to qualify for support, or cutting their support, puts more pressure on people who are already struggling to cope.  "...
New claimants of Universal Credit’s health element from 2026 will receive ~£48 a week less UC in total than under current system - a huge halving of support (comprising ~£51 cut to UC LCWRA element, offset by only ~£3 rise in UC standard allowance) 2/11
Our @jrf_uk @scope report shows that people currently in this group (UC LWCRA) experience unacceptably high levels of hardship. Cutting health-related UC will just make people poorer and make it harder for people trying to recover from ill health or move towards work. 3/11 This chart shows different indicators of hardship for people receiving health-related Universal Credit, compared to people receiving non-health-related Universal Credit, compared to all working-age people. Indicators include, for each of those groups: % of working-age adults who are in a household that had to use a food bank in the last 12 months; % who could not afford to keep their house warm; % experiencing material deprivation; % in a food insecure household; % in a household with 'very low food security'; and % who could not afford to keep up to date with bills. Overall the chart shows...
Read 11 tweets
Mar 14
Yesterday, a Government press release claimed the number of people “considered too sick to work” had "quadrupled" since the pandemic (a "383% rise"). This is incorrect. In fact, it’s not even close. It's more like 40%.

This thread explains why 🧵1/7 Image of Government press release stating a "383% rise in less than five years" in the number of people considered too sick to look for work.
The press release ignores that Universal Credit was still early in rollout pre-pandemic, so starts from a very low number. It ignores equivalent group in the legacy ESA benefit that UC is replacing. You can't compare UC LCWRA over time without including the equivalent ESA. 2/7
As a recent DWP statistical analysis shows, the actual rise between 2019 and 2023 in total LCWRA and equivalent group is around 40%. 3/7 Image of DWP statistical analysis showing the total ESA SG / UC LCWRA caseload rose from 1.7 million in 2019 to 2.4 million in 2023 - this is a rise of 41%.
Read 8 tweets
Nov 14, 2024
Govt has committed to £3bn cuts to health/disability benefits. But targeting arbitrary savings (set by previous Govt) won't lead to effective reforms that unlock work, and risks deeper hardship for disabled people.

New @jrf_uk @scope report shows the changes we really need🧵1/12 Scope and JRF logos
This affects disabled people at severe risk of hardship. Of adults on health-related Universal Credit:

- 75% are in material deprivation (a Govt measure of inability to afford basic items)
- 34% couldn't afford to keep their house warm
- 24% used a food bank last year. 2/12 This chart shows different indicators of hardship for people receiving health-related Universal Credit, compared to people receiving non-health-related Universal Credit, compared to all working-age people. Indicators include, for each of those groups: % of working-age adults who are in a household that had to use a food bank in the last 12 months; % who could not afford to keep their house warm; % experiencing material deprivation; % in a food insecure household; % in a household with 'very low food security'; and % who could not afford to keep up to date with bills. Overall the chart shows...
Even comparing only within families on UC where no one is in work, people on health-related UC have similarly high deprivation risk as people on non-health-related UC. This is despite receiving extra health-related payments via the LCWRA element. 3/12 This chart shows different indicators of hardship for people in out-of-work families receiving health-related Universal Credit, compared to people in out-of-work families receiving non-health-related Universal Credit. Indicators include, for each of those groups: % of working-age adults who are in a household that had to use a food bank in the last 12 months; % who could not afford to keep their house warm; % experiencing material deprivation; % in a food insecure household; % in a household with 'very low food security'; and % who could not afford to keep up to date with bills. Overall the...
Read 12 tweets
Mar 21, 2024
Today's report from cross-party committee of MPs @CommonsWorkPen calls on Govt to set out a plan to address inadequate benefits that leave people unable to afford life's essentials, pointing to @jrf_uk @TrussellTrust work on an Essentials Guarantee🧵1/6

publications.parliament.uk/pa/cm5804/cmse…
Committee report cover image
The MPs found plenty of evidence that support is so inadequate that people are unable even to afford essentials like food or a warm home... 2/6 Excerpt from committee report showing examples of what people receiving benefits said about the adequacy of benefits and ability to afford essentials: 'A number of participants said benefit levels were too low, and described difficulties they faced trying to afford everyday living costs such as food and energy for heating their homes. One participant said heating was a “luxury”; another described how sometimes, they would wait until their hands were too  cold to turn the page whilst reading before turning on the heating for an hour. One participant spoke about the challenging budgeting choi...
… That’s not surprising given that the basic rate of #UniversalCredit falls so far short of what people need to afford essentials. 3/6 Chart comparing Universal Credit's standard allowance to JRF and Trussell Trust's indicative Essentials Guarantee level (what's needed to afford essentials like food, household bills and vital travel). For a single adult aged 25 or over, Universal Credit's standard allowance will be £91 a week from April, but a single adult needs at least around £120 a week to cover essentials - a shortfall of around £30 a week.
Read 6 tweets

Did Thread Reader help you today?

Support us! We are indie developers!


This site is made by just two indie developers on a laptop doing marketing, support and development! Read more about the story.

Become a Premium Member ($3/month or $30/year) and get exclusive features!

Become Premium

Don't want to be a Premium member but still want to support us?

Make a small donation by buying us coffee ($5) or help with server cost ($10)

Donate via Paypal

Or Donate anonymously using crypto!

Ethereum

0xfe58350B80634f60Fa6Dc149a72b4DFbc17D341E copy

Bitcoin

3ATGMxNzCUFzxpMCHL5sWSt4DVtS8UqXpi copy

Thank you for your support!

Follow Us!

:(