Something has broken tonight in the bond market. We are seeing a disorderly liquidation.
If I had to GUESS, the basis trade is in full unwind.
Since Friday's close to now ... the 30-year yield is up 56 bps, in three trading days.
The last time this yield rose this much in 3 days (close to close) was January 7, 1982, when the yield was 14%.
This kind of historic move is caused by a forced liquidation, not human managers make decisions about the outlook for rates at midnight ET.

It keeps going, the 30-year yield is now 5.00%!
As chart shows, since Sunday Night, 54 hours ago, the 30-year is up 67 basis points. Cannot find a move like this in my database.
The only overlay is the 30-year Gily blowing up during the Liz Truss moment" in September 2022. That was 130 bos in 5 days. We are now 67 bps 2 1/2 days.
As chart shows, since Sunday Night, 54 hours ago, the 30-year is up 67 basis points. Cannot find a move like this in my database.
The only overlay is the 30-year Gily blowing up during the Liz Truss moment" in September 2022. That was 130 bos in 5 days. We are now 67 bps 2 1/2 days.

S&P futures are down another 100 points or 2% tonight as I write. This sell-off might not be about tariffs but on the realization that the bond market is broken/breaking.
Markets are fragile. Tariffs broke the bond market and now this decline is about this realization.
---
A liquation is underway and must be completed, losing positions have to be exited, not supported or ignored.
Cutting rates and making financing rates cheaper in the middle of this kind of liquidation, encourages speculation ... exactly what is not needed in the middle of such a move.
I think the market knows this which is why the chart below shows only a 63% probability of a cut in rates in a month. Not intra-meeting! Rates cuts are not the answer.
The Fed restarting QE to artificially raise bond prices will only cement the belief that a massive spike in inflation is coming.
This is not a problem that can be fixed with "printing." It was years of "printing" that encouraged the massive build-up in speculation that is now being forced to liquidate.
You cannot drink yourself sober. You can encourage speculation by cutting rates/WE to stop a speculative unwind.

I don't think this is China selling bonds to "punish" the US over rates.
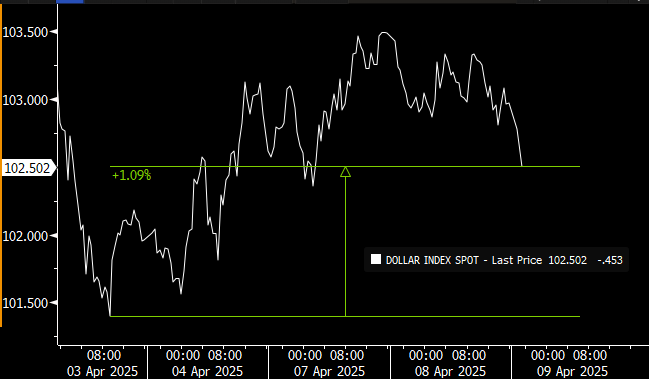
There are no good daily statistics to measure this. But I still contend that if this were happening, the dollar would be declining. The Dollar Index (DXY) is up since Thursday's low, suggesting net foreign buying is coming into the US market.
---
Above said, technically, China could be selling and keeping their money in overnight repo accounts. If they did this, it says two things ...
1. They are not afraid to dump Treasuries and drive up yields and punish, but they are afraid to take the cash from these Treasury sales and convert it to another currency (dump dollars). Why is it ok to crush the bond market but not the currency market? (Answer, it does not make sense)
2. If they are selling Treasuries and continue to park them in US repo accounts, they are not really serious about punishing the US.
Again, the most logical answer is that they are not the primary seller of Treasury, if they are a seller at all.
By the way the US Treasury has an auction of $39 billion of 10-year notes on Wednesday and $22 billion of 30-year bonds on Thursday.
Should be "interesting" to see who wants these Treasuries in the middle of this chaos.
Should be "interesting" to see who wants these Treasuries in the middle of this chaos.
Another sign of how broken things are ...
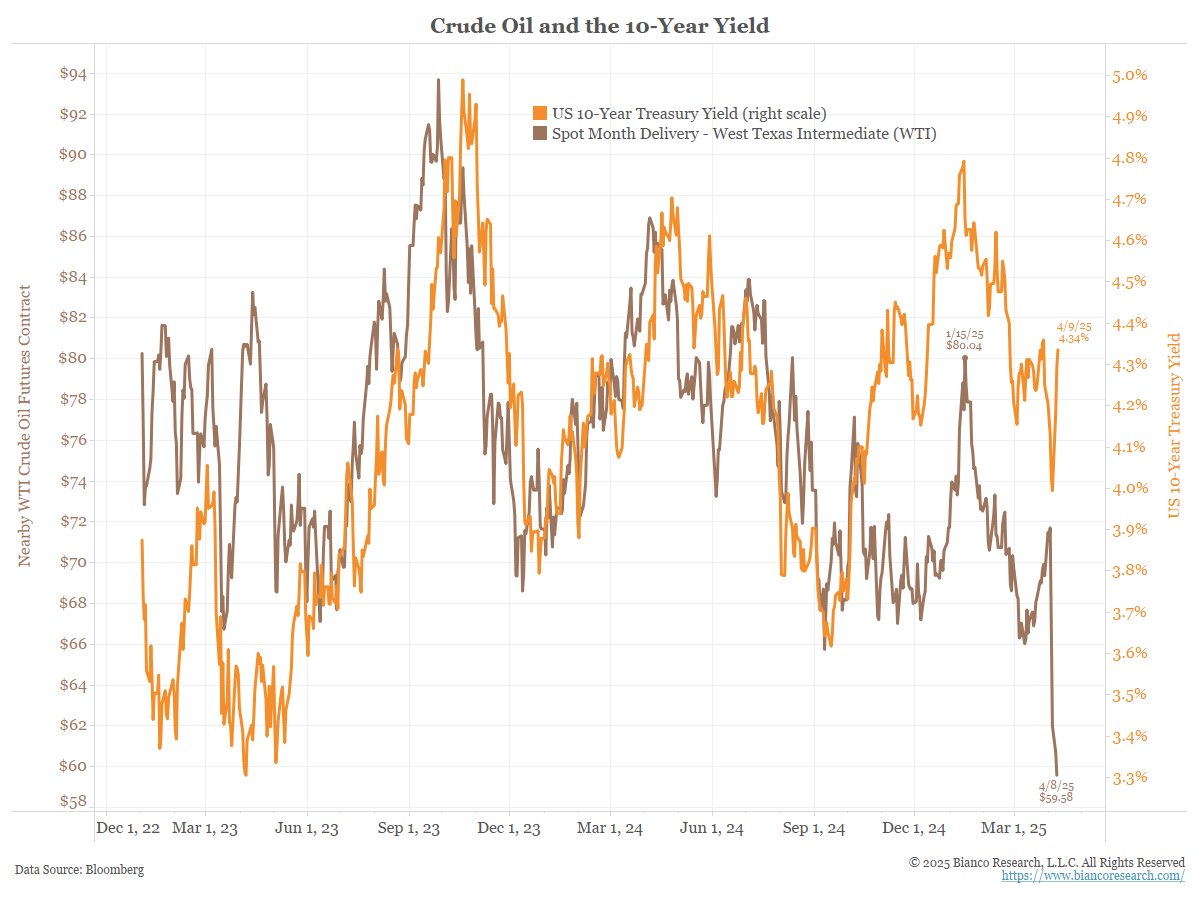
Since Liberation Day, Crude oil has collapsed 21%. At $57, it is at its lowest level since April 2021 ... or the lowest point since the Ukraine War started in March 2022.
As noted above, over the last three days, bond yields are soaring the most in 40 years.
Restated, bond prices and crude are both crashing together at the same time.
Unprecedented
When the world's largest and most important bond market breaks/is dysfunctional ... knock on effects happen.
*JAPAN’S 40-YR YIELD RISES 32BPS TO HIGHEST SINCE DEBUT IN 2007
*JAPAN’S 40-YR YIELD RISES 32BPS TO HIGHEST SINCE DEBUT IN 2007
• • •
Missing some Tweet in this thread? You can try to
force a refresh