Jim Bianco Profile picture
Apr 11 6 tweets 2 min read Read on X
1/6

Bonds are getting crushed again today. Now it looks like selling is coming from foreigners, especially Europe.

China is believed to hold several hundred billion of US Treasuries in legal entities in Belgium and Luxembourg.
🧵
2/6

The 10-year continues to get crushed today ... just traded 4.57%.

Higher than Tuesday's peak of 4.51%

*US 10-YEAR YIELD HITS HIGHEST SINCE FEBRUARY AS SELLOFF RESUMES Image
3/6

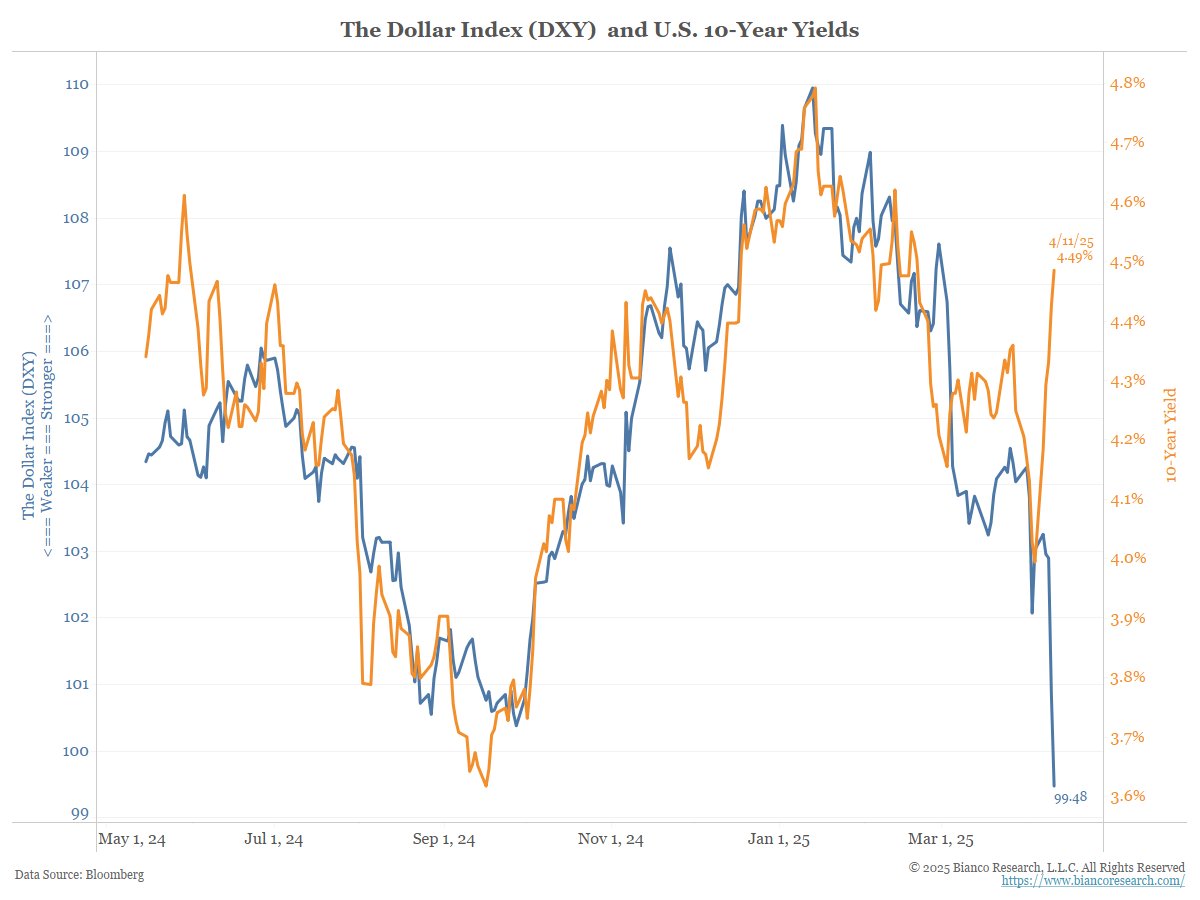
Where is the selling coming from?
Answer: Europe

The dollar is going straight down, and US yields are going straight up as this chart shows.

This relationship has broken this week. Image
4/6

The Euro is going vertical (dollar going straight down). Image
5/6

Over the last 3 days, US yields are going straight up and European yields are going straight down.

Sell US bonds and buying European bonds. Image
6/6

Which Europeans are selling UST?

Unknown but, China is thought to holds hundreds of billions of UST in Belgium (orange) and Luxembourg (blue).

Note not all these holdings are Chinese. But they are way outsized relative to the size of the economies. Image

• • •

Missing some Tweet in this thread? You can try to force a refresh
 

Keep Current with Jim Bianco

Jim Bianco Profile picture

Stay in touch and get notified when new unrolls are available from this author!

Read all threads

This Thread may be Removed Anytime!

PDF

Twitter may remove this content at anytime! Save it as PDF for later use!

Try unrolling a thread yourself!

how to unroll video
  1. Follow @ThreadReaderApp to mention us!

  2. From a Twitter thread mention us with a keyword "unroll"
@threadreaderapp unroll

Practice here first or read more on our help page!

More from @biancoresearch

Jun 14
1/8

Why are we not seeing a "flight-to-quality" into the dollar? Why are bond yields rising?

The answer, I believe, is the markets are NOT viewing Israel/Iran as a safe haven event, but rather a crude oil supply shock story.

IOW, this is NOT viewed as the start of WW III.
🧵
2/8

What is typical when events like happen is we get tables like this.

They are incredibly misleading.

They only highlight known historical events. They don't highlight events that everyone thought was the start of "WW III" but was not.

3/8

Do you remember last year's start of WW III?

The events sound familiar ... Israel attacked Iran and Iran retaliated.

(I'll bet you also forgot WW III also started last year.)

Read 8 tweets
Jun 2
1/12

Polymarket recession odds peaked at 65% on May 1st, the April ISM release date, suggesting Liberation Day and the 20% stock market correction did not damage the economy, as the "soft data" warned.

Subsequent April data confirmed this.

Will May see more of the same?

🧵 Image
2/12

The prevailing narrative in the market for months has been that the labor market is going to fall apart, forcing the Fed to cut rates.

This has not happened, and so far, the "soft" (survey) data have been wildly off in predicting the economy.
3/12

ISM Employment upticked in May from April. The first monthly "May" data point suggests the labor market is still not weakening. Image
Read 12 tweets
May 30
1/9

Why The Fed Is Not Cutting Anytime Soon

The economy is rebounding strongly, and prices are rising.

It would be reckless to cut rates under these conditions.

The market knows this ... see this chart.

🧵 Image
2/9

Collapsing Imports are Positive For GDP

*US GOODS IMPORTS FALL 19.8% M/M, BIGGEST DROP ON RECORD

The amount of imported goods declined in April, as expected. April 2 was Liberation Day, and the rise in tariffs slowed imports. Image
3/9

Slowing imports halved the Trade Deficit in April, also as expected. Image
Read 9 tweets
May 26
1/5

Inflation Update:

May 1st estimated inflation at 1.35%. 25 days later, they are 0.72% higher at 2.07%.

Tariffs?
--
Truflaton measures more goods than services. Goods inflation is lower than services inflation.

So, the rate of change is more important than the level. Image
2/5

Before, Truflation was the Billion Prices Project, which is now called PriceStats and is owned by State Street Bank. The creator is @albertocavallo

On Thursday, the Financial Times featured some of their work. It says the same thing as truflation.

ft.com/content/b27e76…

See the red line on the right. With increased tariffs (red line to the left), the prices of goods originating from China are increasing rapidly.

Also note that the Chinese-originated price rise (red line to the right) began around May 1st, the same time truflation started its upward march.Image
3/5

From the FT:

The Yale Budget Lab says the average US family would pay $2,800 more for the same basket of products purchased last year, should tariffs remain at their current level, with lower-income homes more exposed.

Chinese products being sold in the US have already seen marked increases in retail prices, according to analysis of high-frequency data from PriceStats by Alberto Cavallo of Harvard Business School.
Read 5 tweets
May 24
1/12

Is the consumer paying higher prices due to tariffs?

We don't know for sure, and will not for months, but some numbers suggest they are.

This will surge inflation and keep the Fed on hold for a long while.

Wall Street does not get this.

🧵
2/12

Customs collects tariffs daily and sends most to the Treasury around the 22nd.

On Thursday (May 22), $16B flowed into the Treasury's account.

Tariff collections are now ~$29B ahead of last year's. On Liberation Day, they were ~$5B ahead of last year.

+$24B in 7 weeks. Image
3/12

The US has been importing about $325B to $340B of goods monthly.

According to the latest data, imports have surged in the last few months (through March) as importers rushed goods ahead of Liberation Day. Image
Read 13 tweets
May 1
1/9

ISM was released this morning, marking the first monthly data point since Liberation Day.

It beat expectations and is not giving indications that manufacturers "froze" or "hit a wall" post Liberation Day.
--
*US APRIL ISM MANUFACTURING INDEX FALLS TO 48.7; EST. 47.9 Image
2/9

It is consistent with decent NON-TARIFF growth. Image
3/9

Why did bonds not like it (yields moved higher)?  Maybe prices paid (tariffs?) Image
Read 9 tweets

Did Thread Reader help you today?

Support us! We are indie developers!


This site is made by just two indie developers on a laptop doing marketing, support and development! Read more about the story.

Become a Premium Member ($3/month or $30/year) and get exclusive features!

Become Premium

Don't want to be a Premium member but still want to support us?

Make a small donation by buying us coffee ($5) or help with server cost ($10)

Donate via Paypal

Or Donate anonymously using crypto!

Ethereum

0xfe58350B80634f60Fa6Dc149a72b4DFbc17D341E copy

Bitcoin

3ATGMxNzCUFzxpMCHL5sWSt4DVtS8UqXpi copy

Thank you for your support!

Follow Us!

:(