JWeiland Profile picture
Apr 18 2 tweets 1 min read Read on X
April 18th update:

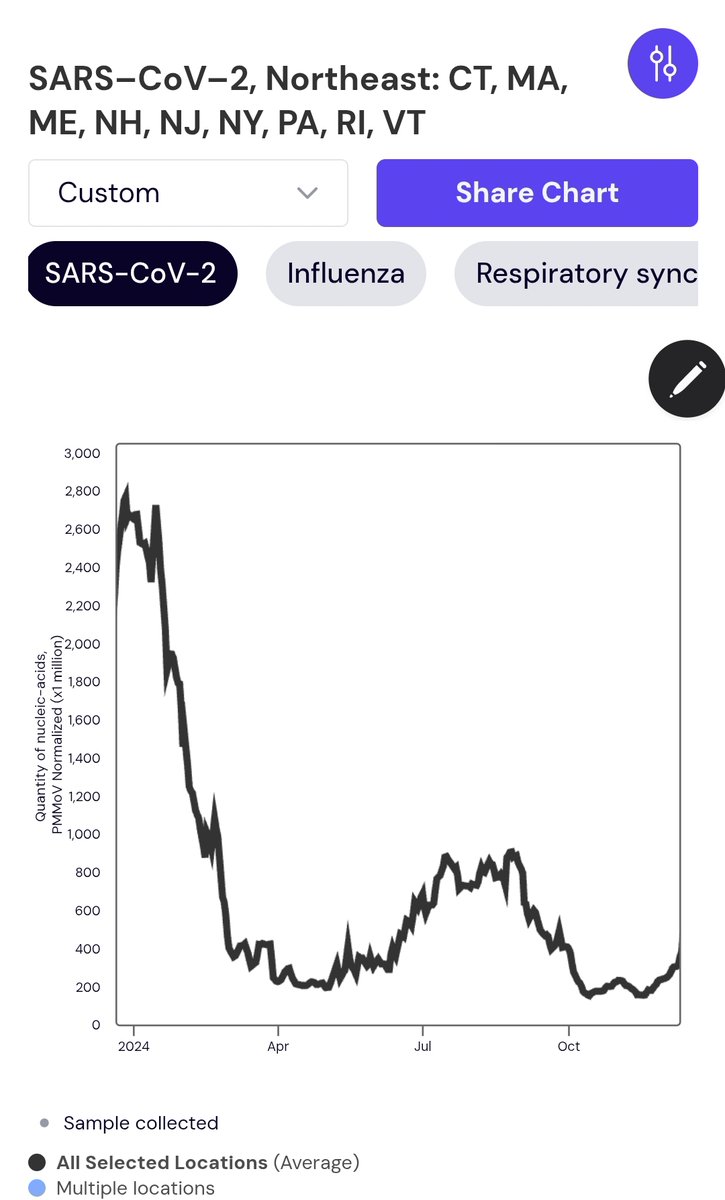
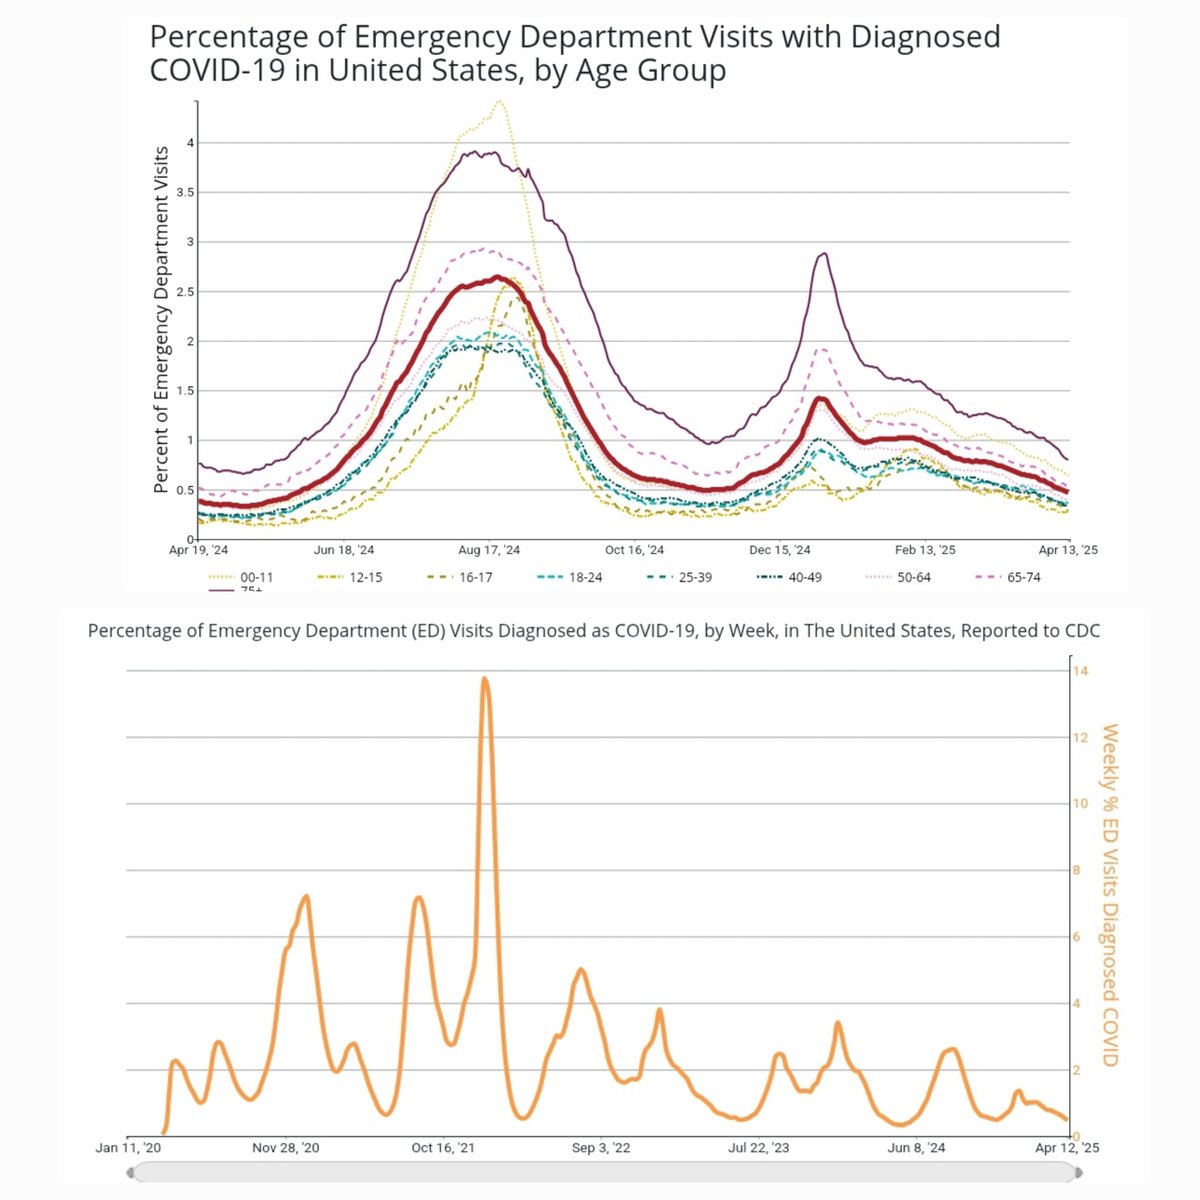
NWSS did not update today, but %ED is plenty good enough to judge trajectory: Down about 12% again this week, as the expected spring decline continues. All 4 regions should be in the "low" cat now.

🔸230,000 new infections/day
🔸~1 in 144 currently infected Image
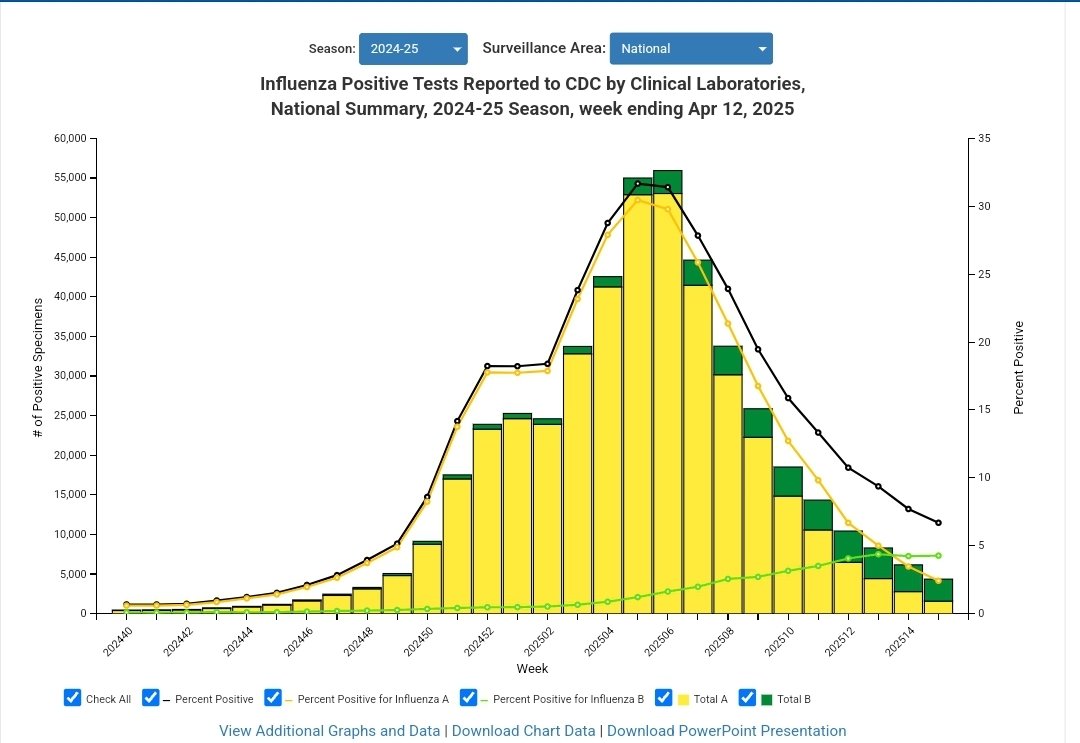
Flu is also down by a factor of 6 since the peak, and RSV by a factor of 9. Flu B's growth seems to have stopped as well. All good signs 👌 Image

• • •

Missing some Tweet in this thread? You can try to force a refresh
 

Keep Current with JWeiland

JWeiland Profile picture

Stay in touch and get notified when new unrolls are available from this author!

Read all threads

This Thread may be Removed Anytime!

PDF

Twitter may remove this content at anytime! Save it as PDF for later use!

Try unrolling a thread yourself!

how to unroll video
  1. Follow @ThreadReaderApp to mention us!

  2. From a Twitter thread mention us with a keyword "unroll"
@threadreaderapp unroll

Practice here first or read more on our help page!

More from @JPWeiland

Apr 14
🧬 Variant Evolution Rate Since 2020

We witnessed a huge weekly growth advantage in new variants for the first year after Omicron arrived, and then to a lesser extent after Pirola. Now we have 9 months of the lowest growth advantages since 2020. 🧵 Image
Both Alpha and Delta had only moderate divergence from their predecessors, but they increased transmission in a time with a mountain of people with no immunity to severe disease. Their waves of cases were moderate, but the waves of death and hospitalization were huge. Image
Omicron came in and wiped more than half of immunity to infection without heavily impacting resistances to severe disease. What it also did was open up a lot of new evolutionary potential for immune escape, and BA.2, BA.5, and XBBs demonstrate that impact well
Read 6 tweets
Mar 11
▶️ An interesting saltation was found yesterday by variant trackers.. 3 samples of a highly divergent BA.3 in South Africa with 57 AA spike mutations. Samples were taken Nov-Jan, so it doesn't have a ton of speed (at least yet), but is worth watching. 1/ Image
It currently lacks both 455 and 456 mutations that have been critical for immune escape in the last 16 months. If it is able to find those before its candle runs out, I think it has a chance to outcompete the current variants. 2/
I completely agree with this take from @LongDesertTrain - I was pessimistic about BA.2.87 due to the uphill battle against JN.1. The current relatively slow movement of variants could give this new BA.3 enough time to evolve mutations to jump start spread
Read 5 tweets
Jan 20
How accurate are my infection estimates? The calibration is based on 2020-early2022 historical WW&case data, so we have no easy way to validate today's calibration in the US.

But we do have *measured* UK prevalence in December 2023 that arrives very close to my US estimates. Image
This is unfortunately about as good of validation as we can have since we don't measure prevalence directly in the US. UK and US are obviously not the same entity, but they do tend to spike together in December each year. Their data was not used to feed my calibration, so it..
..is reassuring that they arrived at very similar numbers on their actual prevalence measurements.

It would be great if the US did a similar measured prevalence study of their own, but we don't have anything like that at the moment.
Read 4 tweets
Dec 27, 2024
The sequence from the 2nd severe H5N1 case in North America (Louisiana) has been released, and again, ⚠️has mutations that favor a2,6. Is it simply a coincidence that both severe cases have 2,6 favoring mutations? Or is this an indication of severity with 2,6?
I don't like this. Image
Link to the CDC update: cdc.gov/bird-flu/spotl…
@HelenBranswell wrote about this development further in STAT
Read 4 tweets
Dec 21, 2024
PSA (again): *Never* use the last 3 or 4 days of WWscan averages. They're always wrong, and I keep seeing this mistake being made. Half the time it's a straight line up or down. The midwest showed a vertical spike a couple days ago then it got reduced by 40% a day later. Image
Image
@WastewaterSCAN is a fantastic resource, but it has an averaging issue in the latest few data points, as they dont have samples from all of their sites yet, so it's not comparing apples to apples. They should consider averaging to tmax-4 days in their algorithm.
By the way here is what the NE looks like with t-5 days Image
Read 4 tweets
Dec 16, 2024
Dec 16th update:

Increasing numbers this week as the holiday season kicks in. I believe the prior week was undersampled and this week was oversampled. ED data shows a slower rise over 2 wks (next post)

🔸286,000 new infections/day
🔸1 in every 112 people currently infected Image
Emergency department data is currently 5 more days up to date than WW, and the trend looks quite different. Slow, steady increases. The reality may lie somewhere between them. I didn't post a WW update last week because I thought the decrease was a mirage. Image
Either way, we are still over 3x lower on case levels than the prior two years at this time. But we are getting back to moderate levels of spread- just not the large surge we are used to at this time.

I have kept my calibration consistent.
Read 4 tweets

Did Thread Reader help you today?

Support us! We are indie developers!


This site is made by just two indie developers on a laptop doing marketing, support and development! Read more about the story.

Become a Premium Member ($3/month or $30/year) and get exclusive features!

Become Premium

Don't want to be a Premium member but still want to support us?

Make a small donation by buying us coffee ($5) or help with server cost ($10)

Donate via Paypal

Or Donate anonymously using crypto!

Ethereum

0xfe58350B80634f60Fa6Dc149a72b4DFbc17D341E copy

Bitcoin

3ATGMxNzCUFzxpMCHL5sWSt4DVtS8UqXpi copy

Thank you for your support!

Follow Us!

:(