Great catch! The main CDC wastewater dashboard has not updated, but @CyFi10 caught that the data did update on a single national graph elsewhere on the CDC website.
This reduces the estimate to 1 in 196 (0.5%) actively infectious nationally.
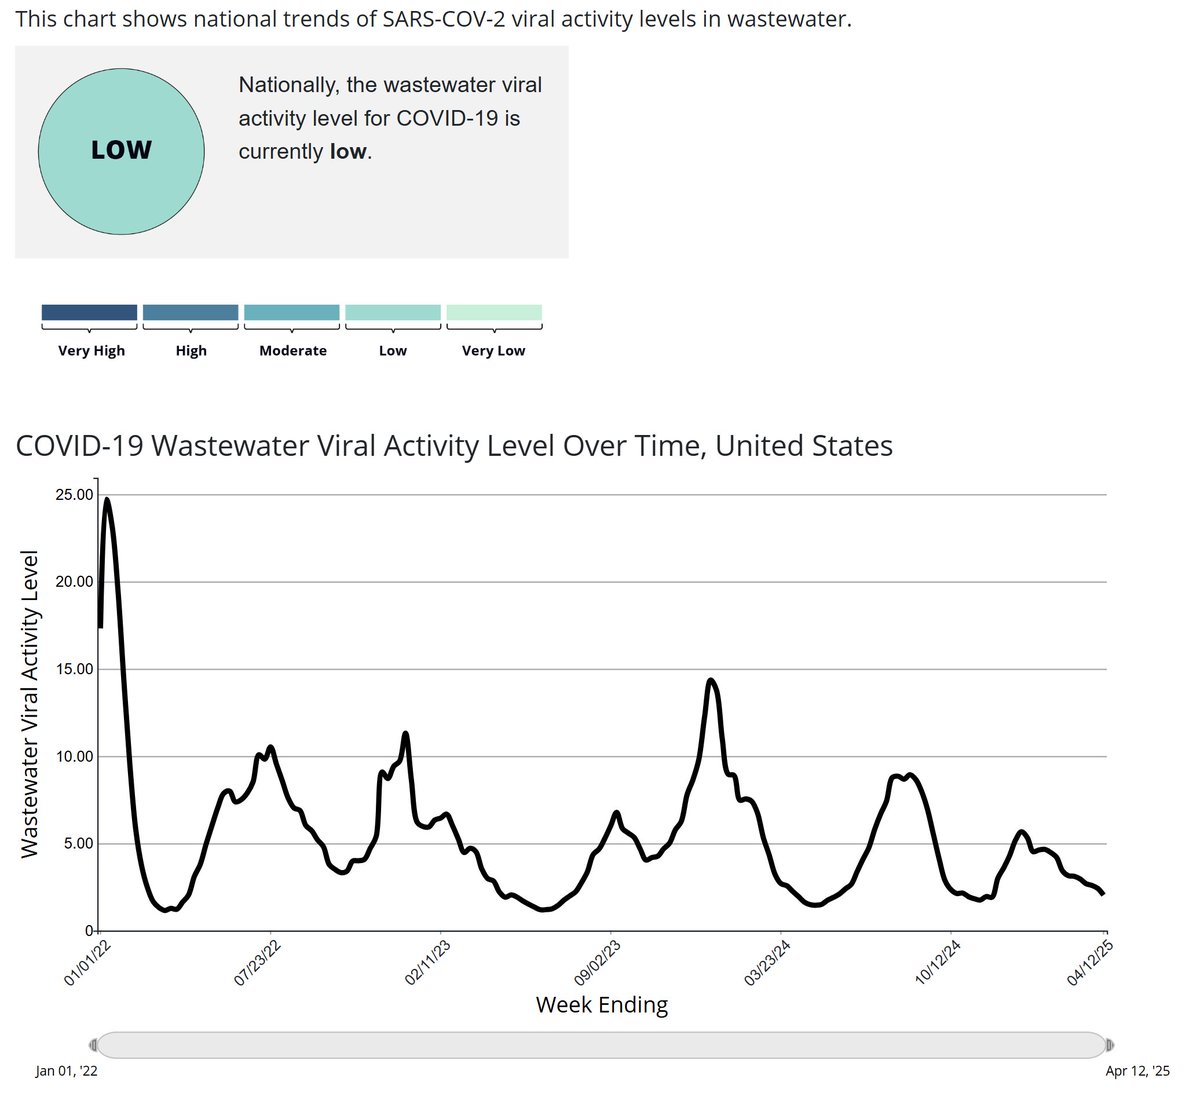
They may be doing some incomplete (sloppy) web updates on the CDC website. Notice that on the page @CyFi10 mentions, it has a color legend but does not actually use the colors. The Y-axis uses real numbers, like last summer.
• • •
Missing some Tweet in this thread? You can try to
force a refresh
🔹2.2 million weekly infections
🔹1 in 149 actively infectious
🔹>100,000 LC cases resulting from the week's infections
🔹>800 deaths resulting from the week's infections
🔹"Lull" transmission steady/slightly declining
🧵2/5 | PMC Dashboard, Apr1il 14, 2025 (U.S.)
Year-over-year transmission (red line, lower left) is tracking the median (grey), year 4 (yellow), and year 5 (orange) closely.
If that trend continues, expect steady yet bumpy transmission the next couple months, until June/July.
🧵3/5 | PMC Dashboard, Apr1il 14, 2025 (U.S.)
The heat map shows only 4 states in the CDC 'high' level and none in the 'very' high level.
Check local data. Those timing activities to lulls may see a clear opportunity.
The NIH Clinical Center drops universal masking after 5 months of protecting patients, family, & staff.
Wastewater-derived estimates indicate 2.79 million Americans are getting Covid per week AND top actuaries suggest an American dies of Covid every 3 minutes.
🔹1 in 120 actively infectious
🔹1 in 3 chance of exposure in a room of 50
🔹2.8 million weekly infections
🔹>140,000 resulting LC cases from the week's infections
🔹>1,000 deaths resulting from the week's infections
2) Watch this video to understand how we use excess death data from one of the world's largest reinsurers to estimate how this week's infections will result in >1,000 deaths.
🔹800-1,400 deaths expected to result from this week's infections (new stat, see video next Tweet)
🔹100,000+ Long Covid conditions to result from this week's infections
🔹1 in 142 actively infectious today
🧵2 of 5
PMC Dashboard, March 31, 2025 (U.S.)
This video explains U.S. COVID excess death statistics, which we have incorporated into the dashboard.
🔥109,000-175,000 people in the U.S. are expected to die as a result of COVID in 2025, based on estimates derived from Swiss Re
🔥COVID deaths expected to be on par with lung cancer in the U.S. in 2025
🔥Death data added to the dashboard
2) Full video links to learn more about COVID #ExcessDeaths in the U.S.
🔹3 million new weekly infections in a persistent "lull" of substantial transmission
🔹1 in 107 (0.9%) of the population actively infectious
🔹1 in 3 regions in high/very high transmission (16 states and DC)
PMC Dashboard, Mar 24, 2025 (U.S.)
🧵2/5
We have had a steady state of about a half million infections the past several weeks. That's over 50 million estimated infections so far in 2025.
In a room of 40-50 people, there's a 1-in-3 chance of exposure if no testing/isolation.
PMC Dashboard, Mar 24, 2025 (U.S.)
🧵3/5
There's a good chance of steady transmission the next month. Often, we'd head into a low lull about now. BUT there are no universal precautions, immunity is waning from the fall & winter 2023-24, & viral evolution looks less 'lucky.'