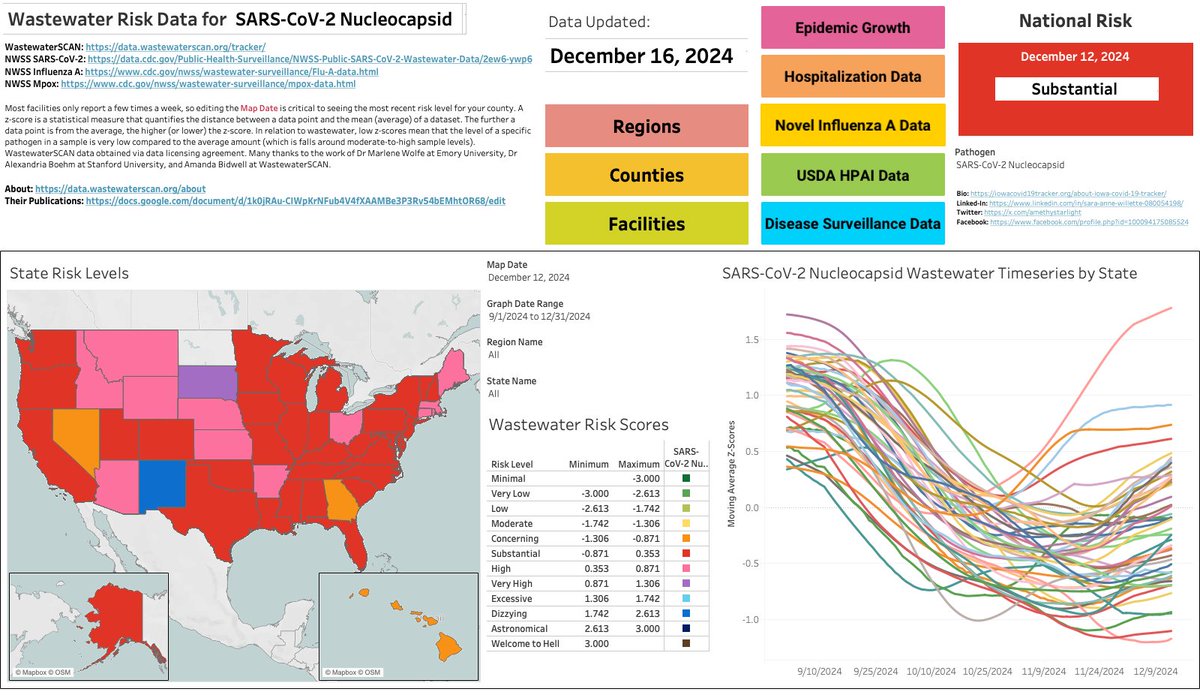
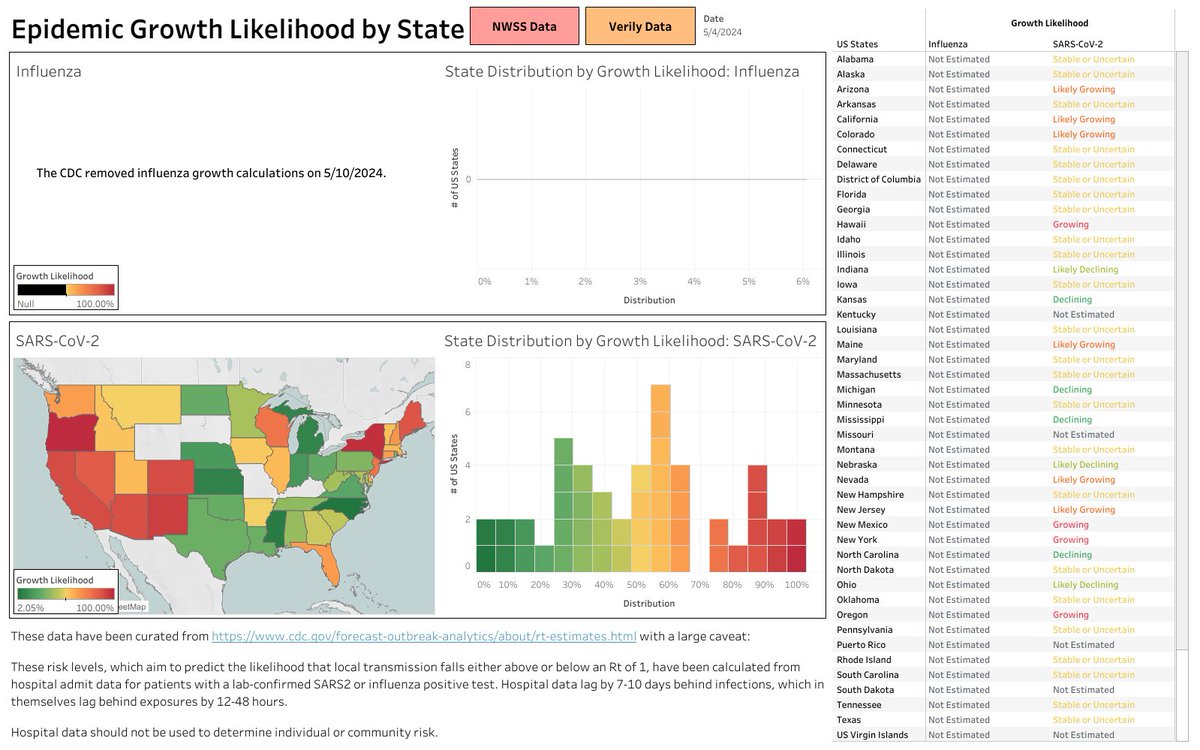
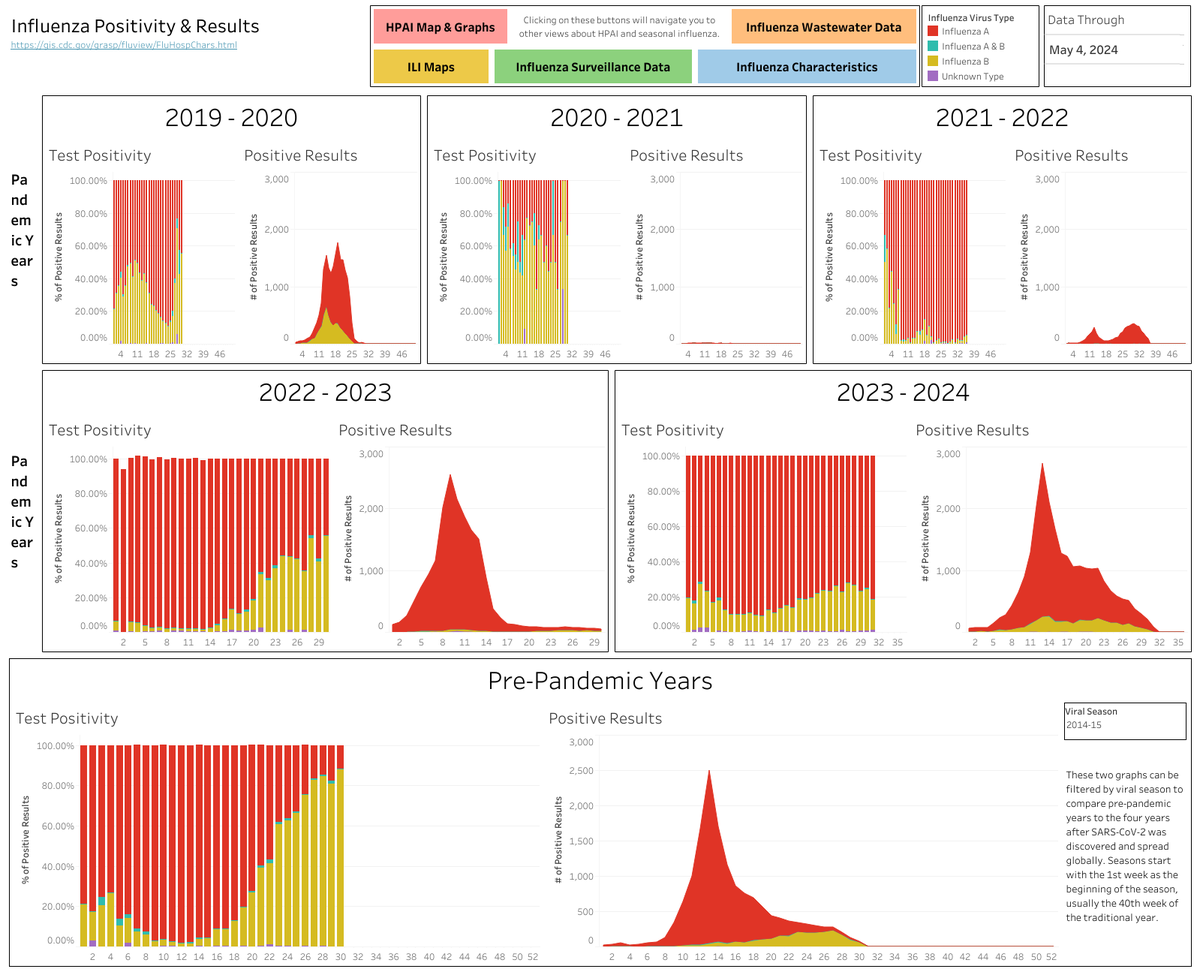
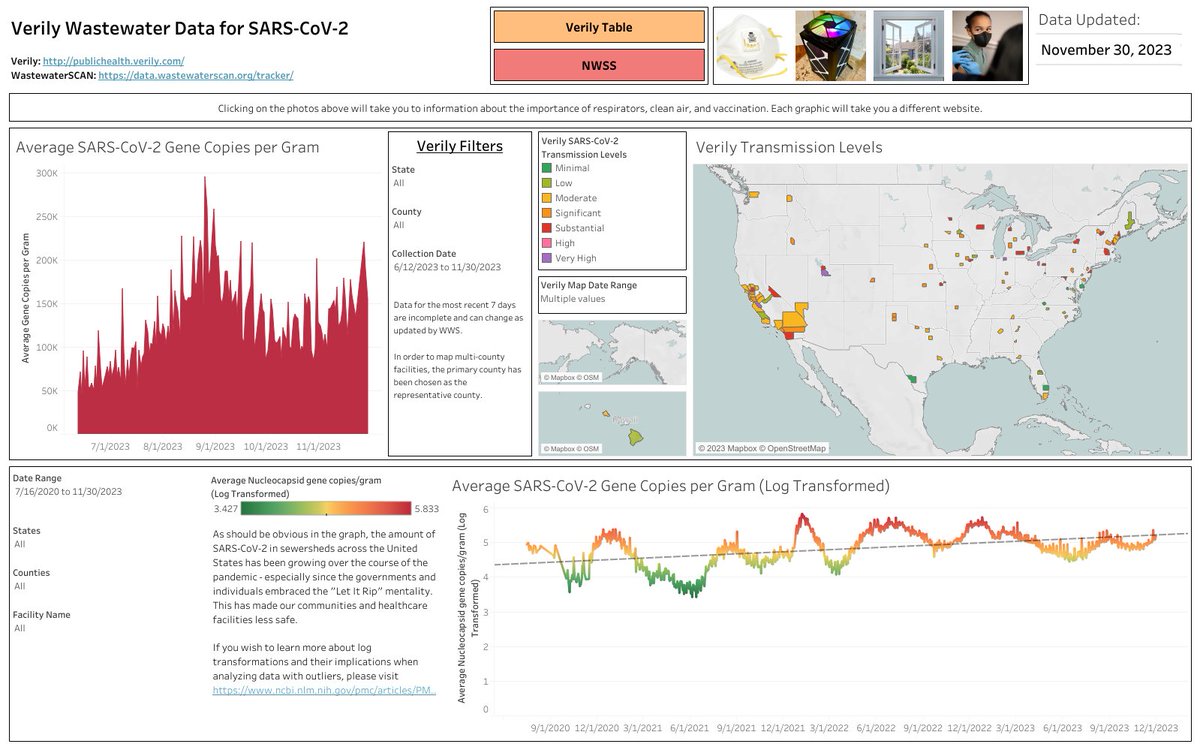
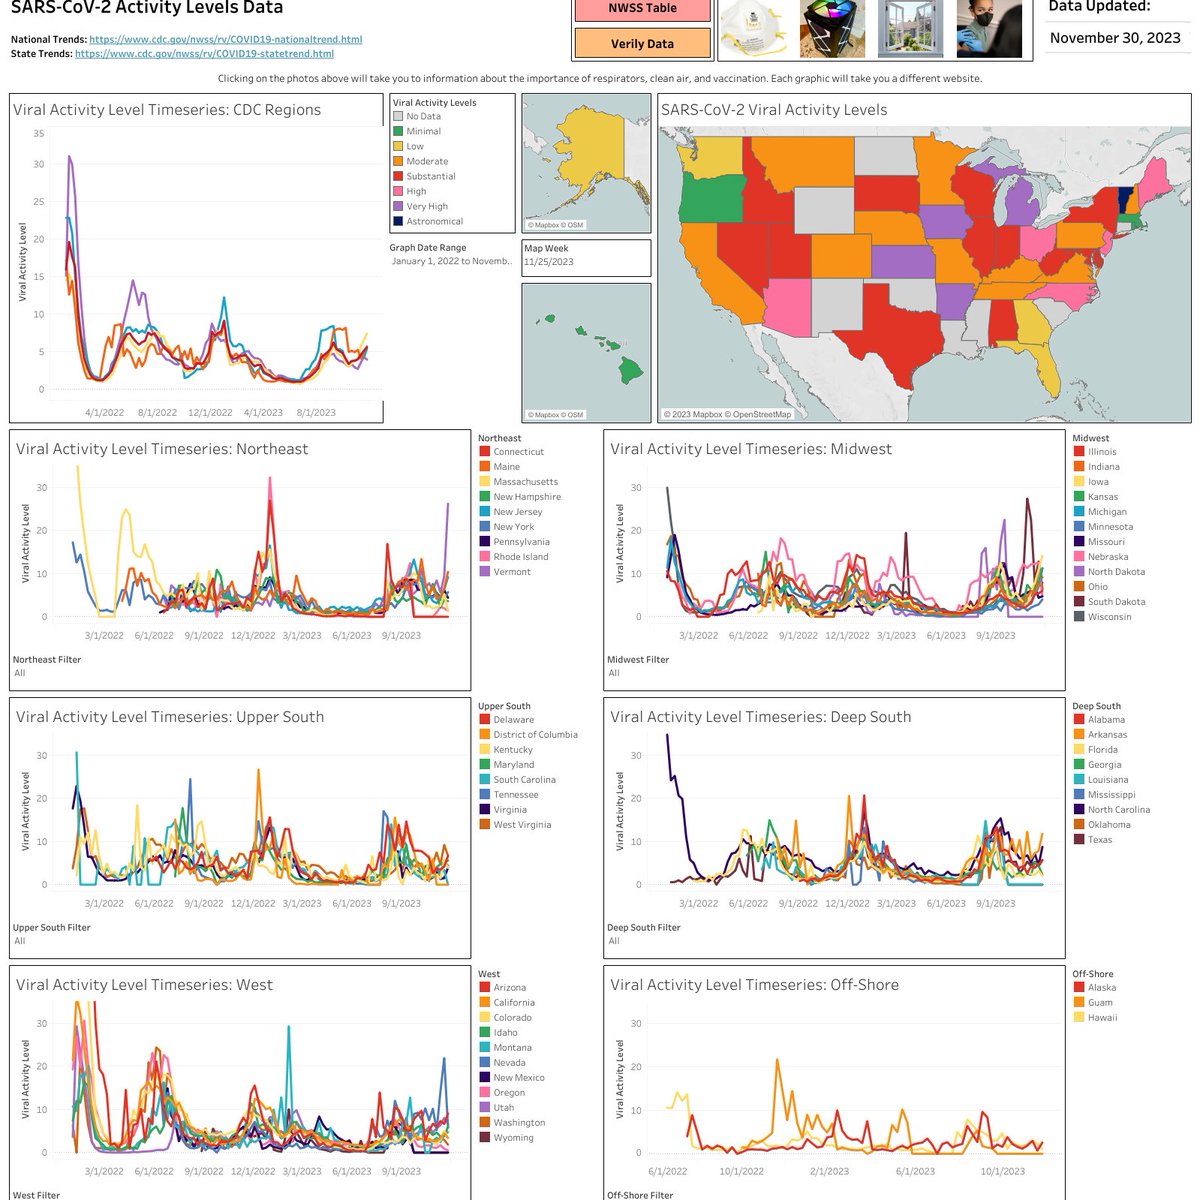
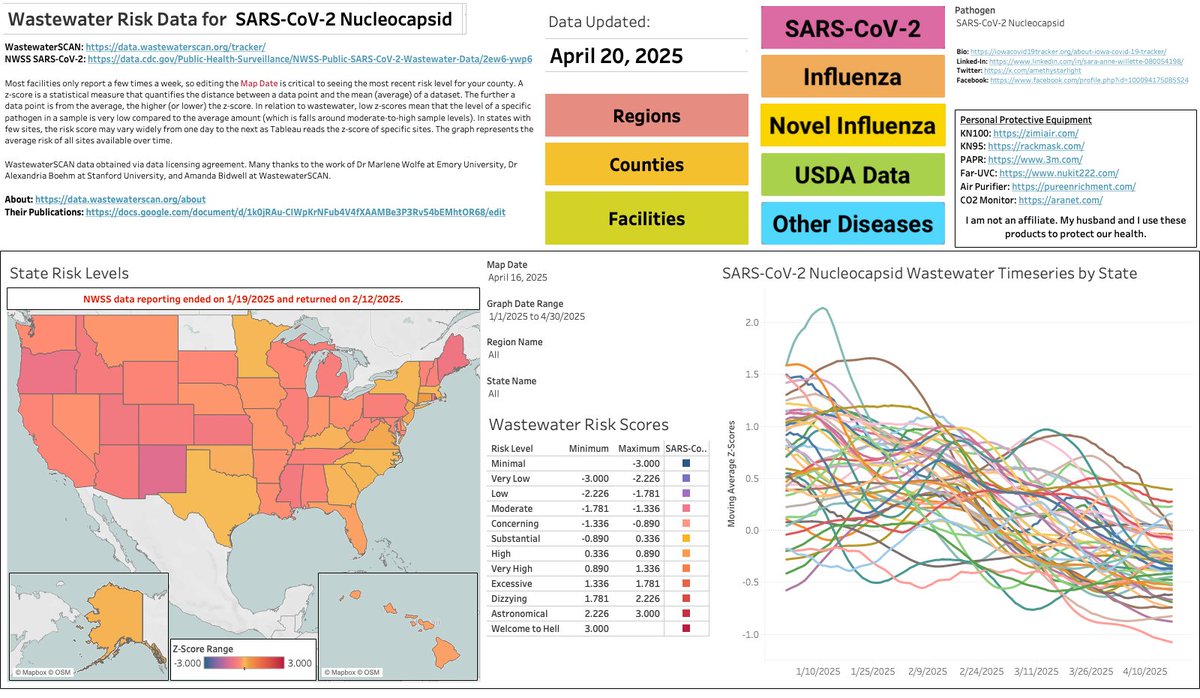
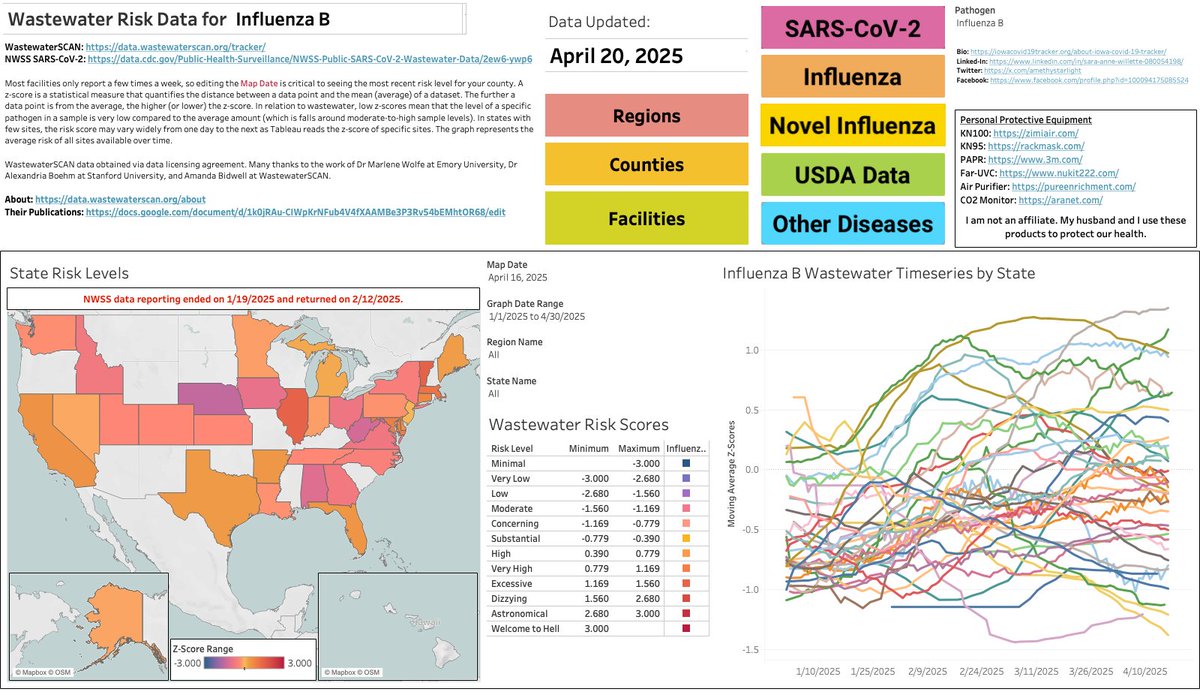
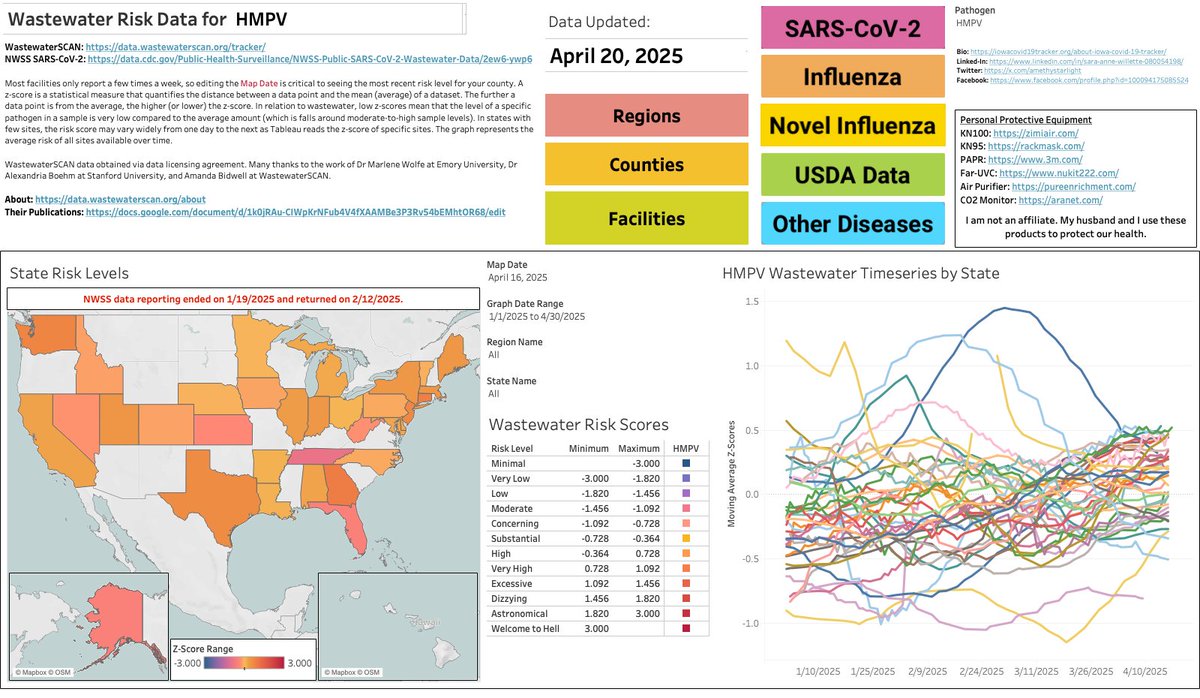
SARS2 is decreasing, while influenza B and HMPV are rising. RSV is rising in the southeast, while decreasing elsewhere.

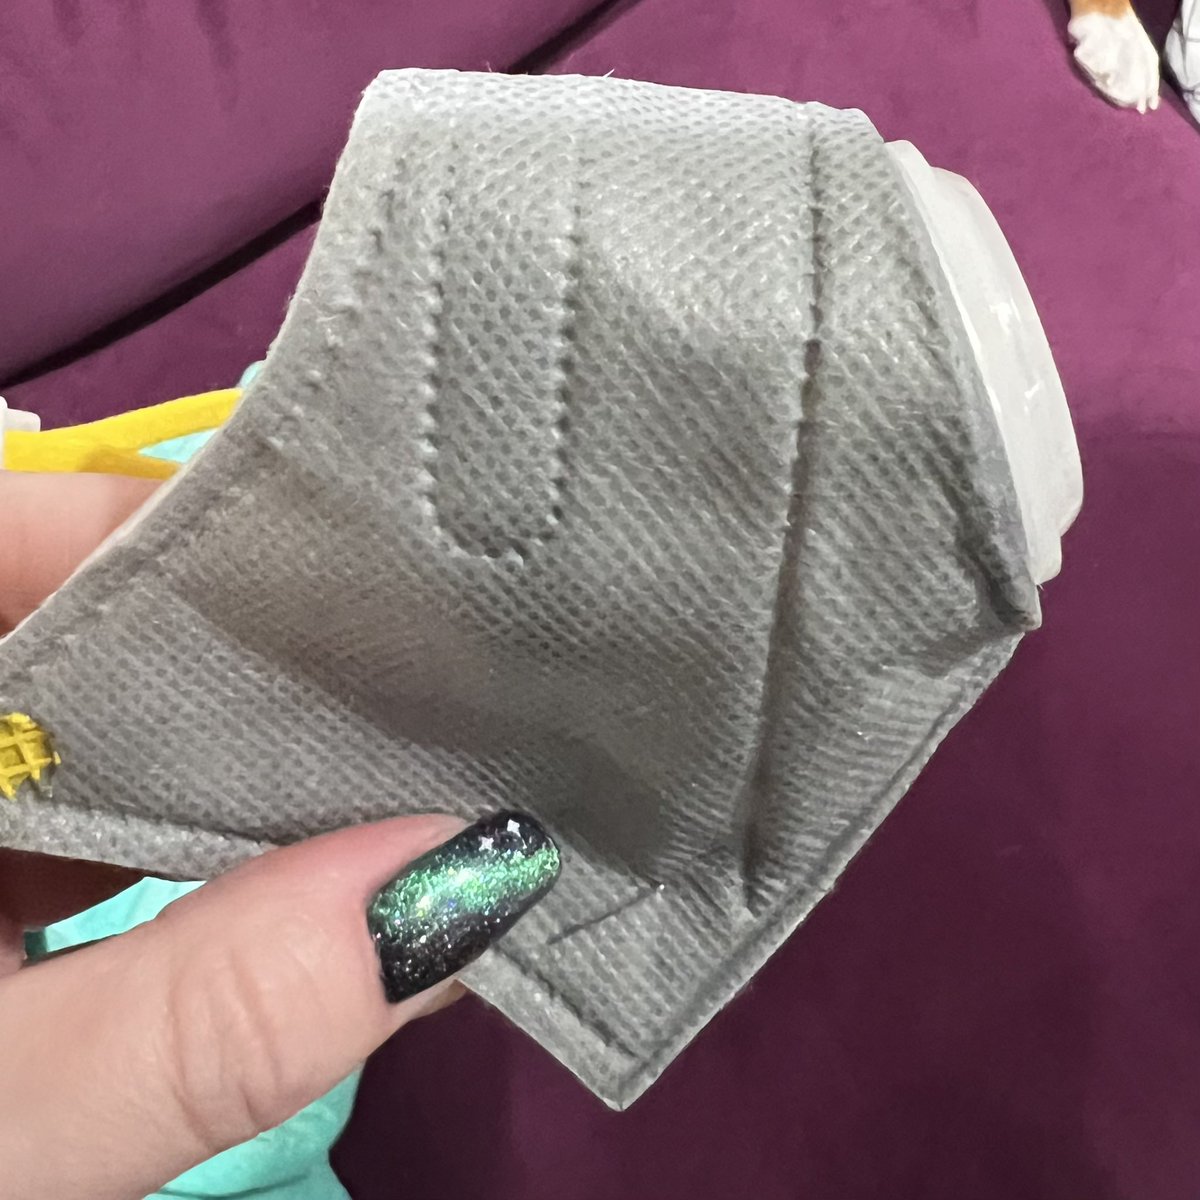
Please wear a respirator in shared air spaces and try to do as much outdoors as possible. An ounce of precaution today protects your current and future health. Image
Image
Image
Image
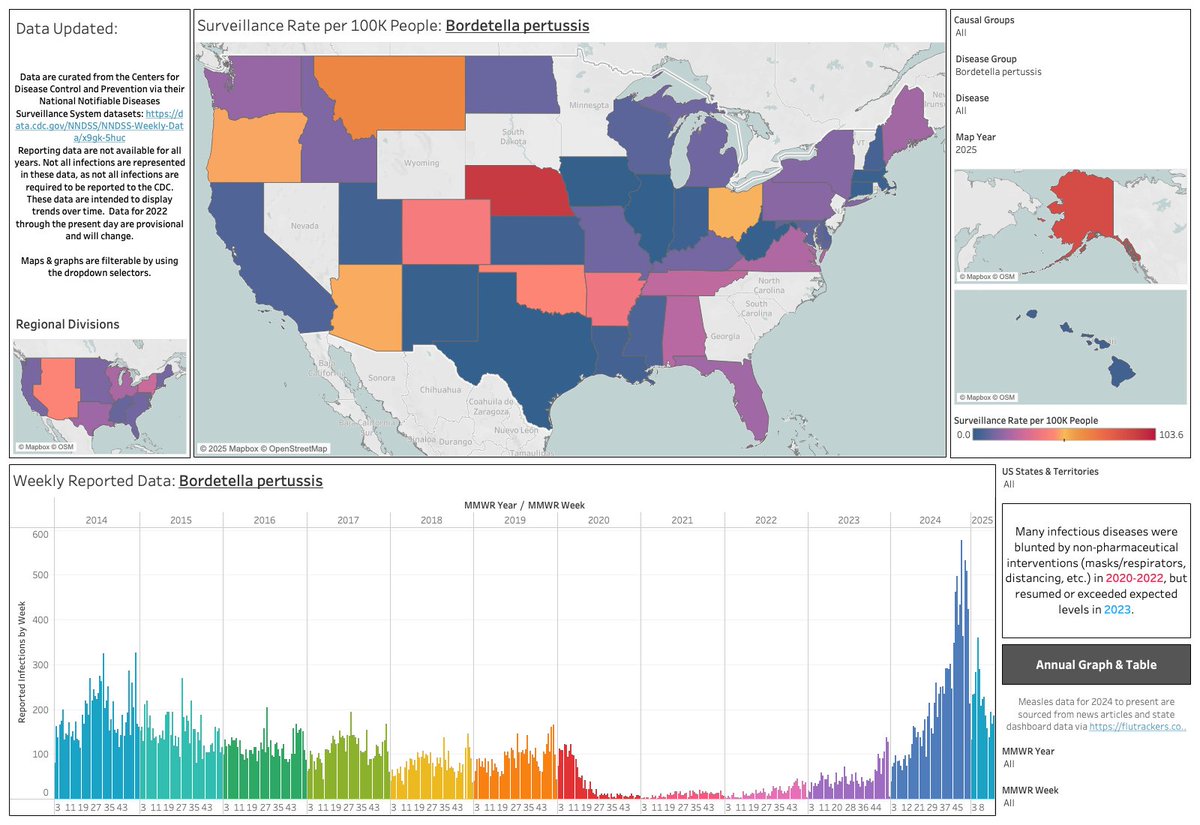
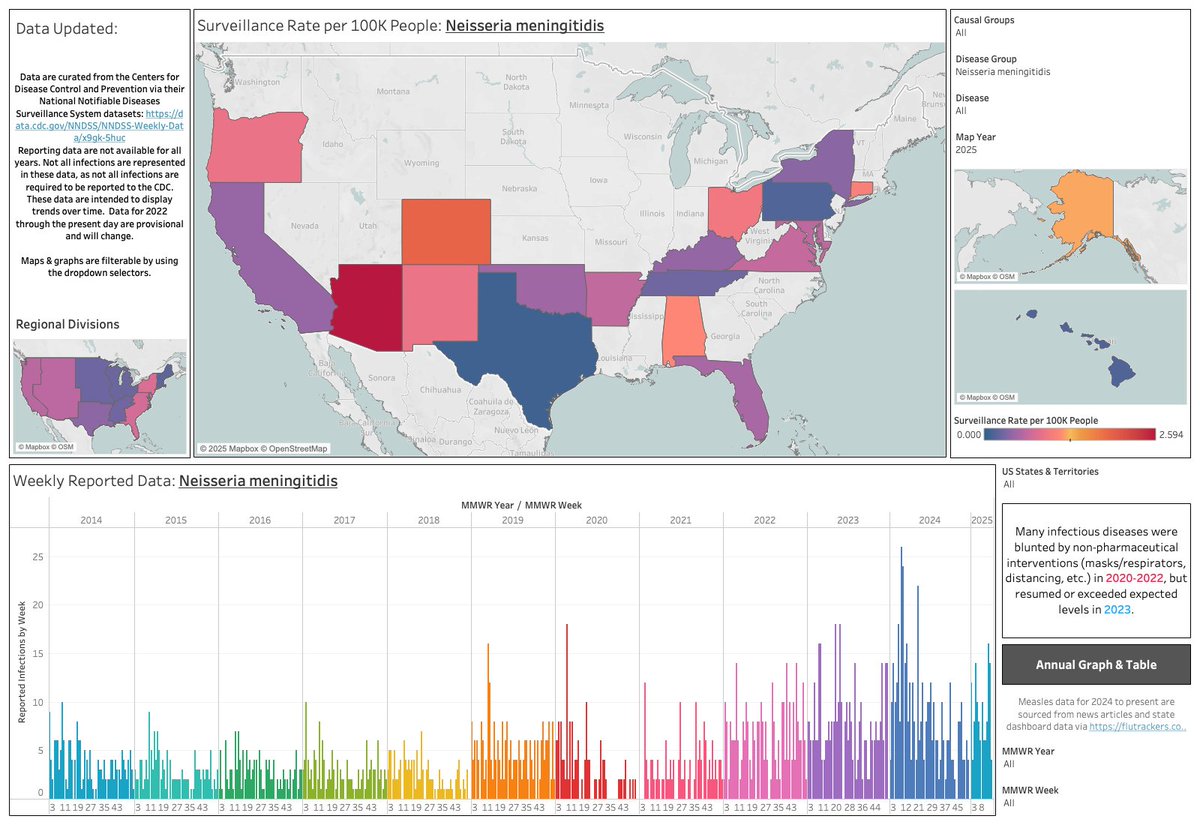
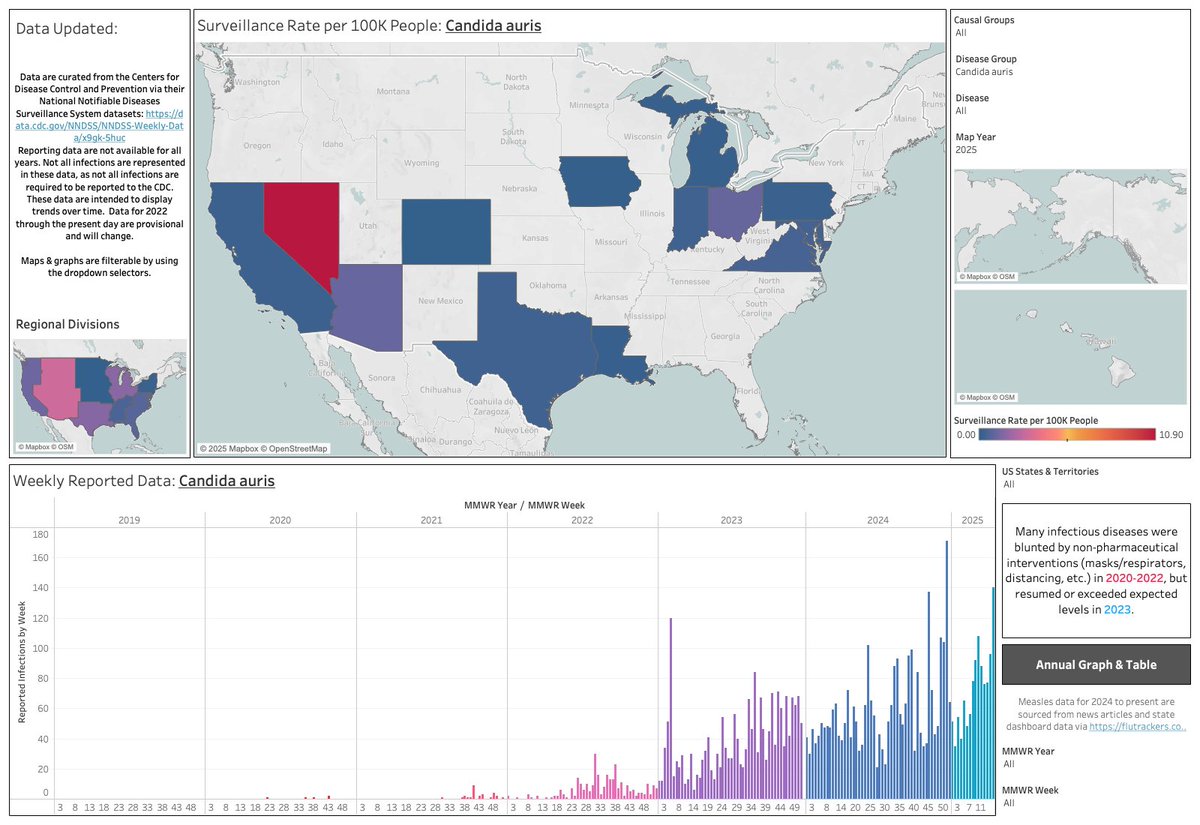
Many other infectious diseases are spreading, including measles and meningitis. Image
Image
Image
Image

• • •

Missing some Tweet in this thread? You can try to force a refresh
 

Keep Current with Sara Anne Willette ♿️🌈👩🏻‍💻𓅆

Sara Anne Willette ♿️🌈👩🏻‍💻𓅆 Profile picture

Stay in touch and get notified when new unrolls are available from this author!

Read all threads

This Thread may be Removed Anytime!

PDF

Twitter may remove this content at anytime! Save it as PDF for later use!

Try unrolling a thread yourself!

how to unroll video
  1. Follow @ThreadReaderApp to mention us!

  2. From a Twitter thread mention us with a keyword "unroll"
@threadreaderapp unroll

Practice here first or read more on our help page!

More from @amethystarlight

Dec 16, 2024
We are in the surge. Buckle up and wear your respirator.

public.tableau.com/app/profile/sa…Image
Image
There's loads of virus out there, both SARS2 and influenza.
public.tableau.com/views/USCDCVir…Image
Image
Louisiana now has a presumptive H5 positive that is hospitalized.
public.tableau.com/app/profile/sa…Image
Image
Image
Read 4 tweets
Jul 22, 2024
United States Epidemic Update: 7/22/2024

Please wear a respirator.

**Death data are partial/provisional.**
2020-2024 SARS2 Deaths: 1,194,578 (+493)
2020-2024 Influenza Deaths: 21,764 (+23)


public.tableau.com/app/profile/sa…


Image
Image
Image
Image
HPAI maps cover the most recent 4 months, while graphs are from the inception of @USDA tracking.

public.tableau.com/app/profile/sa…

Image
Image
Please get your annual influenza vaccine & wear a respirator indoors.


public.tableau.com/views/USSARS-C…
public.tableau.com/views/USRESP-N…


Image
Image
Image
Image
Read 5 tweets
May 13, 2024
United States Epidemic Update: 5/13/2024

Please wear a respirator.

**Death data are partial/provisional.**
2020-2024 SARS2 Deaths: 1,190,494 (+515)
2020-2024 Influenza Deaths: 21,131 (+97)
2023/2024 Long COVID Deaths: 2,057 (+8)


iowacovid19tracker.org
iowacovid19tracker.org/hospitals/


timeseries graphs of sars2 viral activity by region and states within those regions, choropleth map of transmission on the most recent reporting date, timeseries graphs of rolling wastewater values for facilities in a chosen state (default is MA)
timeseries graphs of sars2 viral prevalence and a log transformed graph of the same data choropleth map of transmission on the most recent reporting week, timeseries graphs of rolling wastewater values for facilities in a chosen state (default is MA)
choropleth maps of epidemic growth likelihood for sars2 and influenza, as well as distribution plots
weekly choropleth map and cumulative choropleth map for sars2 timeseries showing hospitalization rates over multiple years
Please get your annual influenza vaccine & wear a respirator indoors.

iowacovid19tracker.org/influenza


timeseries graphs of flu viral activity by region and states within those regions, choropleth map of transmission on the most recent reporting date, log transformed graphs for both A and B
influenza like illness activity maps for the most recent reporting week annually starting 2008
Surveillance cases by season
weekly choropleth map and cumulative choropleth map for influenza timeseries showing hospitalization rates over multiple years
HPAI maps cover the most recent 4 months, while graphs are from the inception of @USDA tracking.

iowacovid19tracker.org/influenza


Choropleth map and time series for HPAI outbreaks
Choropleth map and time series for HPAI outbreaks in poultry birds
Choropleth map and time series for HPAI outbreaks in dairy cattle
Read 5 tweets
Dec 2, 2023
I made some pretty big changes to my wastewater visualizations today. I hope that these are more accessible and granular than what the @CDCgov has provided, all built on the data they (and Verily) provide.

iowacovid19tracker.org

timeseries graphs of sars2 viral activity by region and states within those regions, choropleth map of transmission on the most recent reporting date, timeseries graphs of rolling wastewater values for facilities in a chosen state (default is NJ)
Image
The first big change is having SARS2 viral activity levels by state, region, and the country-as-a-whole. Each portion of this viz can be filtered by state(s) and date range. Available data begin near the apex of BA.1. I broke out the "South" and the "West" into smaller groups. timeseries graphs of sars2 viral activity by region and states within those regions, choropleth map of transmission on the most recent reporting date
The second big change is having facility-level data visible and filterable by state and county. timeseries graphs of rolling wastewater values for facilities in a chosen state (default is NJ)
Read 4 tweets
Nov 21, 2023
I promised photos and adjustments for the doggie PM2.5 respirators I found on Temu:

#immunocompromised #CommonVariableImmuneDeficiency
#DogsDeserveProtectionToo share.temu.com/8jocvHvYRoA
A red and white Basenji wearing a PM2.5 respirator.
The muzzle on the small was slightly large on Miss Bean, so I used the Aura N95 staple trick for smaller feminine faces to tighten the mask to her snoot. The masks have a nose wire, in case dogs with more narrow snoots need it molded. A staple about 1/2” from the base of the muzzle.
I plan to use the respirator as a muzzle liner for when we need emergent and/or routine veterinary care. The duck muzzle provides more support for the respirator than the flimsy yellow strap does. A red and white Basenji wearing her yellow duck muzzle over the doggie respirator.
Read 4 tweets
Jun 4, 2023
Iowa SARS2+ & Influenza Update: 6/4/2023

@IowaHHS reporting goes on hiatus for summer, limiting respiratory reports to once monthly. I will supplement with wastewater.

Weekly Surveillance SARS2+: 57 (32% weekly increase)
Weekly Acute SARS2 Deaths: 7

iowacovid19tracker.org timeseries of wastewater sa...
If you click through to my website, you can change the state/county selected to show your county by using the dropdown selector. All data are available based on when those data were initially shared by @CDCgov, @HHSGov, @CMSGov, and/or @WHO.

iowacovid19tracker.org timeseries of deaths by age...
My data analytics are 100% financially supported by wonderful people wanting to stay informed and safe. It's how I "pay the bills," i.e. cover website & Tableau fees. I never have had nor will ever have ads on my website.

patreon.com/SaraAnneWillet… timeseries of excess deathstimeseries of deaths by age...
Read 5 tweets

Did Thread Reader help you today?

Support us! We are indie developers!


This site is made by just two indie developers on a laptop doing marketing, support and development! Read more about the story.

Become a Premium Member ($3/month or $30/year) and get exclusive features!

Become Premium

Don't want to be a Premium member but still want to support us?

Make a small donation by buying us coffee ($5) or help with server cost ($10)

Donate via Paypal

Or Donate anonymously using crypto!

Ethereum

0xfe58350B80634f60Fa6Dc149a72b4DFbc17D341E copy

Bitcoin

3ATGMxNzCUFzxpMCHL5sWSt4DVtS8UqXpi copy

Thank you for your support!

Follow Us!

:(