I've just seen some staggering data on how badly infections are affecting urgent care here *now*.
It's hard to comprehend.
It's hard to get your head round it.
You need to see it to believe it.
👀
It's hard to comprehend.
It's hard to get your head round it.
You need to see it to believe it.
👀
I'm going to try to show it visually.
I'm going to show three graphs of the weekly numbers of people facing one of the types of delay in urgent care.
Pre-pandemic.
Emergency Phase.
Rampant Spread.
*all with the same scale*
I'm going to show three graphs of the weekly numbers of people facing one of the types of delay in urgent care.
Pre-pandemic.
Emergency Phase.
Rampant Spread.
*all with the same scale*
Pre-pandemic:
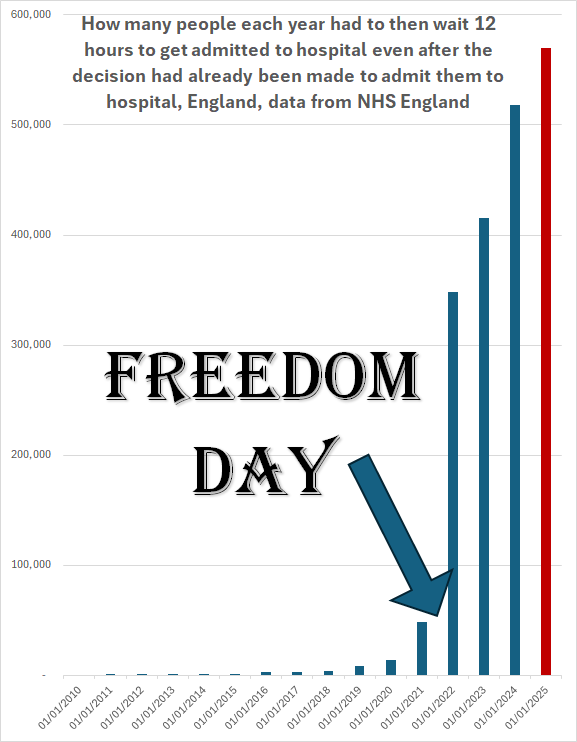
This is the sad graph of how many patients had to wait *12 hours* to be admitted after the decision to admit them to hospital was made.
Depressing, right.
We're talking about urgent care here.
This is the sad graph of how many patients had to wait *12 hours* to be admitted after the decision to admit them to hospital was made.
Depressing, right.
We're talking about urgent care here.
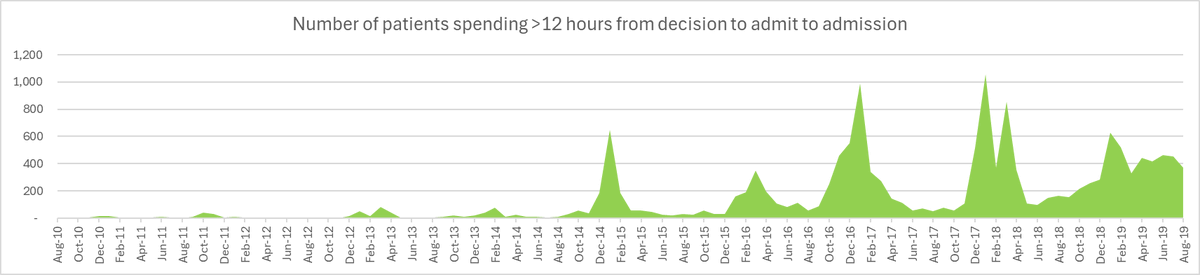
Emergency Phase:
Then Covid arrives.
You probably look at this and think it's bad, right?
Then Covid arrives.
You probably look at this and think it's bad, right?
It's in tiny pockets in 2019/20, not rampant yet.
And then in 2020/2021 it's potentially rampant, but *mitigations* are holding it in check still.
And then in 2020/2021 it's potentially rampant, but *mitigations* are holding it in check still.
Then it's going to go rampant...
What do you reckon it's going to do.
Double those figures?
Double those figures?
Triple them?
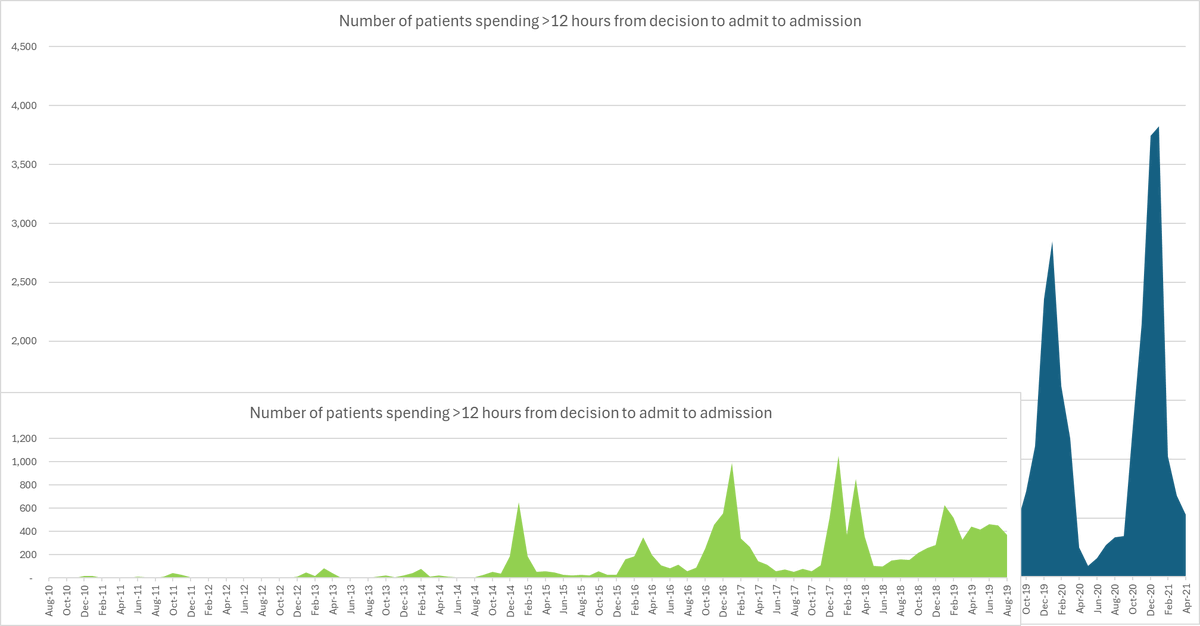
Rampant Spread:
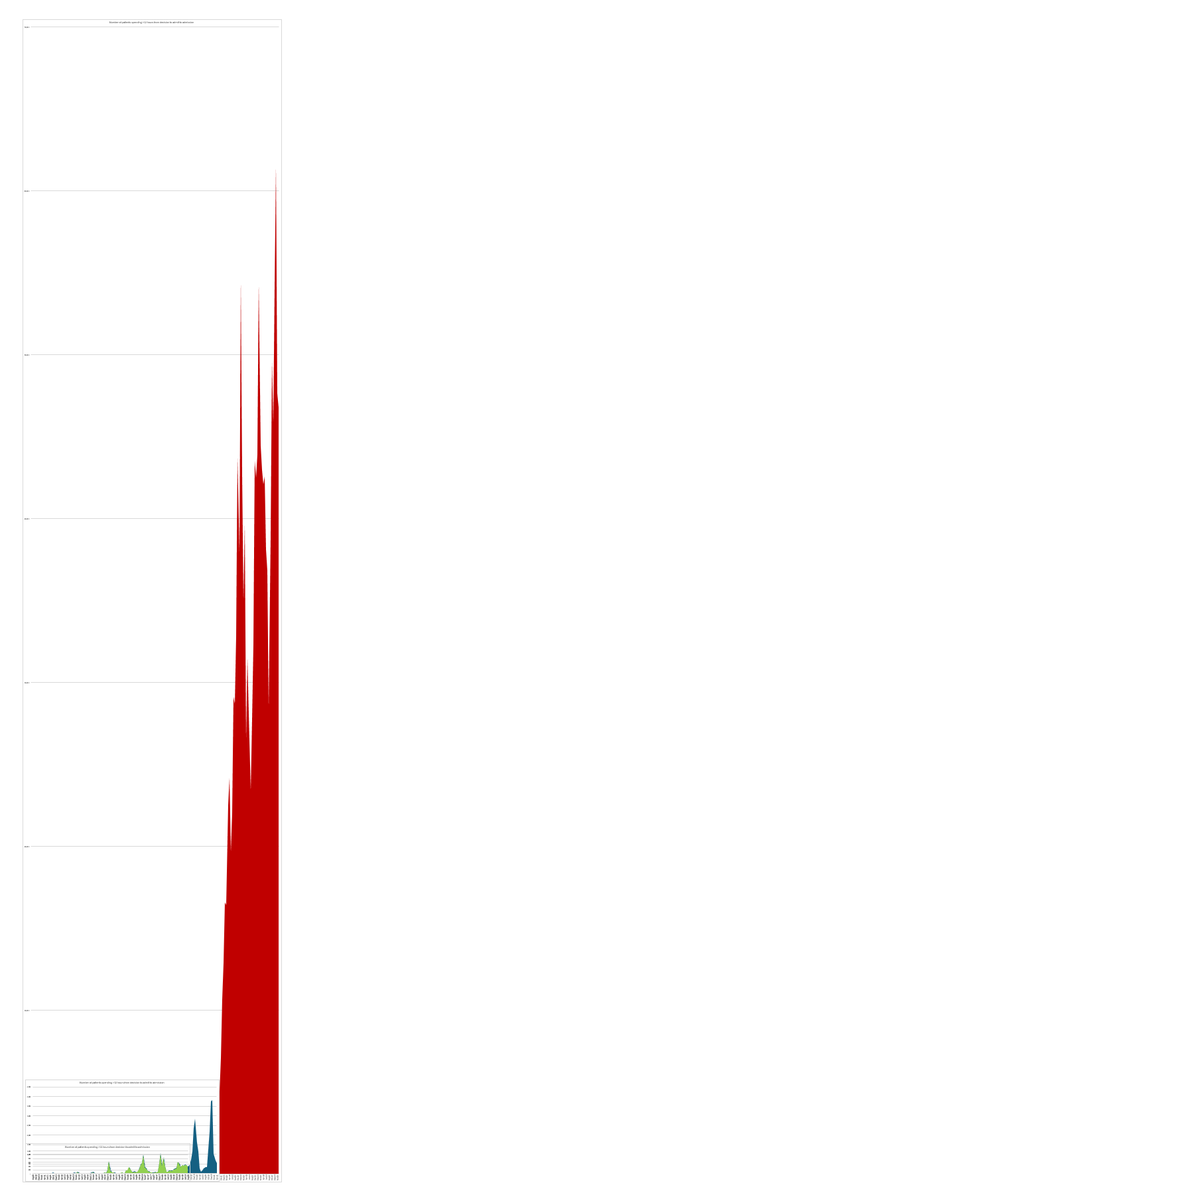
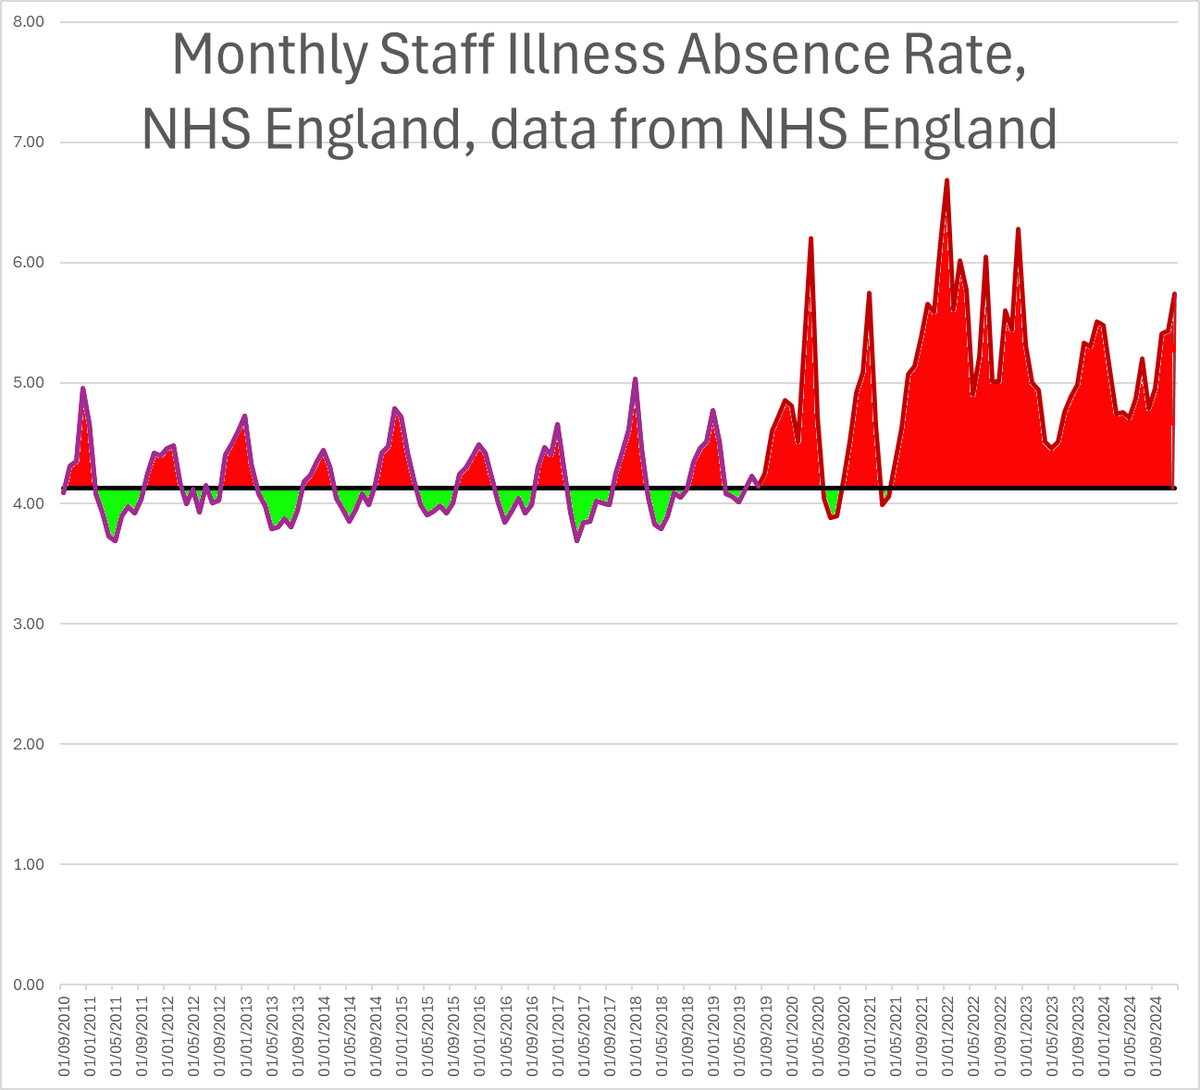
You need to *click* on this image to see the *mindboggling* change in number of people waiting 12 hours for treatment when they attend urgent care.
You need to *click* on this image to see the *mindboggling* change in number of people waiting 12 hours for treatment when they attend urgent care.
*urgent care*, remember.
That's what...
Urgent.
You actually may need to zoom into that image to see the original graph.
You actually may need to zoom into that image to see the original graph.

It's staggering.
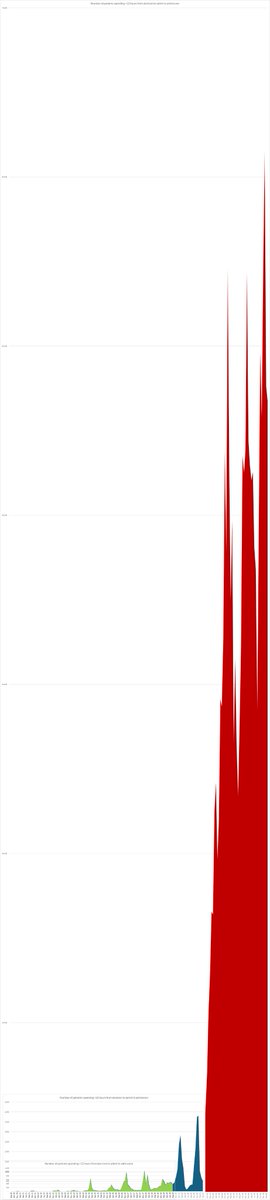
The thing that was different between the winter of 2020/2021 and the winter of 2021/2022?
COVID WAS ALLOWED TO RUN RAMPANT EVERYWHERE FROM JUNE 2021 ONWARDS.
COVID WAS ALLOWED TO RUN RAMPANT EVERYWHERE FROM JUNE 2021 ONWARDS.
And the worst winter of all for delays to urgent care?
NOW.
NOW.

How in the fork can anyone think this is going to get better without stopping the rampant spread of airborne infections?
Here's a graph of the rolling 6 month totals of people who have had to wait 12 hours from decision to admit to admission.

IT'S GETTING WORSE.
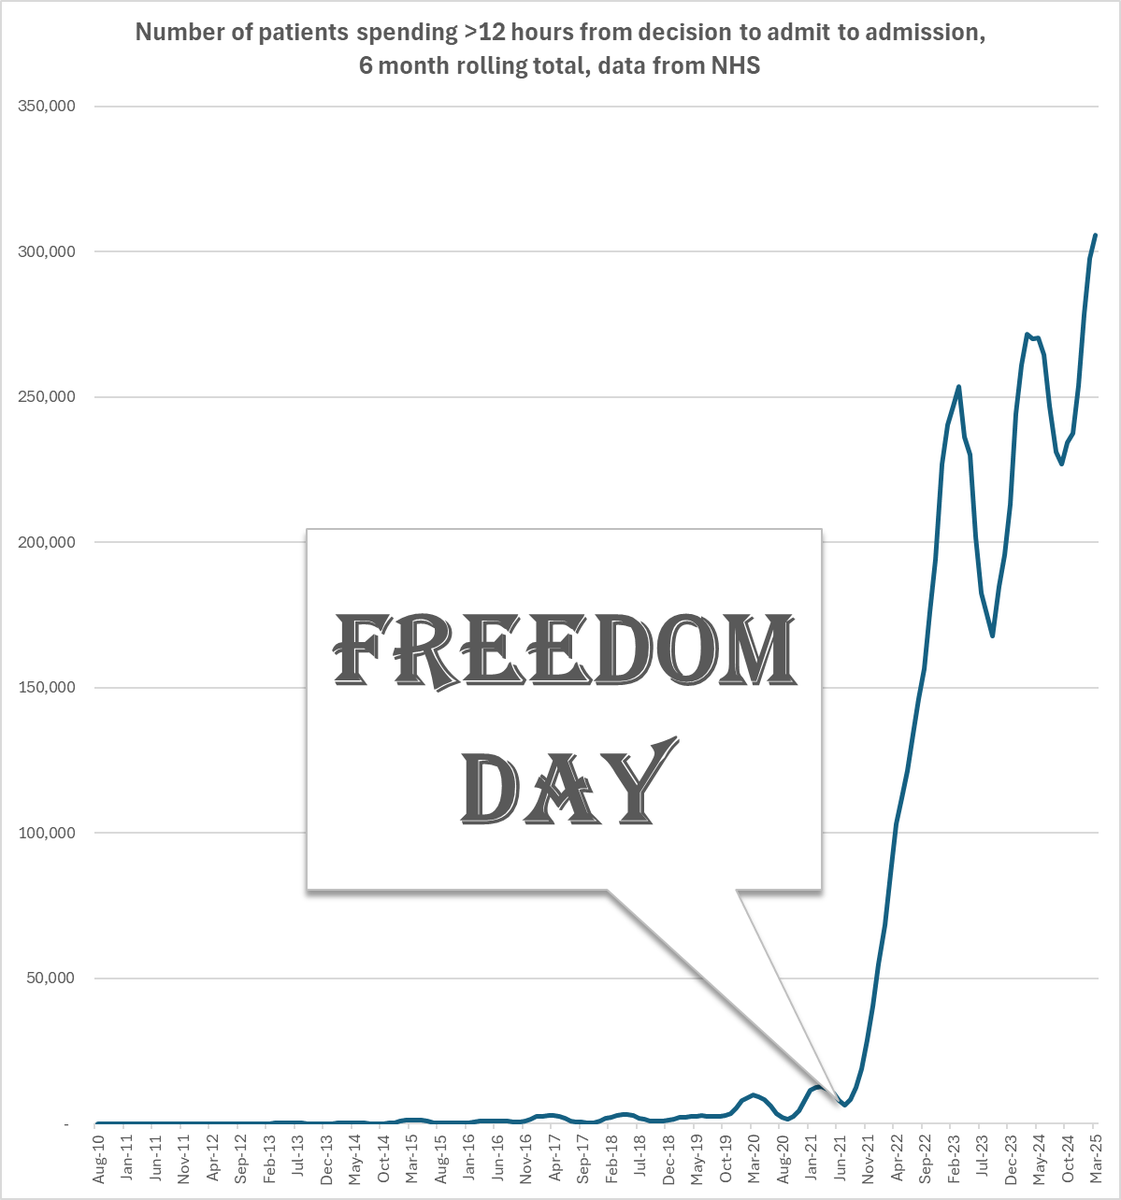
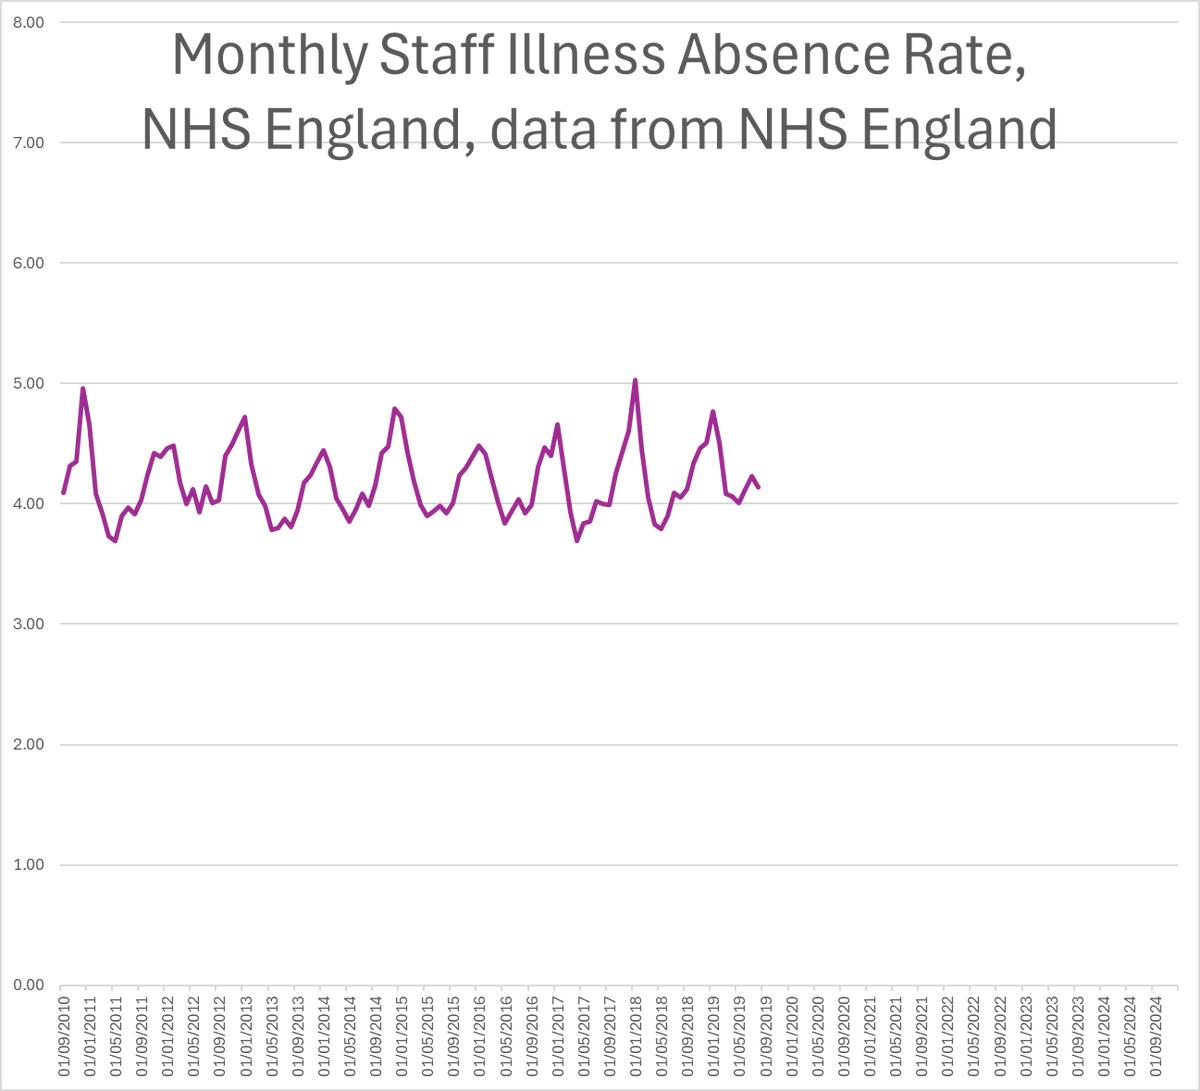
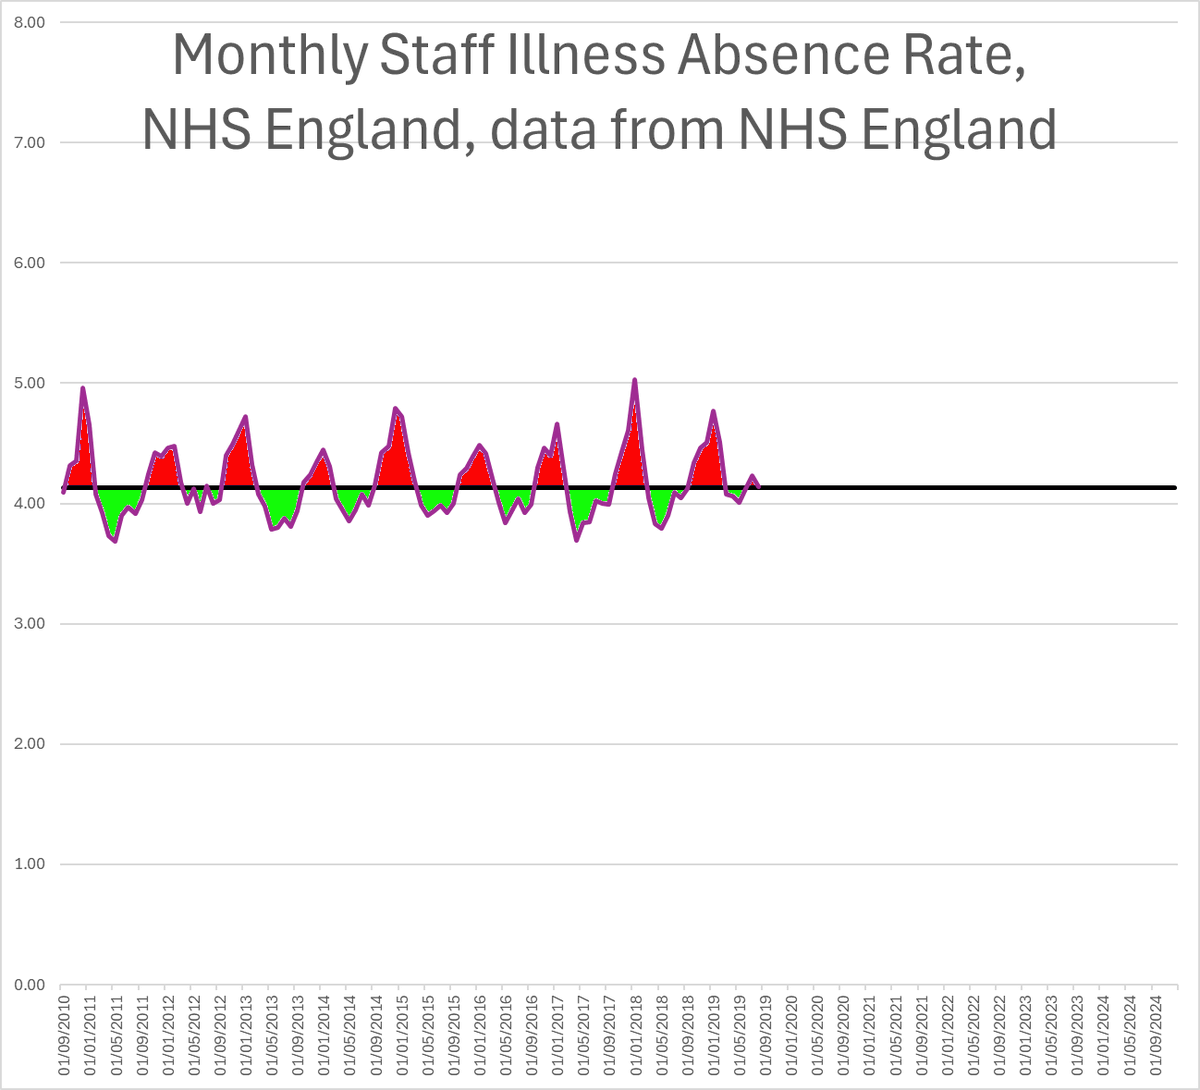
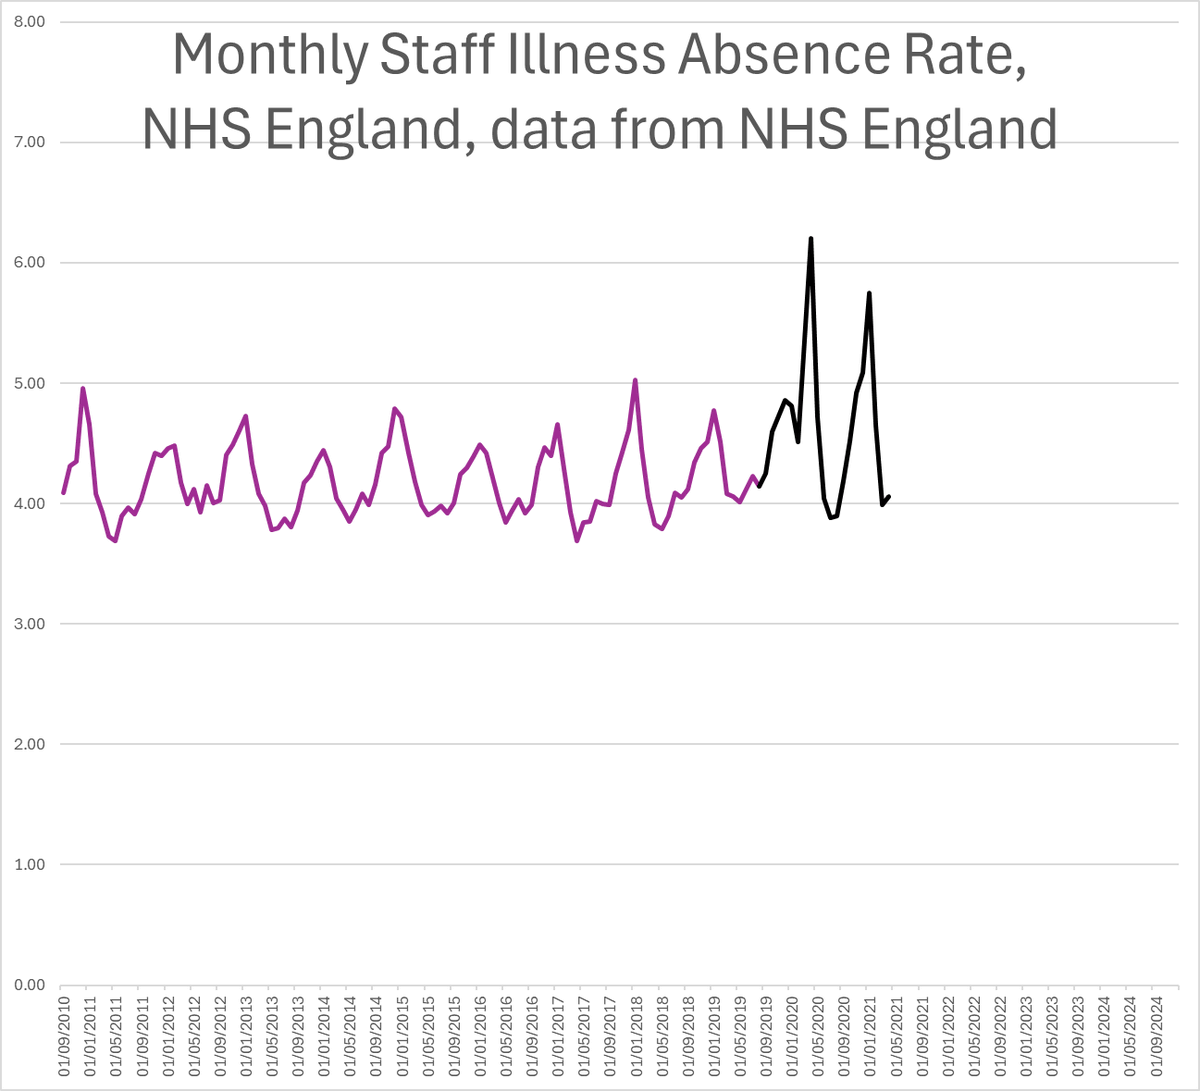
Put it up alongside the staff sickness rate at the NHS.
That black line is the pre-pandemic average, and the red and the green are the worse and better points in the year.
That black line is the pre-pandemic average, and the red and the green are the worse and better points in the year.
Not testing for Covid doesn't make it go away.
Letting it spread makes things worse.
I am so hugely spectacularly angry with the collective ignorance in this country.
You know, the NHS even has *excellent* guidance on how to reduce the spread of airborne infection.
It is *truly excellent*.
But for some reason your government wants you sick.
england.nhs.uk/long-read/appl…
It is *truly excellent*.
But for some reason your government wants you sick.
england.nhs.uk/long-read/appl…
Oh, and for those who want to know how much higher 2024/2025 was than the pre-pandemic average...
It's not double, or triple, or quadruple...
It's 360x.
360 times as many people had to wait 12 hours to get admitted after someone had made the decision to admit them into hospital.
Don't need urgent care, folks.
• • •
Missing some Tweet in this thread? You can try to
force a refresh