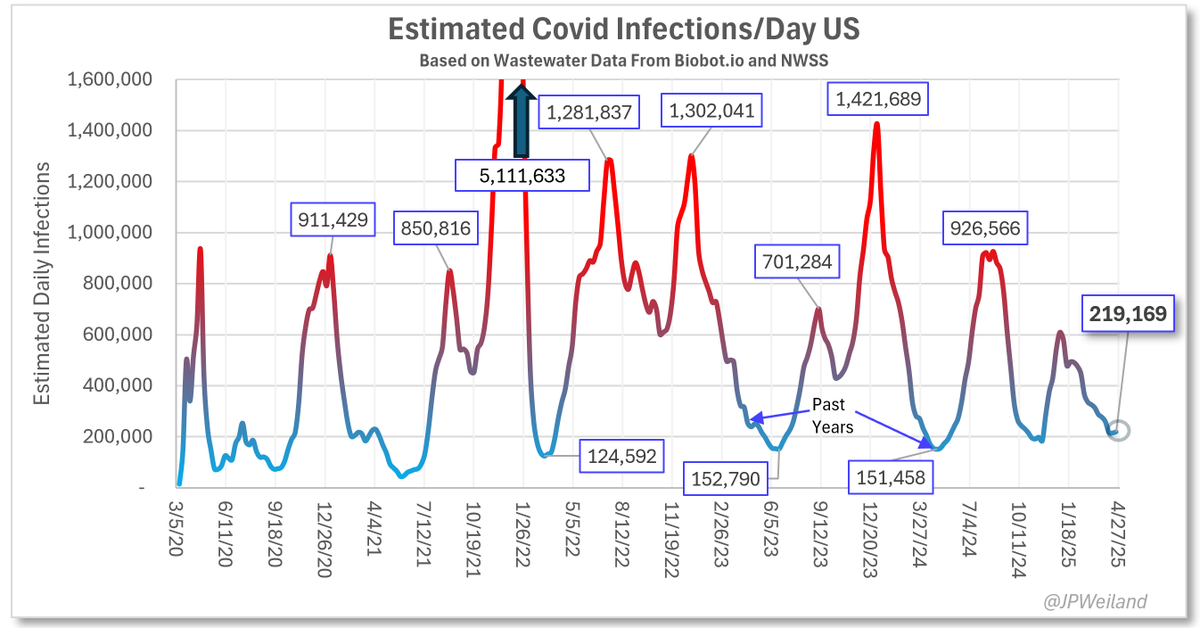
NWSS is showing some stagnation on the decline in the past couple of weeks. I expect the trend to stay roughly level (a bit up or a bit down) through May. We may not get to lows seen last year. Est:
🔸220,000 new infections/day
🔸~1 in 152 currently infected
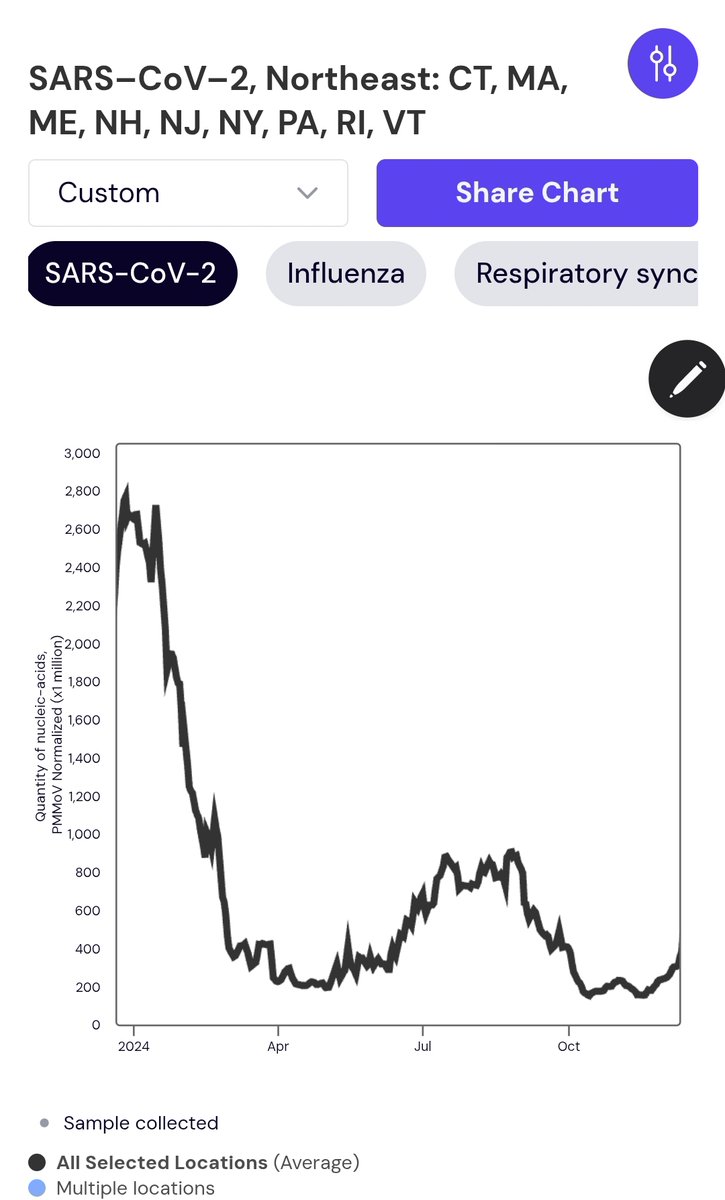
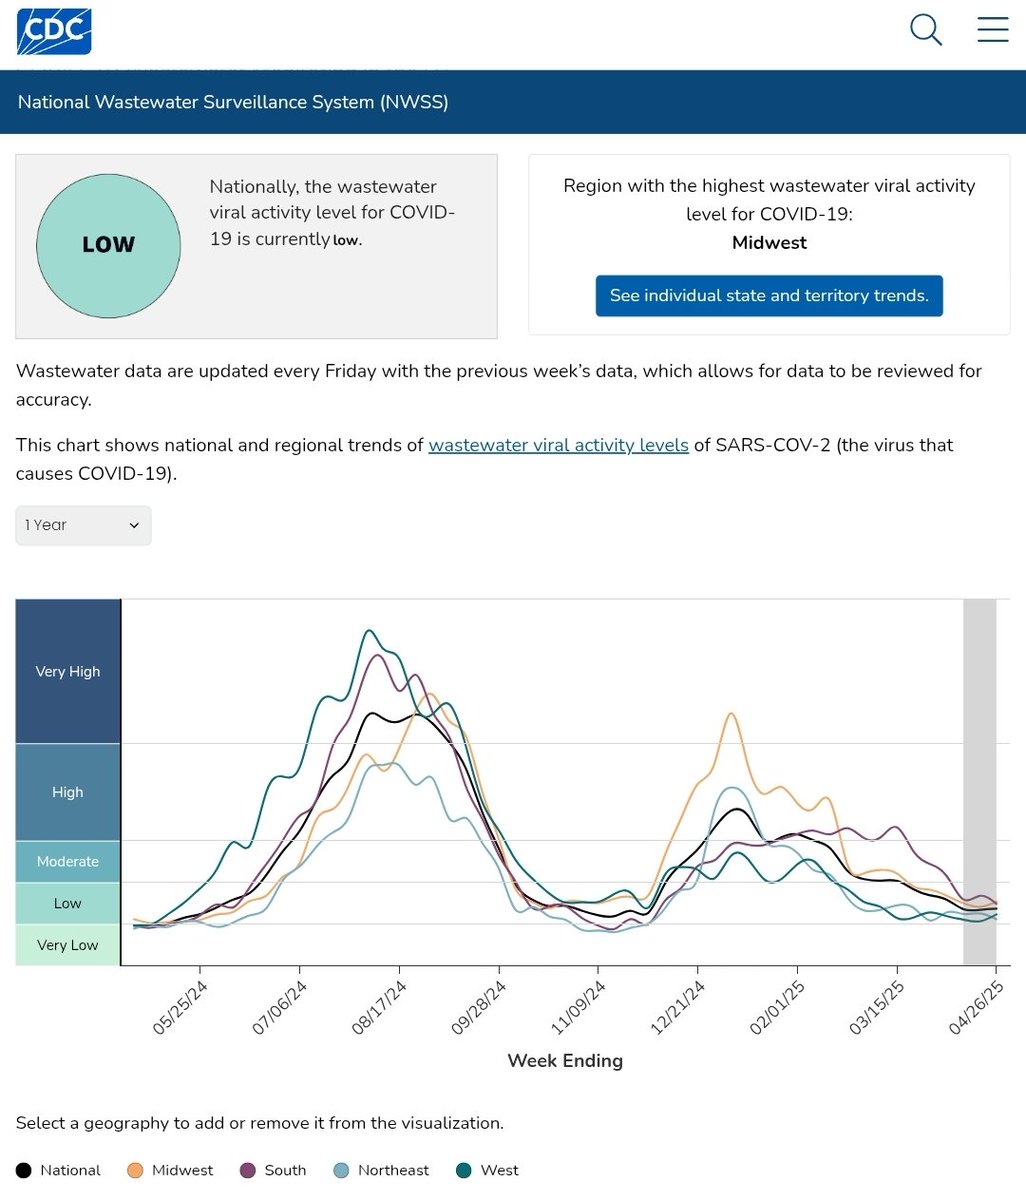
All 4 regions at roughly similar levels. A couple outliers on the east coast (New York, NJ for instance) that have remained slightly more elevated than the rest of the country.
Quoted tweet explaining the possibility of a higher low this spring.
I'm not sure if we'll get quite as low in transmission this spring as the minimums the last 2 years because of a very low winter peak not as efficiently cleaning up the susceptables. A bit of uncharted territory, since immunity is waning but we don't have strong variant growth.
Even without a strongly growing variant, I'm still confident we will have a decently sized summer wave. Parts of the south and west basically had no wave at all in the winter, thus the susceptibility is slowly increasing.
But the question is, how long will the decline hold on until we start the summer increase without a new fast variant? If the decline hangs on until late May or June, we may get below 2023/24's lows.
We witnessed a huge weekly growth advantage in new variants for the first year after Omicron arrived, and then to a lesser extent after Pirola. Now we have 9 months of the lowest growth advantages since 2020. 🧵
Both Alpha and Delta had only moderate divergence from their predecessors, but they increased transmission in a time with a mountain of people with no immunity to severe disease. Their waves of cases were moderate, but the waves of death and hospitalization were huge.
Omicron came in and wiped more than half of immunity to infection without heavily impacting resistances to severe disease. What it also did was open up a lot of new evolutionary potential for immune escape, and BA.2, BA.5, and XBBs demonstrate that impact well
▶️ An interesting saltation was found yesterday by variant trackers.. 3 samples of a highly divergent BA.3 in South Africa with 57 AA spike mutations. Samples were taken Nov-Jan, so it doesn't have a ton of speed (at least yet), but is worth watching. 1/
It currently lacks both 455 and 456 mutations that have been critical for immune escape in the last 16 months. If it is able to find those before its candle runs out, I think it has a chance to outcompete the current variants. 2/
I completely agree with this take from @LongDesertTrain - I was pessimistic about BA.2.87 due to the uphill battle against JN.1. The current relatively slow movement of variants could give this new BA.3 enough time to evolve mutations to jump start spread
How accurate are my infection estimates? The calibration is based on 2020-early2022 historical WW&case data, so we have no easy way to validate today's calibration in the US.
But we do have *measured* UK prevalence in December 2023 that arrives very close to my US estimates.
This is unfortunately about as good of validation as we can have since we don't measure prevalence directly in the US. UK and US are obviously not the same entity, but they do tend to spike together in December each year. Their data was not used to feed my calibration, so it..
..is reassuring that they arrived at very similar numbers on their actual prevalence measurements.
It would be great if the US did a similar measured prevalence study of their own, but we don't have anything like that at the moment.
The sequence from the 2nd severe H5N1 case in North America (Louisiana) has been released, and again, ⚠️has mutations that favor a2,6. Is it simply a coincidence that both severe cases have 2,6 favoring mutations? Or is this an indication of severity with 2,6?
I don't like this.
PSA (again): *Never* use the last 3 or 4 days of WWscan averages. They're always wrong, and I keep seeing this mistake being made. Half the time it's a straight line up or down. The midwest showed a vertical spike a couple days ago then it got reduced by 40% a day later.
@WastewaterSCAN is a fantastic resource, but it has an averaging issue in the latest few data points, as they dont have samples from all of their sites yet, so it's not comparing apples to apples. They should consider averaging to tmax-4 days in their algorithm.
By the way here is what the NE looks like with t-5 days