
A lot of people have noticed it. In the past few years, a bunch of different infections in England have started moving together.
Spikes, dips, rising and falling in sync.
Spikes, dips, rising and falling in sync.

And not just the trough of the covid mitigation days.
Look at that weird mini-plateau on the right for both Lyme and Legionella.
Look at that weird mini-plateau on the right for both Lyme and Legionella.

I mean that's so extremely precise, isn't it.
🫤
🫤
I had the data handy for a few infections going back over the last 15 years, so I thought I'd run a pearson correlation on each of the pairs.
That's a
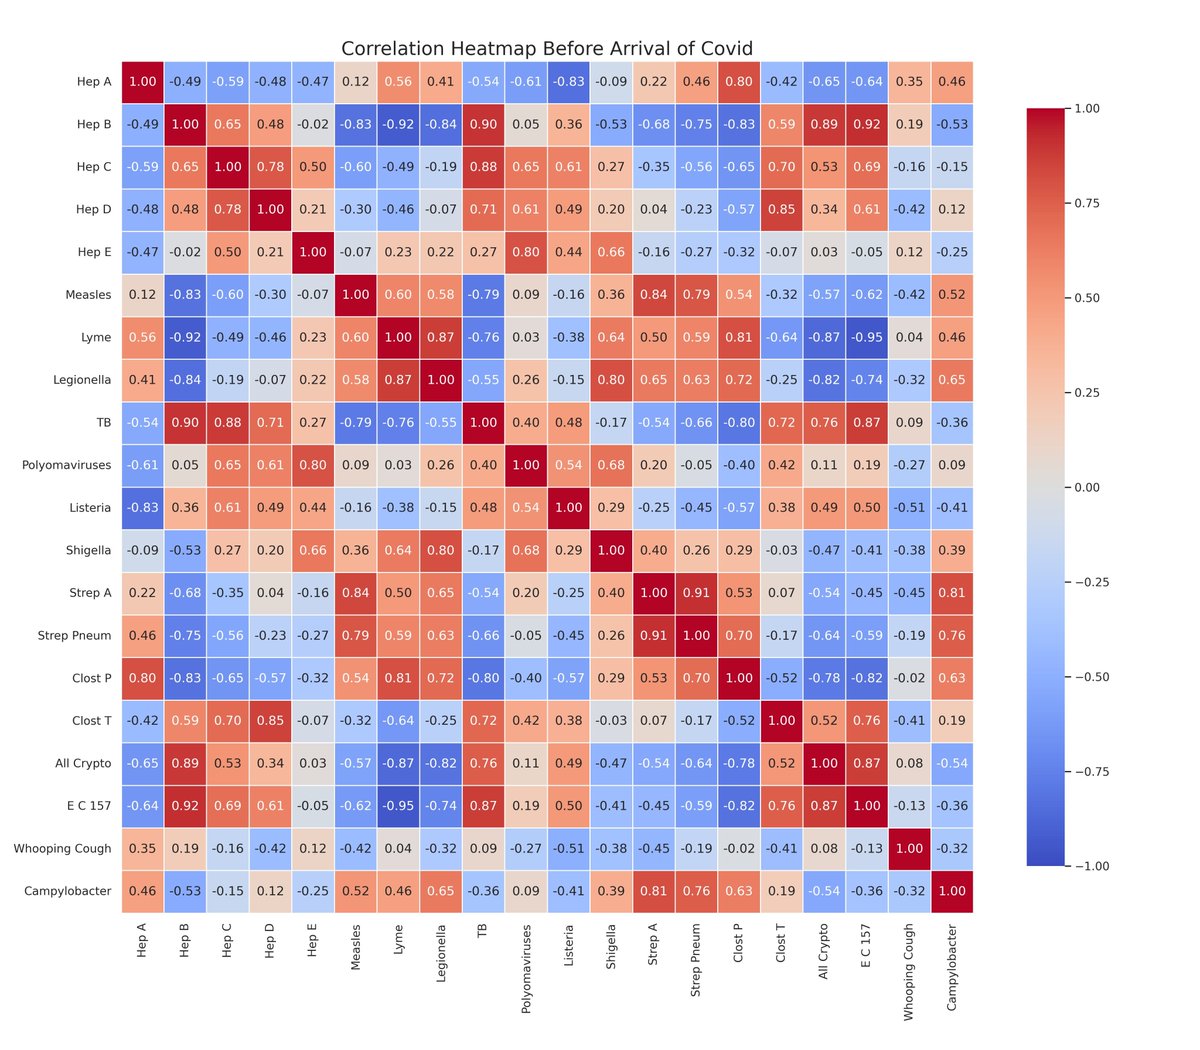
This is how much correlation there was among them *before* Covid arrived.
This is the correlation during the period 1/1/2016 to 1/3/2020.
What's this saying and how does it work...
This is the correlation during the period 1/1/2016 to 1/3/2020.
What's this saying and how does it work...

Scroll your finger down the left side to pick an infection... like Measles... and then scroll along to pick something to see whether it's spread correlates with that condition... like Hep E.
So before Covid arrived, their correlation was +0.07.
Which means there's no significant matching pattern.
It's coloured kind of light brown.
Which means there's no significant matching pattern.
It's coloured kind of light brown.
Blue means it's perfectly out of sync... and red means it's perfectly in sync.
The darker blue, the more precisely this is up when that is down and vice versa...
And the darker red, the more precisely this is up when that is up, and this is down when that is down.
So things are a bit all over the place before Covid...
Some things are completely out of sync.
And some are completely in sync.
And some things are not at all in sync.
Some things are completely out of sync.
And some are completely in sync.
And some things are not at all in sync.
And remember, these are *annual* rolling totals, so this isn't about time of year, it's about yearly trends.
How do things change when Covid arrives...
How interesting is this, eh.

Hep C and the two Clostridia stand right out.
Hep C has hardly any correlation with the rest of them.
The same goes for Clostridium Perfringens.
And Clostridium Tetani goes negative across the board.
Hep C has hardly any correlation with the rest of them.
The same goes for Clostridium Perfringens.
And Clostridium Tetani goes negative across the board.
But the rest... 👀
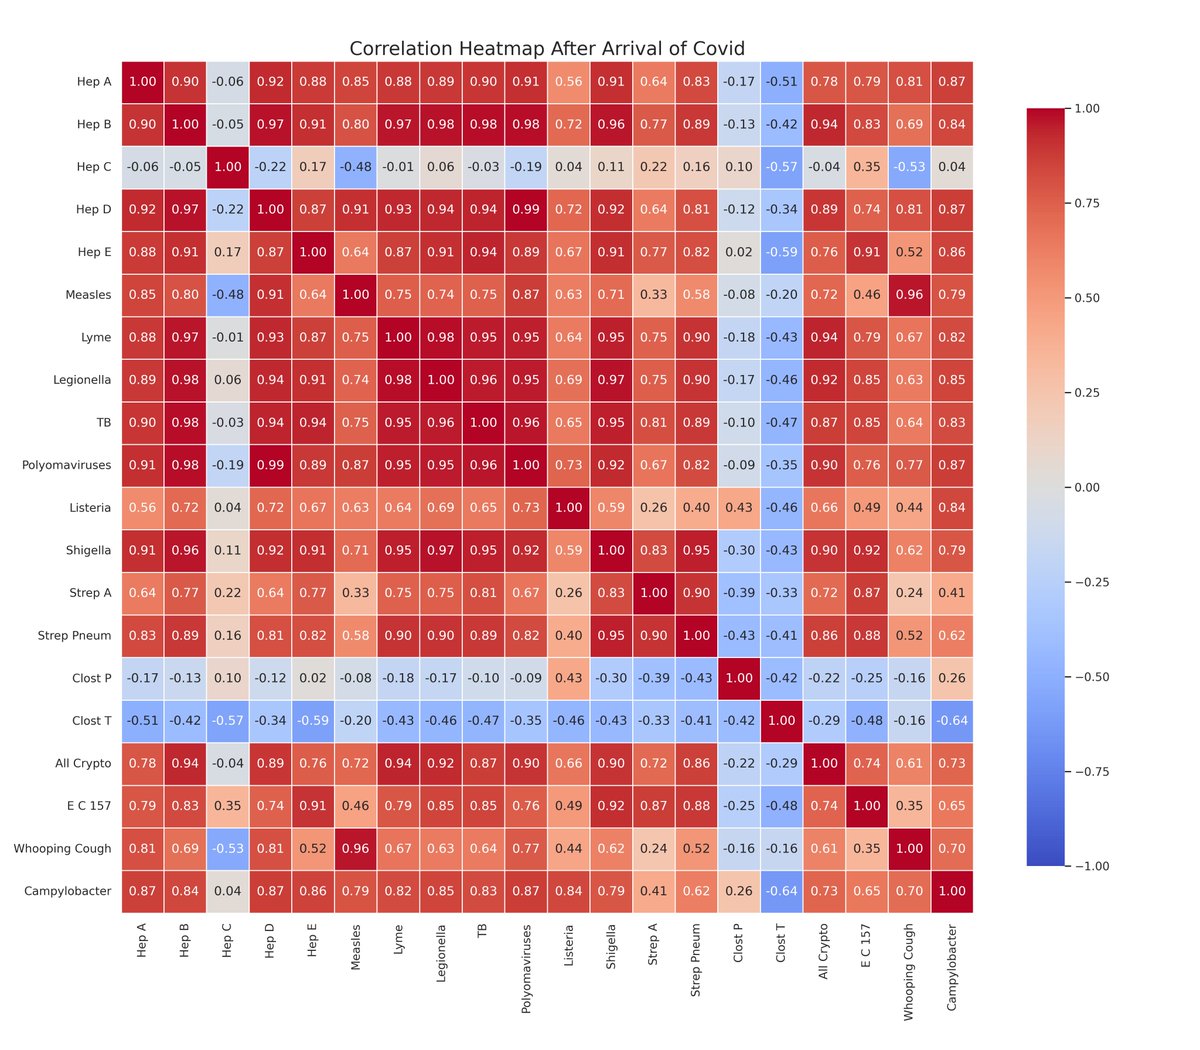
The correlation for the rest before Covid was, on average 0.038.
🫤
🫤
The pearson correlation after Covid arrived is 0.79
Hmm.
This was supposed to say "That's a way of putting a number value on how in or out of sync two sets of numbers are".
This was supposed to say "That's a way of putting a number value on how in or out of sync two sets of numbers are".
https://x.com/1goodtern/status/1918723941167710416
Now.
One of the incorrect theories for all of these coming into synchronisation is the old 'people weren't catching these during 2020 lockdowns'.
Which is, like I said, incorrect, because...
One of the incorrect theories for all of these coming into synchronisation is the old 'people weren't catching these during 2020 lockdowns'.
Which is, like I said, incorrect, because...
... some of these are things that people only ever have a problem with when their immune system is not working properly...
... and some of them are things that you *hardly ever encounter*...
... and some of them are things that you only have problems with when your gut is misbehaving...
and some of them are things that you only have problems with if your lungs are struggling...
... and suddenly, they've all synchronised.
(apart from Hep C, and those Clostridia)
BUT LOOK AT THE REST.
(apart from Hep C, and those Clostridia)
BUT LOOK AT THE REST.

Let's just work through the mechanisms...
Covid can damage the immune system's command centre, especially T cells, making it harder to recognise and clear new infections.
That gets exploited by respiratory viruses (RSV, flu, rhinovirus), Hepatitis B (reactivation or flare-ups), Polyomaviruses (which are normally controlled by strong T-cell responses). Possibly tuberculosis in some individuals.
Covid damages the thin linings that protect your lungs and intestines. These are frontline defences against pathogens.
That can be exploited by gut infections like E. coli O157, Shigella, Campylobacter, and lung ones like Legionella, Pseudomonas, Streptococcus pneumoniae.
Long-term immune activation after Covid can throw the whole system off balance, sometimes overreacting, sometimes underperforming.
Listeria and other intracellular bacteria can hide better during immune confusion, and auto-inflammatory flares may also obscure or worsen response to real pathogens.
Covid infection can wake up viruses that were hiding in the body, often kept in check by a healthy immune system.
Exploited by:
Polyomaviruses
Possibly hepatitis B
EBV (glandular fever/mono/Epstein Barr, Cytomegalovirus, HHV-6/7, VZV (shingles), maybe even rare cases of measles SSPE.
Polyomaviruses
Possibly hepatitis B
EBV (glandular fever/mono/Epstein Barr, Cytomegalovirus, HHV-6/7, VZV (shingles), maybe even rare cases of measles SSPE.
Covid infection and its aftermath alters your gut and airway microbiota, the good bugs that help crowd out harmful ones.
E. coli O157, Shigella, Listeria and gut infections in general may get a competitive edge.
Covid infection can inflame and damage the blood vessels, compromising organs and spreading infections more easily.
That can help *so many* other infections.
Covid reduces 'secretory IgA', your local antibody defence on mucosal surfaces like the nose, throat, lungs, and gut.
Again, Covid opens the door, and...

And I'm barely even started.
Covid makes you more vulnerable to *many* bacterial infections.
Covid makes you more vulnerable to some fungal infections.
Covid makes you more vulnerable to many viral infections.
Covid infections damage you, and since your defence against infection is *you*, then you're more vulnerable to almost everything that wants to get you.
All those UTIs.
All those gut infections.
All those chest infections.
All those gut infections.
All those chest infections.
All those bugs.
Speaking of which, I'm off to make myself a sandwich.
Here are some of them with Scottish Covid Wastewater on the graph, @fitterhappierAJ
https://x.com/fitterhappierAJ/status/1918728545427181687


@fitterhappierAJ Those are rolling annual totals - I'll come back and do the weekly data tomorrow.
For those who think this is to do with vaccine uptake, here's vaccine coverage in England for these pathogens:
Hepatitis A, not routinely given (selectively offered to high-risk groups)
Hepatitis C, no vaccine
Hepatitis D, no direct vaccine (protection via Hep B vaccine)
Hepatitis E, vaccine exists (licensed in China), not available in UK
Polyomaviruses, no vaccine
Lyme disease, no vaccine
Legionella, no vaccine
Listeria, no vaccine
Shigella, no vaccine
Strep A, no vaccine
Clostridioides difficile (Clost P & Clost T), no vaccine
Cryptosporidium, no vaccine
E. coli O157, no vaccine
Campylobacter, no vaccine
Hepatitis B, 94.6% (at 12 months, 2024)
Measles (MMR1), 89.2% (at age 2, 2024)
TB (BCG vaccine), 78.4% (at 3 months, among eligible infants, 2024)
Streptococcus pneumoniae (PPV vaccine), 73.1% (adults aged 65+, 2023–24)
Whooping Cough (pertussis), 90% (at age 2, 2024)
For those who think this is all skewed by the lockdowns, here's the same heatmap for the time period after all non-pharmaceutical interventions were ended:

• • •
Missing some Tweet in this thread? You can try to
force a refresh


