I had an English NHS doctor replying to one of my tweets the other day saying "no one's more sick now, stop these lies".
Except... there's a problem there because the NHS publishes data about how many doctors are off sick each month...
Except... there's a problem there because the NHS publishes data about how many doctors are off sick each month...

And this is what it looks like in graph form.
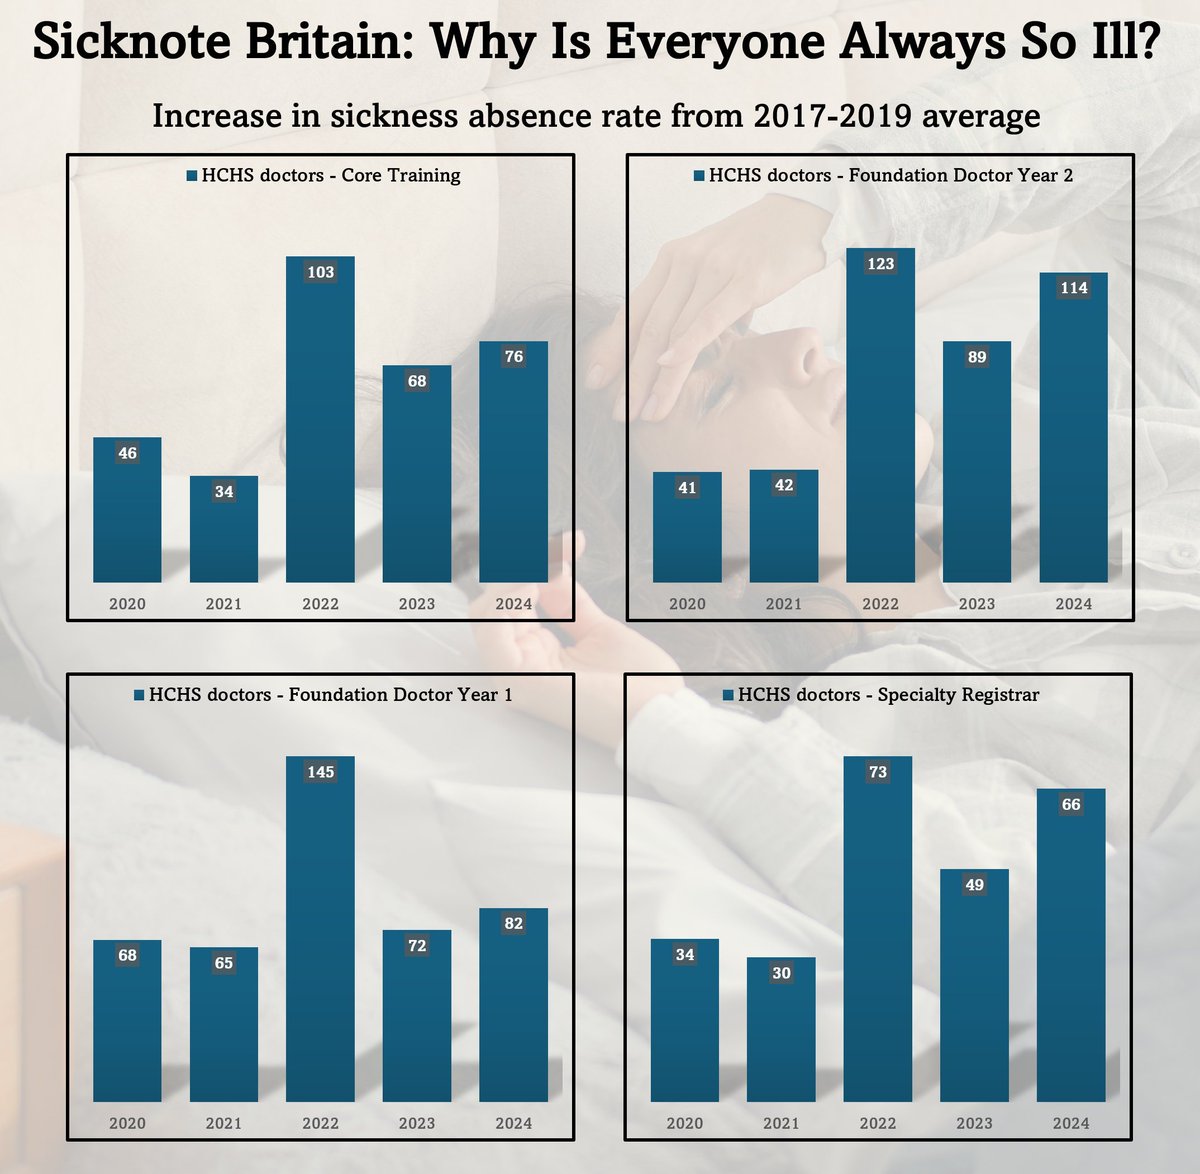
This is *how much more likely* doctors in Hospitals and Community Health Services (HCHS) are to be sick in each of the last five years than in the three years leading up to the pandemic.
This is *how much more likely* doctors in Hospitals and Community Health Services (HCHS) are to be sick in each of the last five years than in the three years leading up to the pandemic.

I mean the data is published *every single month* for anyone interested to go and look at it.
digital.nhs.uk/data-and-infor…
digital.nhs.uk/data-and-infor…
The data is easily available with a breakdown for the different staff groups going back to 2017.
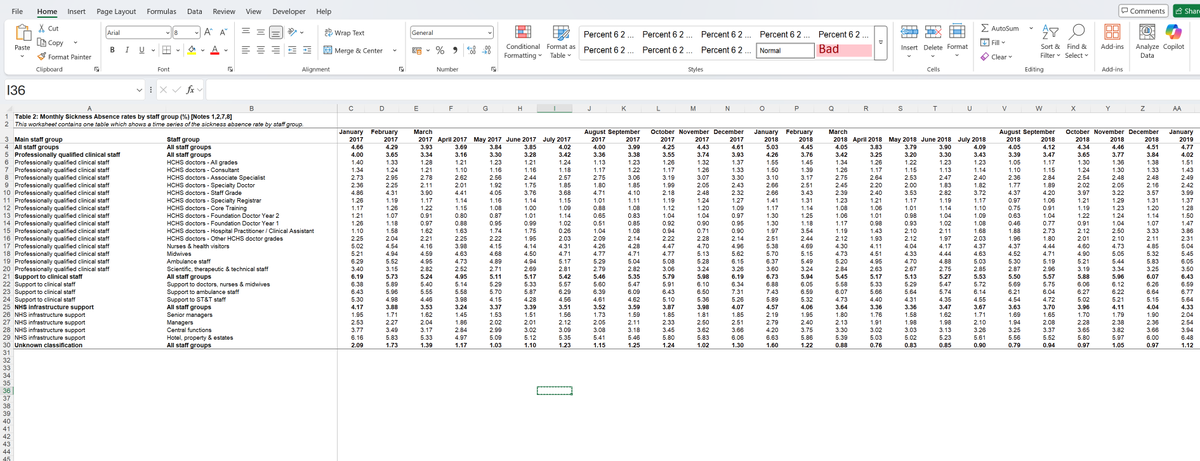
But there's also an overall absence for all the staff groups combined going back to 2009.

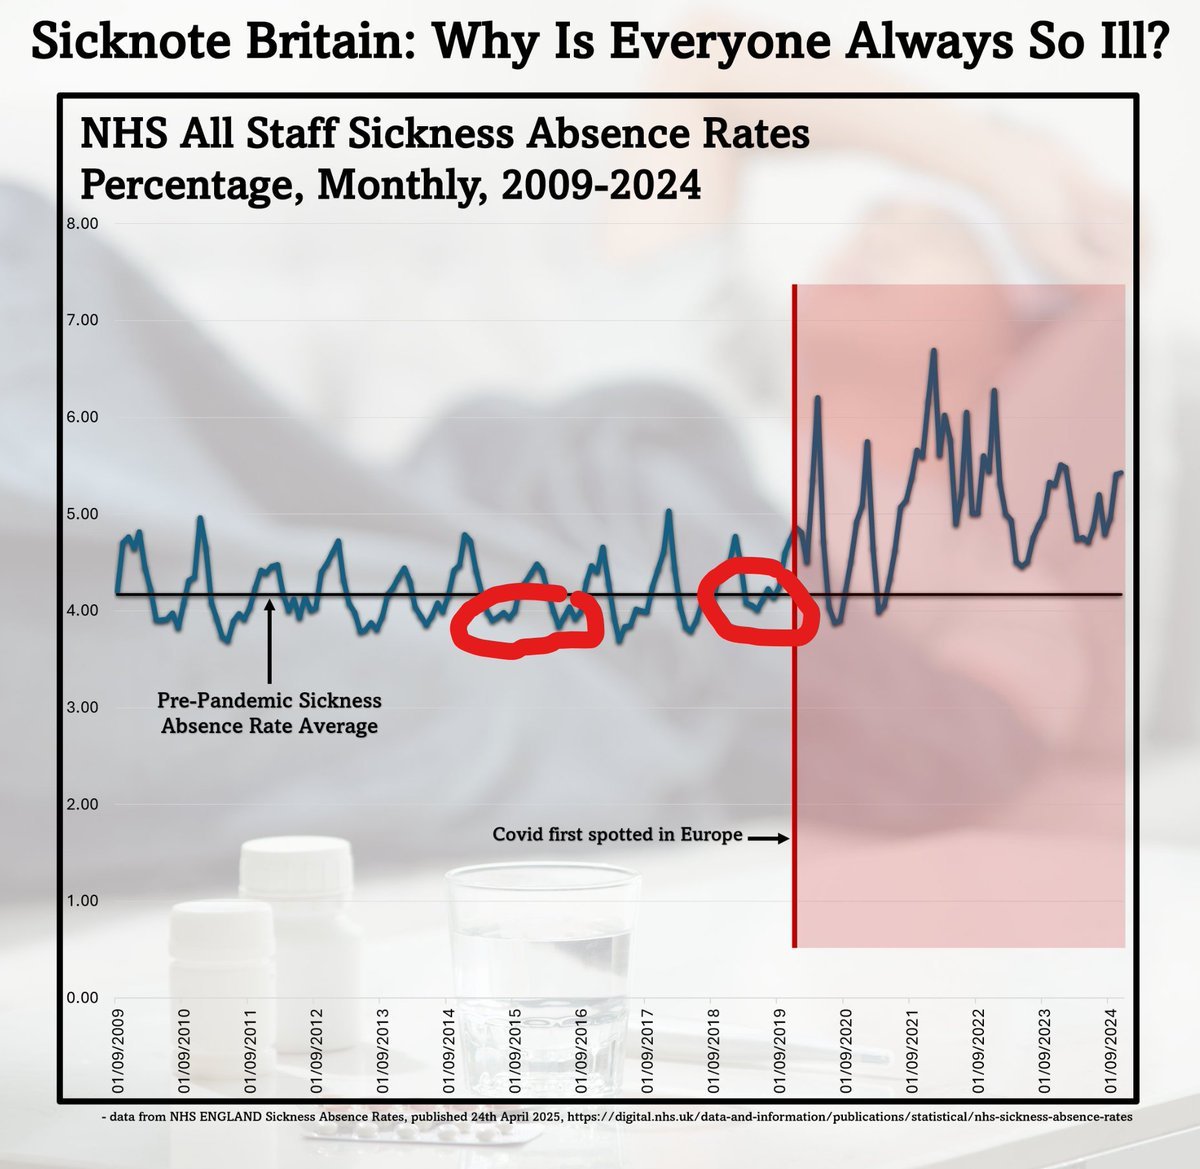
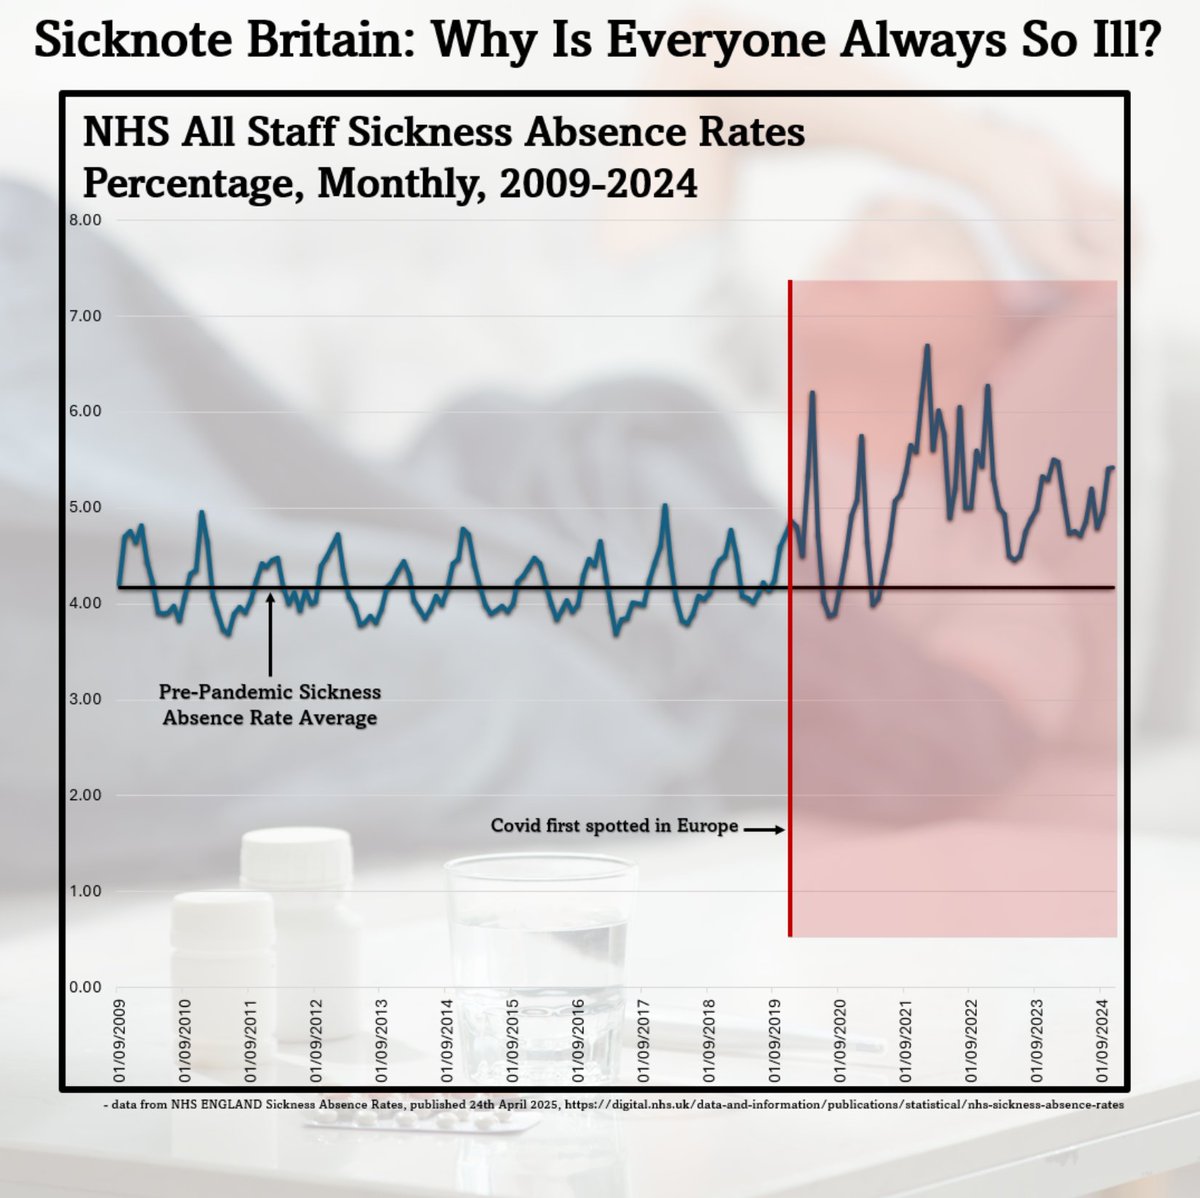
This is a chart of all staff sickness absence rates in the NHS from 2009 to 2019, and some tulips.
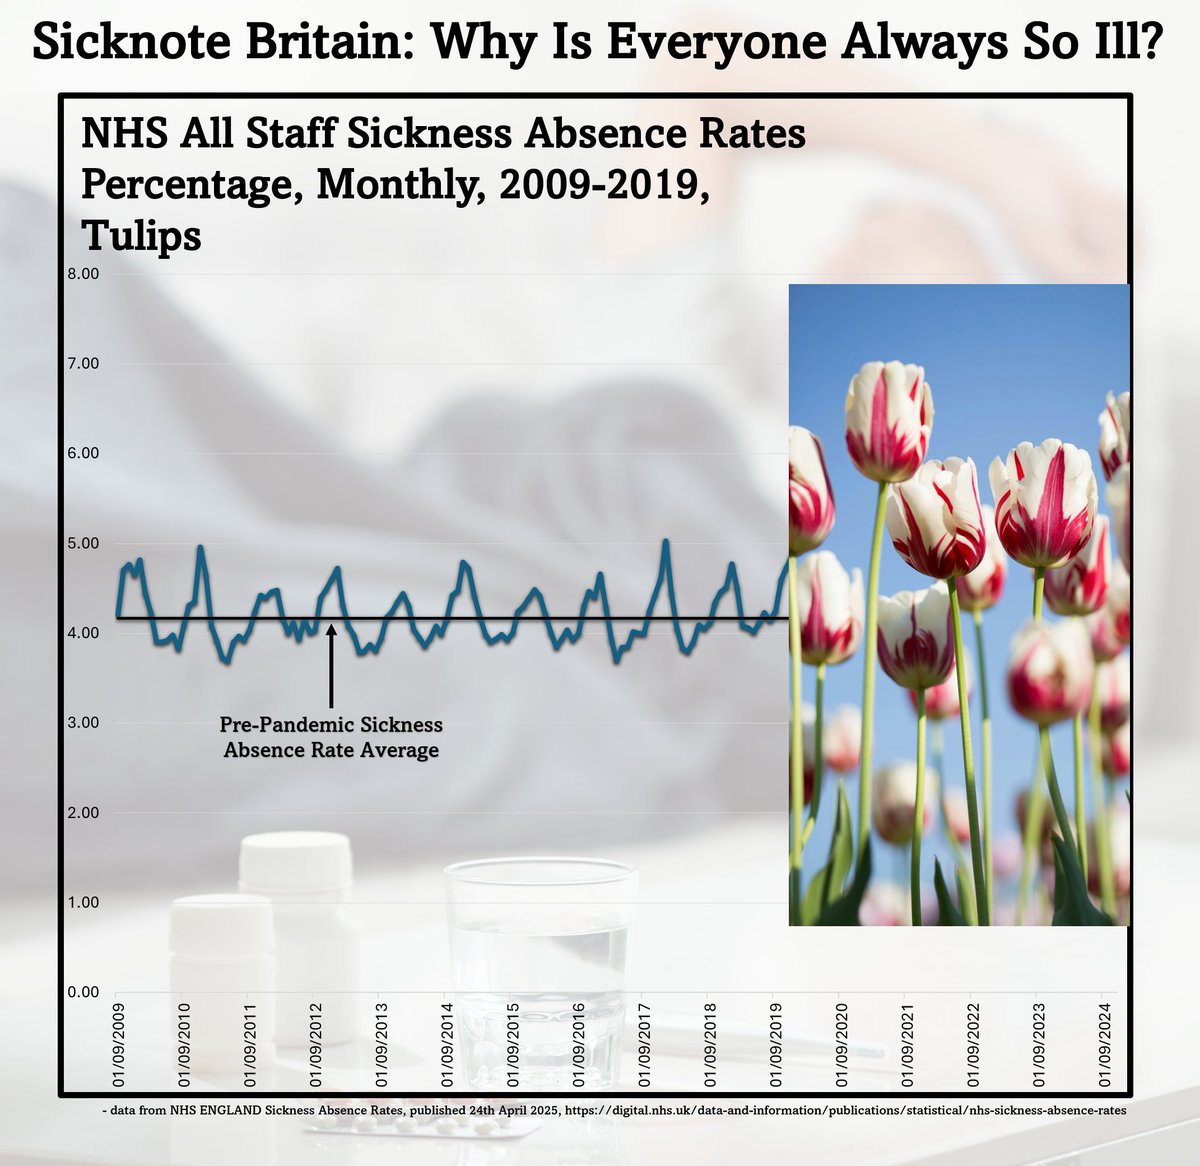
The tulips cover up the arrival of Covid, because who wants to hear about Covid, right?
The little black line there shows the average over that period.
But you can see how little variation there is over the time period.
Things are worse for a short part of the year in the winter, and better for a larger part of the year in spring, summer, and autumn.
Things are worse for a short part of the year in the winter, and better for a larger part of the year in spring, summer, and autumn.
You can imagine what happens when Covid arrives, can't you.
Yep.

Look.
I'm not sure, but when someone says "no one's more sick now, stop these lies", does that include NHS Staff?
I'm not sure, but when someone says "no one's more sick now, stop these lies", does that include NHS Staff?
This is some of the different groups.
All HCHS Doctors.
All NHS staff groups.
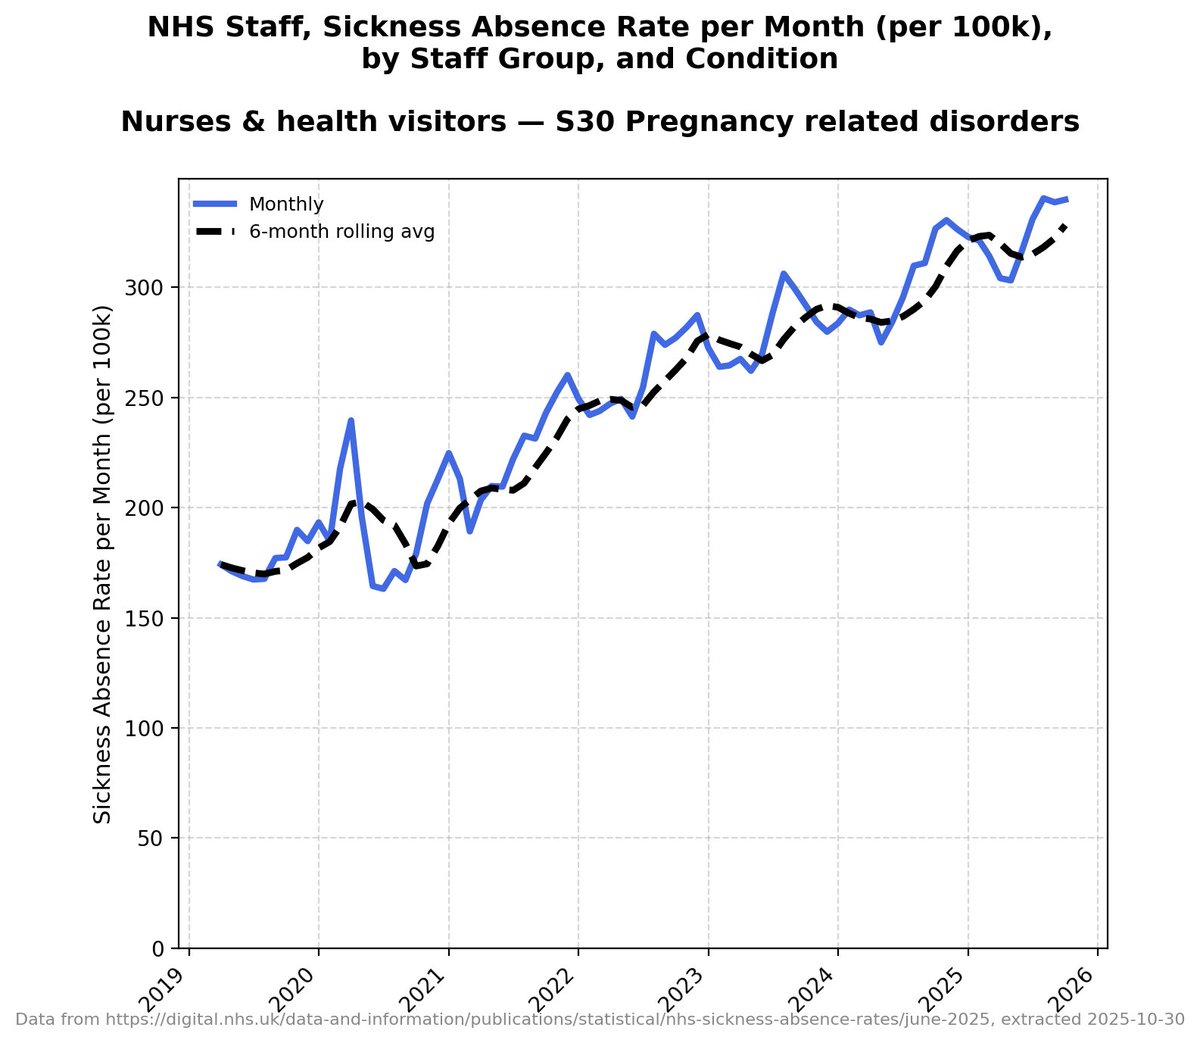
All Nurses and Health Visitors.
All Scientific, Therapeutic and Technical Staff.
All HCHS Doctors.
All NHS staff groups.
All Nurses and Health Visitors.
All Scientific, Therapeutic and Technical Staff.
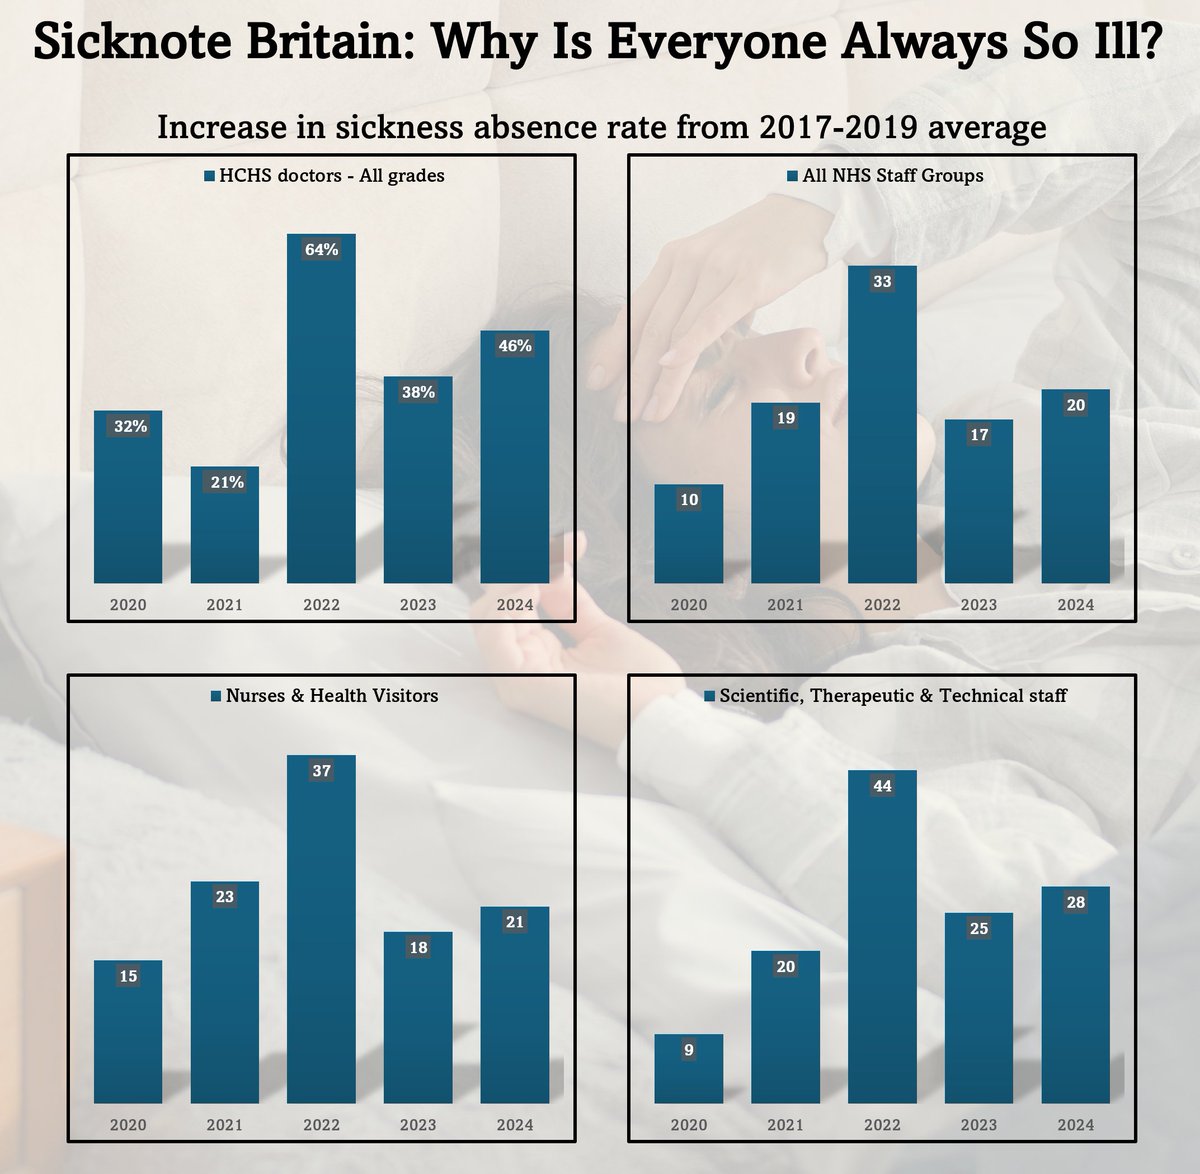
That last one is physiotherapists, radiographers, occupational therapists, biomedical scientists, speech and language therapists, pharmacists, clinical psychologists, that kind of thing.
I know so many of these people, and I love them so much, and they're currently 28% more likely to be *off sick* than five years ago.
We're going to come back to the doctors in a minute, because that's a really interesting one, but this isn't just the staff on the wet end of medicine.
The same kind of patterns apply to support staff for the different groups, and even the hotel and property staff.
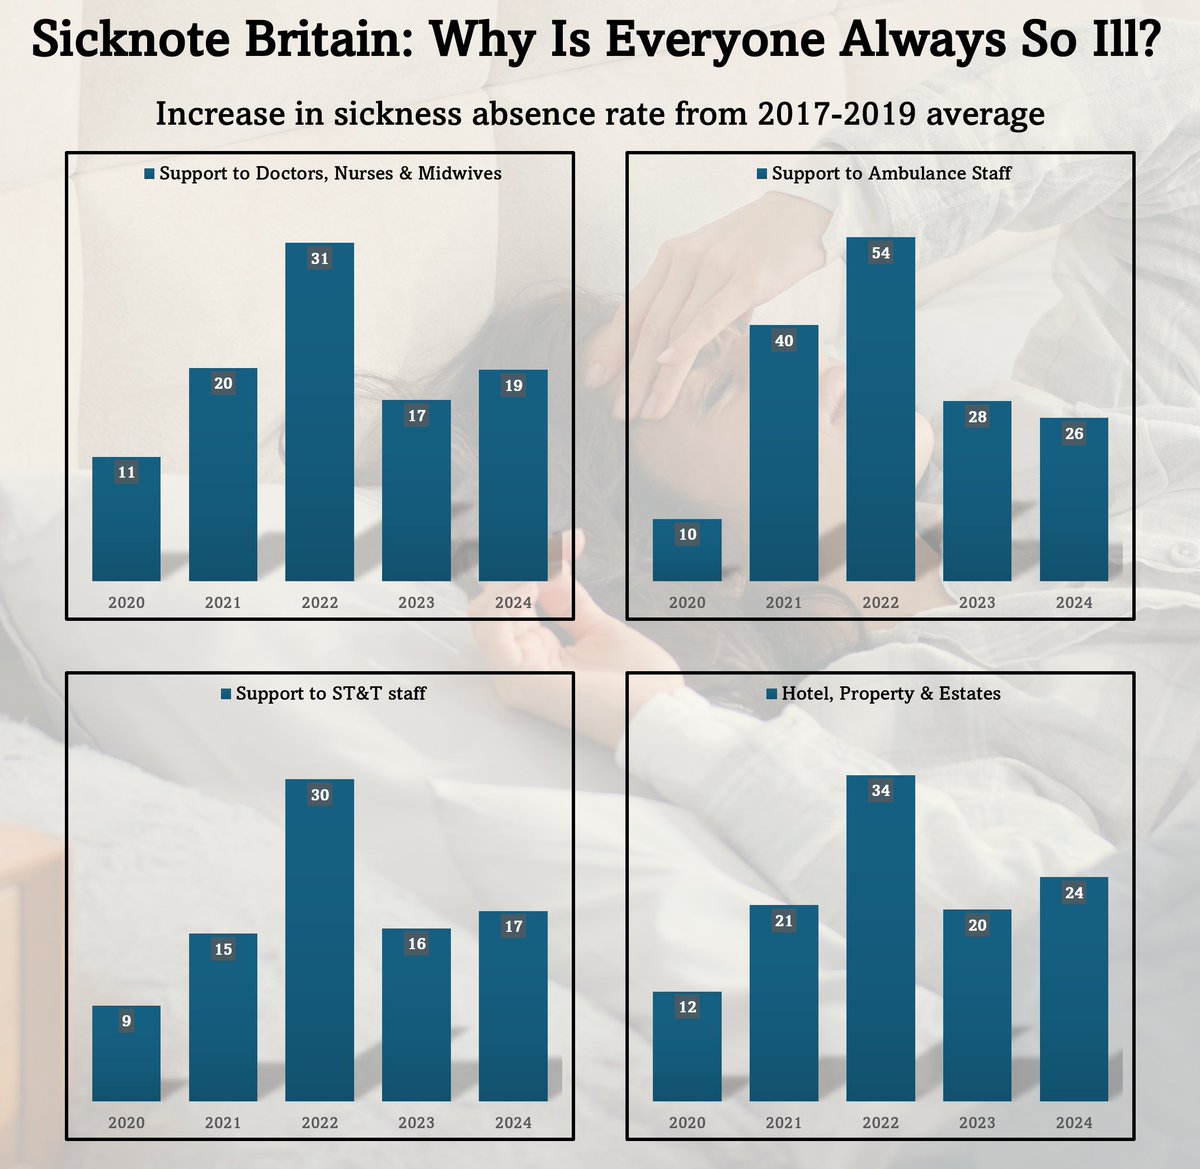
So this is pretty much universal.
I don't know of any other publicly available database like this anywhere in the world, to be honest, that contains this much information about such a large group of people.
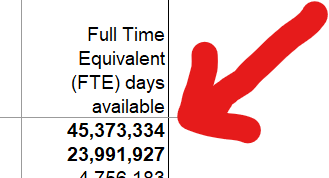
The data each month covers about forty five million possible days of work.
That's about 1 in 14 of *all* the hours worked in England.
That's about 1 in 14 of *all* the hours worked in England.
So this *huge* pool of people is probably roughly equivalent to the *working age* population in general.
It doesn't equate to kids, school, or students.
And it doesn't equate to retirement age.
And it doesn't equate to retirement age.
So I can't vouch for all age groups in reply to "no one's more sick now, stop these lies".
But I can tell you this:
NHS staff are *off sick* more.
It's a literal fact.
But I can tell you this:
NHS staff are *off sick* more.
It's a literal fact.
And I think that since we're talking about *more than a million staff*, who work *all across the country*, in *every single community*, then it's a pretty safe to say that they're a fair representative for all working age people here.
But let's pop back to those doctors.
Why?
Because different types of doctors are *different ages*.
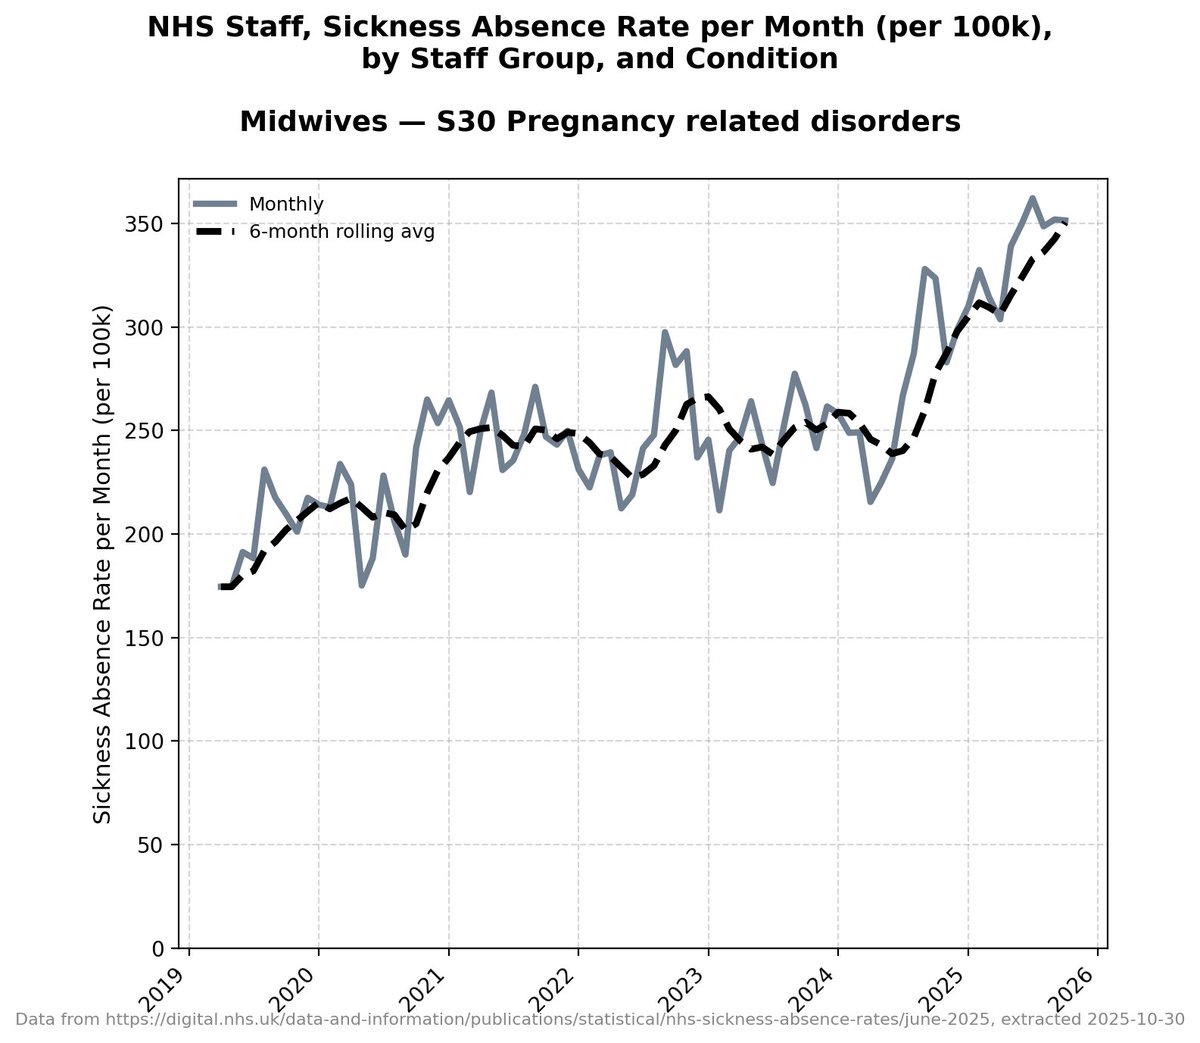
The data for 'midwives' covers everyone from twenty something to sixty something.
Doctors though...
This is a *very rough* possible way of classifying the *very rough* age groups of most of these staff types.
This is a *very rough* possible way of classifying the *very rough* age groups of most of these staff types.

So we can actually take a different peak at the different staff types and get a glimpse into how the health of people of different ages are getting affected.
Here are some of the groups.
😕
😕
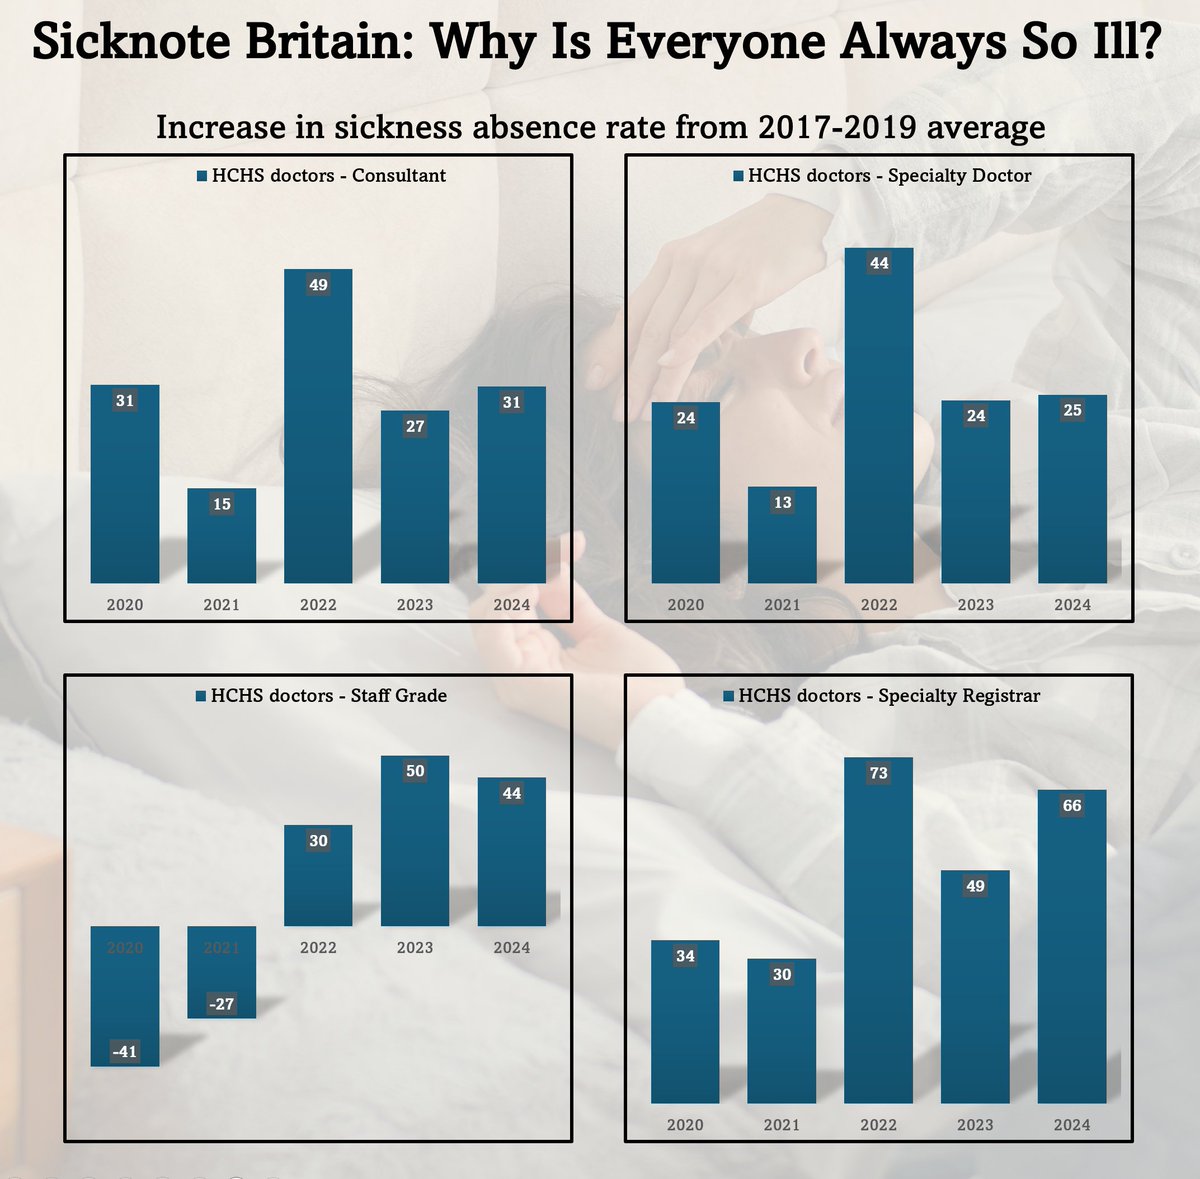
The staff grade ones are interesting there, but they're a kind of old classification of doctor that is being phased out, so I don't know how exactly that fits into the bigger picture.
But look at Specialty Registrars.
You might think it's astonishing that they were 66% more likely to be off sick than in 2017-2019...
You might think it's astonishing that they were 66% more likely to be off sick than in 2017-2019...
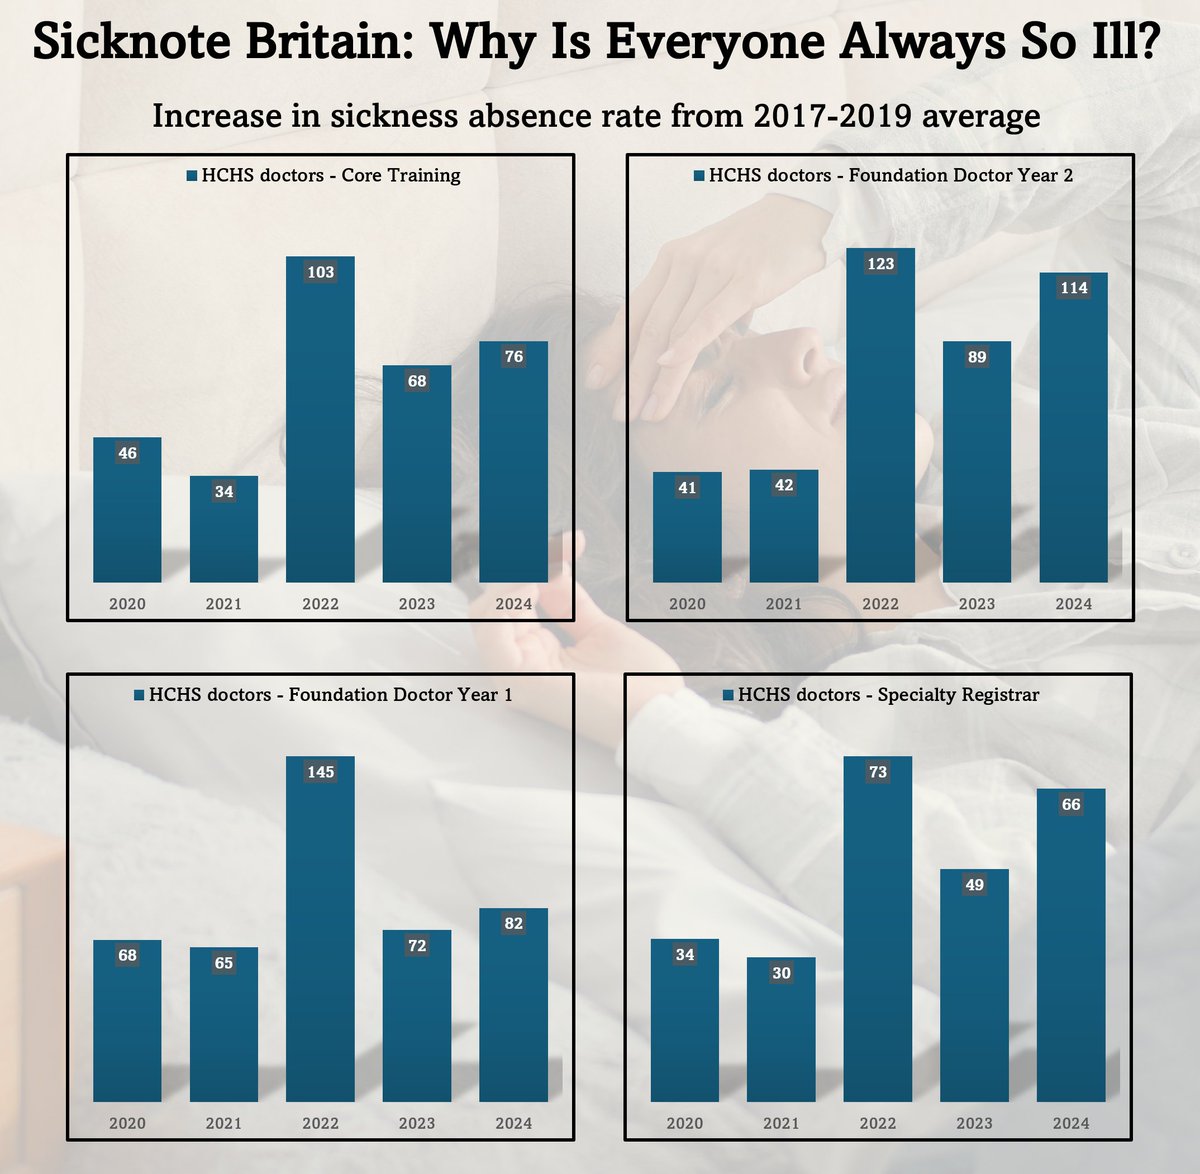
... but then if we used up the word 'astonishing', then you might not have anything left to use for the rise in sickness absence among the *younger* doctors...
😬
😬
Actually... I'll leave those specialty registrars in there... because they're not ancient like old dinosaurs like me:
These are doctors in their mid twenties to early thirties, mostly.
Foundation Doctor Year 2s, who are generally mid twenties, were OFF SICK MORE THAN TWICE AS MUCH IN 2024 AS IN 2017-2019.
Foundation Doctor Year 2s, who are generally mid twenties, were OFF SICK MORE THAN TWICE AS MUCH IN 2024 AS IN 2017-2019.
Maybe astonishing is too mild a word for that.
"no one's more sick now, stop these lies"
Apart from F1s.
And F2s.
And Specialty Registrars.
And Doctors in Core Training.
And Midwives.
And Hotel Staff.
And Occupational Therapists.
And Senior Managers.
And Porters.
And EVERYONE.
Apart from F1s.
And F2s.
And Specialty Registrars.
And Doctors in Core Training.
And Midwives.
And Hotel Staff.
And Occupational Therapists.
And Senior Managers.
And Porters.
And EVERYONE.
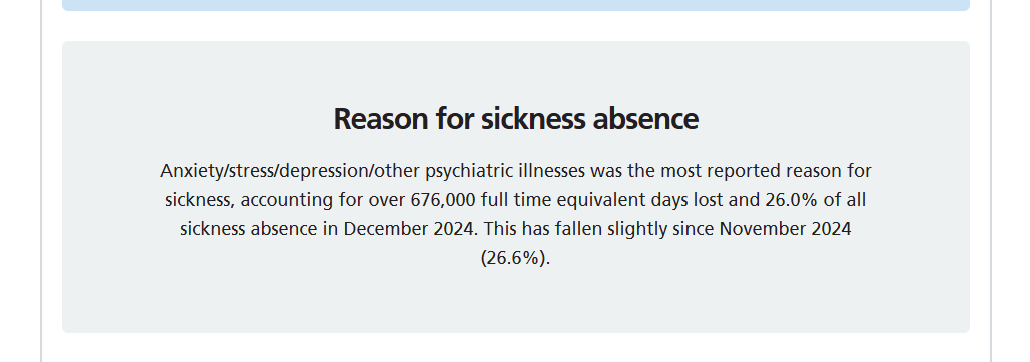
Now *every* month the NHS sickness absence report is minimised by the use of this banner:
This keeps on getting wheeled out in newspaper articles, again and again.

They blame the sickness on the emotional pressure of being a healthcare worker in the current age.
Oh.
I've just been called off to do a hospital visit urgently.
When I'm back, I'll explore the next stage, which is *the breakdown of what NHS staff are off sick with*.
I've just been called off to do a hospital visit urgently.
When I'm back, I'll explore the next stage, which is *the breakdown of what NHS staff are off sick with*.
@moniconga I was actually tempted to leave 2019 off the average and use 2016-2018, because the trough in the 2019 summer is higher than all the rest so it may not actually be representative of the other years and it skews the average upwards, but I left it in.

Well.
That wasn't great.
More graphs to follow, and some of those yet to come are *concerning*.
That wasn't great.
More graphs to follow, and some of those yet to come are *concerning*.
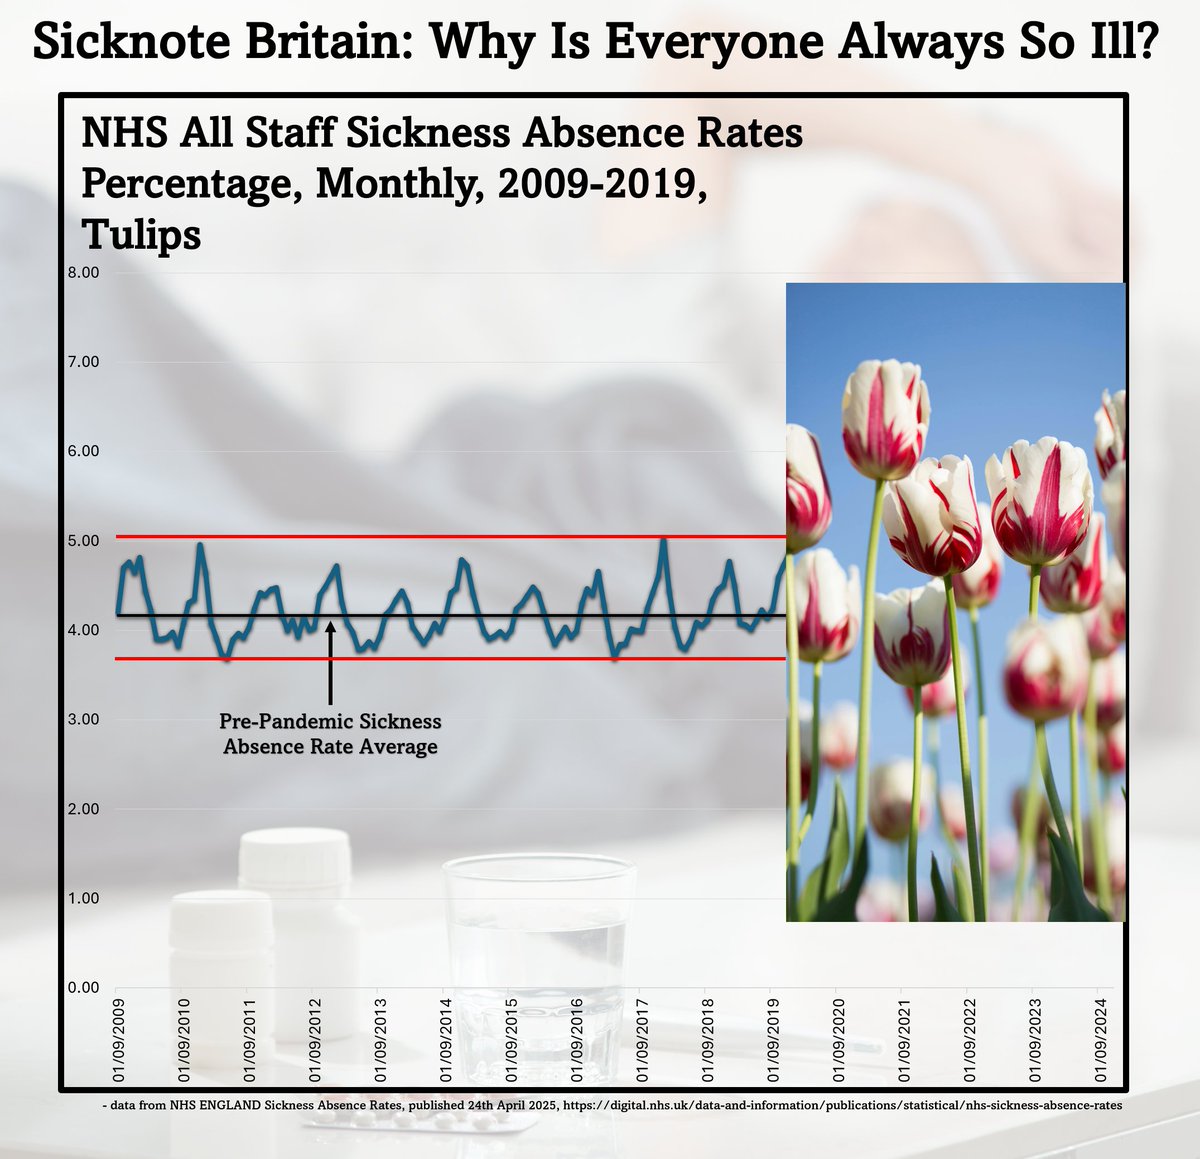
But before we go any further, someone asked me about the 2017-2019 average... Interestingly, it's actually higher than the 2009-2019 average.
The trough in summer 2019 does not go so low as previous.
The trough in summer 2019 does not go so low as previous.
So these would actually be higher if you compare them with 2009-2018... but I stuck with the three years that directly preceded the known spread of Covid.

And also while we're here, I often forget that people don't actually know what they're looking at when they see this:
I mean, yeah, Covid arrives and things go crazy, but some people blame that whole pink area on lockdowns or vaccines or dust or overcrowding or economics or something else.
Each of these are Covid waves.

We don't have good data for actual covid case numbers here in England.
The UKHSA have deliberately jumped the testing and recording and reporting policies every few months to prevent there being a clear record.
The UKHSA have deliberately jumped the testing and recording and reporting policies every few months to prevent there being a clear record.
But next door in Scotland, they've got a full record of *covid wastewater levels*.
How much Covid there is in the sewers.
More covid in the sewers = more covid in people's arteries.
Equals more covid infections.
Do I have to spell this out?
Do I have to spell this out?
So the Covid waves in Scotland were ever so slightly out of sync with the Covid waves in England.
Some were bigger, some were smaller, some were a tiny bit later, some were a tiny bit earlier...
But you don't need to be an eagle to spot that these line up.
Some were bigger, some were smaller, some were a tiny bit later, some were a tiny bit earlier...
But you don't need to be an eagle to spot that these line up.
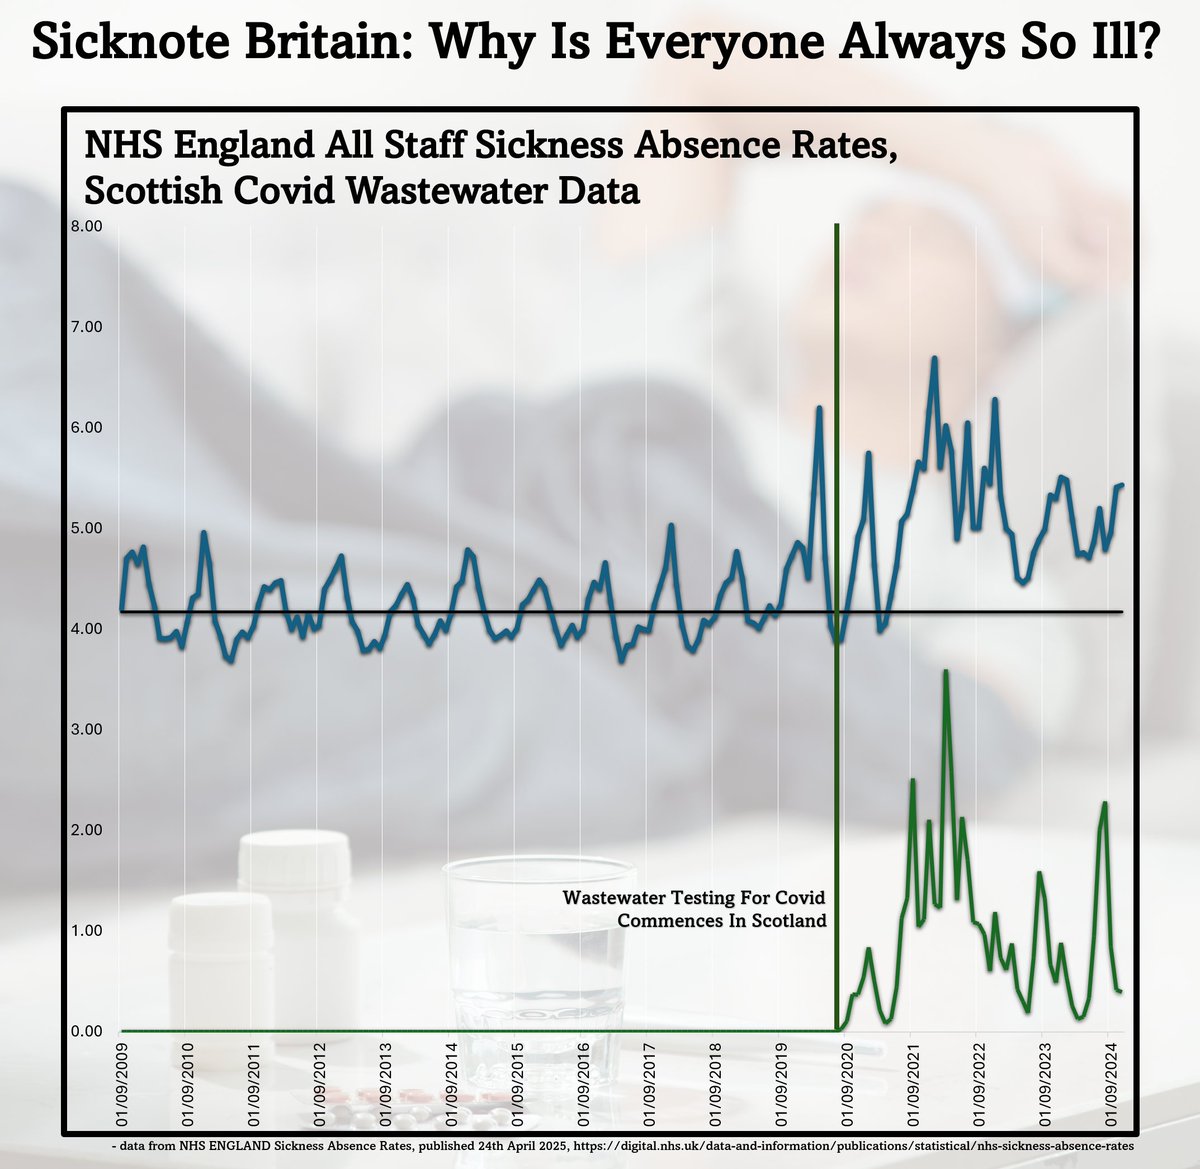
The more covid infections there were, the more NHS staff were off sick.

And I have no idea why I'm using the past tense.
Because you can see that right up to the end of this data... the more covid infections there are, the more NHS staff are off sick.

What's causing the increase in people being off sick?
Covid infections.
Covid infections.
People catch Covid and go off sick.
And this data was for 'all staff', because 'all staff' data goes back to 2009.
But we've got individual staff grades going back to 2017.
But we've got individual staff grades going back to 2017.
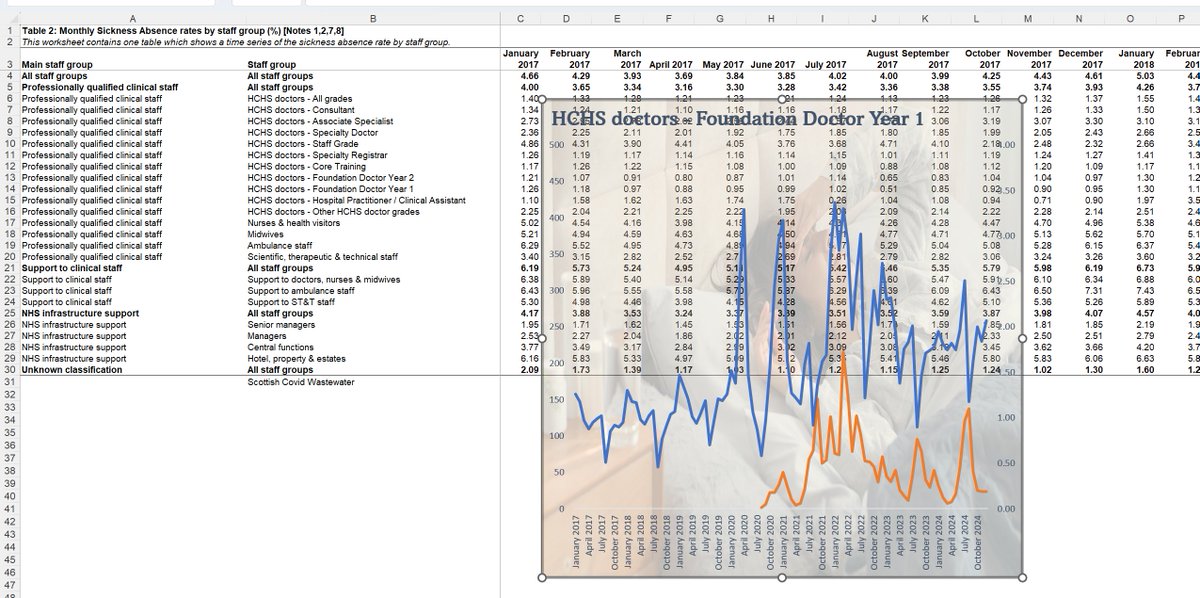
And this is what the increase for the junior doctors looks like:

You've got to be deliberately trying to not see the correlation to not see the correlation.
More covid cases = more off sick
Yes, there's a bit of variation in the timing.
But that's because this is *real* data.
But that's because this is *real* data.

This is real data straight off the real download from the real nhs website.
The Scottish Covid Wastewater data is here on this shiny scottish covid data app:
scotland.shinyapps.io/phs-respirator…
scotland.shinyapps.io/phs-respirator…
And remember that bit on the NHS website saying that anxiety was the biggest reason...

Well.
Since April 2019, the NHS has been publishing a detailed breakdown of which staff groups have which reasons for taking time off sick.
Since April 2019, the NHS has been publishing a detailed breakdown of which staff groups have which reasons for taking time off sick.
And it is a goldmine.
Oh yeah, and before we get on to it, can we pause in awe for a moment that Support to Ambulance Staff were off sick for an average of an astonishing 10% of the time in December 2024??
Yeah, now that one is astonishing.
But going back to the 'NHS sickness absence by reason and staff group' data... which is all here for you to dig into:
digital.nhs.uk/data-and-infor…
digital.nhs.uk/data-and-infor…
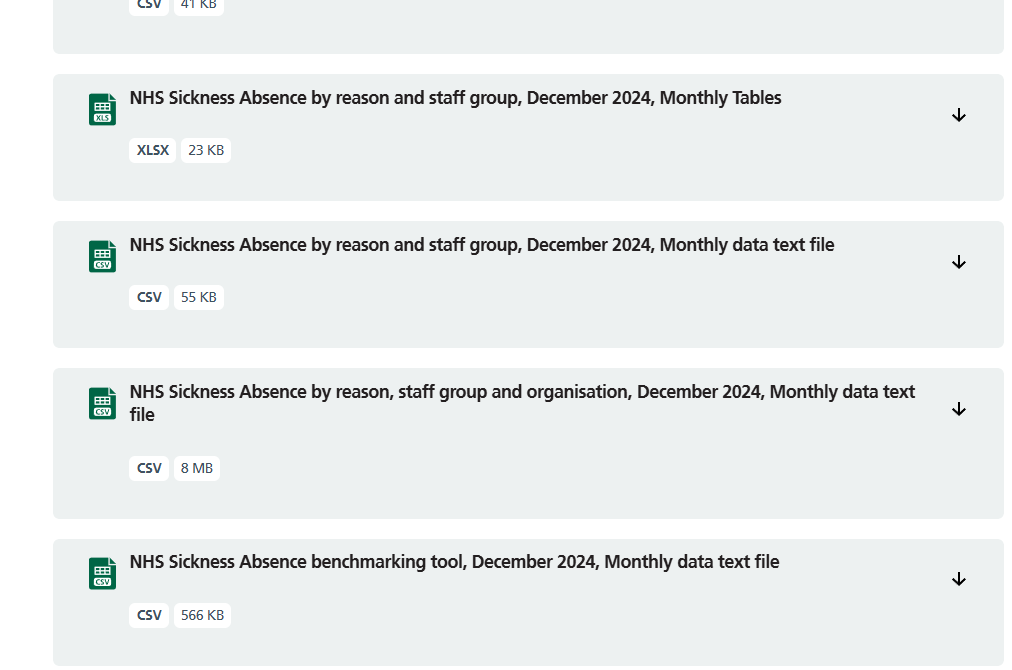
I haven't had time to go through all of it.
It's huge.
And I have a life.
It's huge.
And I have a life.
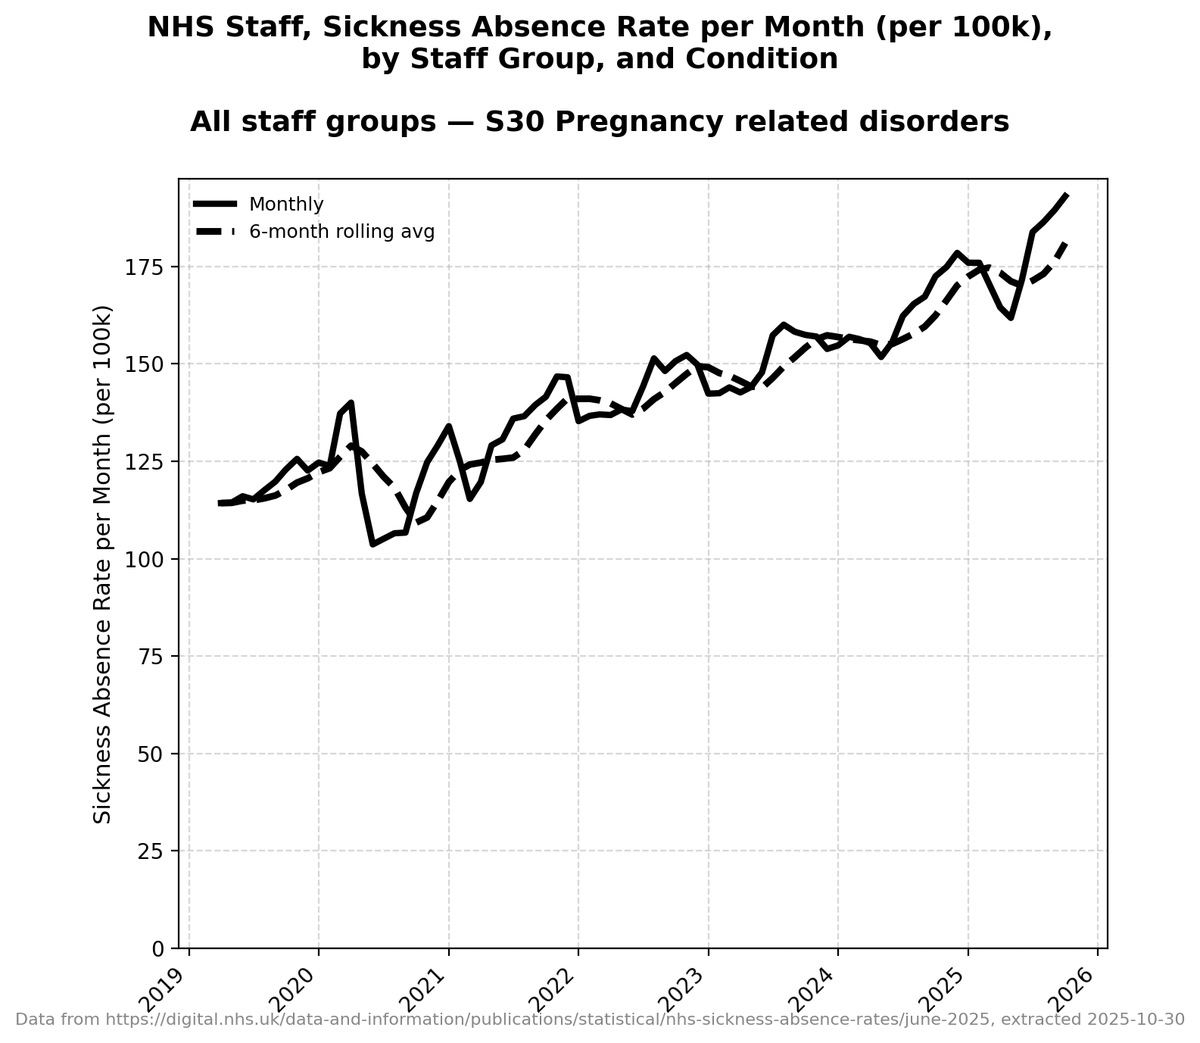
So here's the raw data on how many days are lost to each of these conditions *across all staff groups* per month.
I'm going to come back tomorrow and show the *changes in rates* (sick days per staff member per condition).
Some notable reasons why staff are *off sick*, and the changes...
Look carefully at those reasons.
And that some of them have picked up pace.
Look carefully at those reasons.
And that some of them have picked up pace.
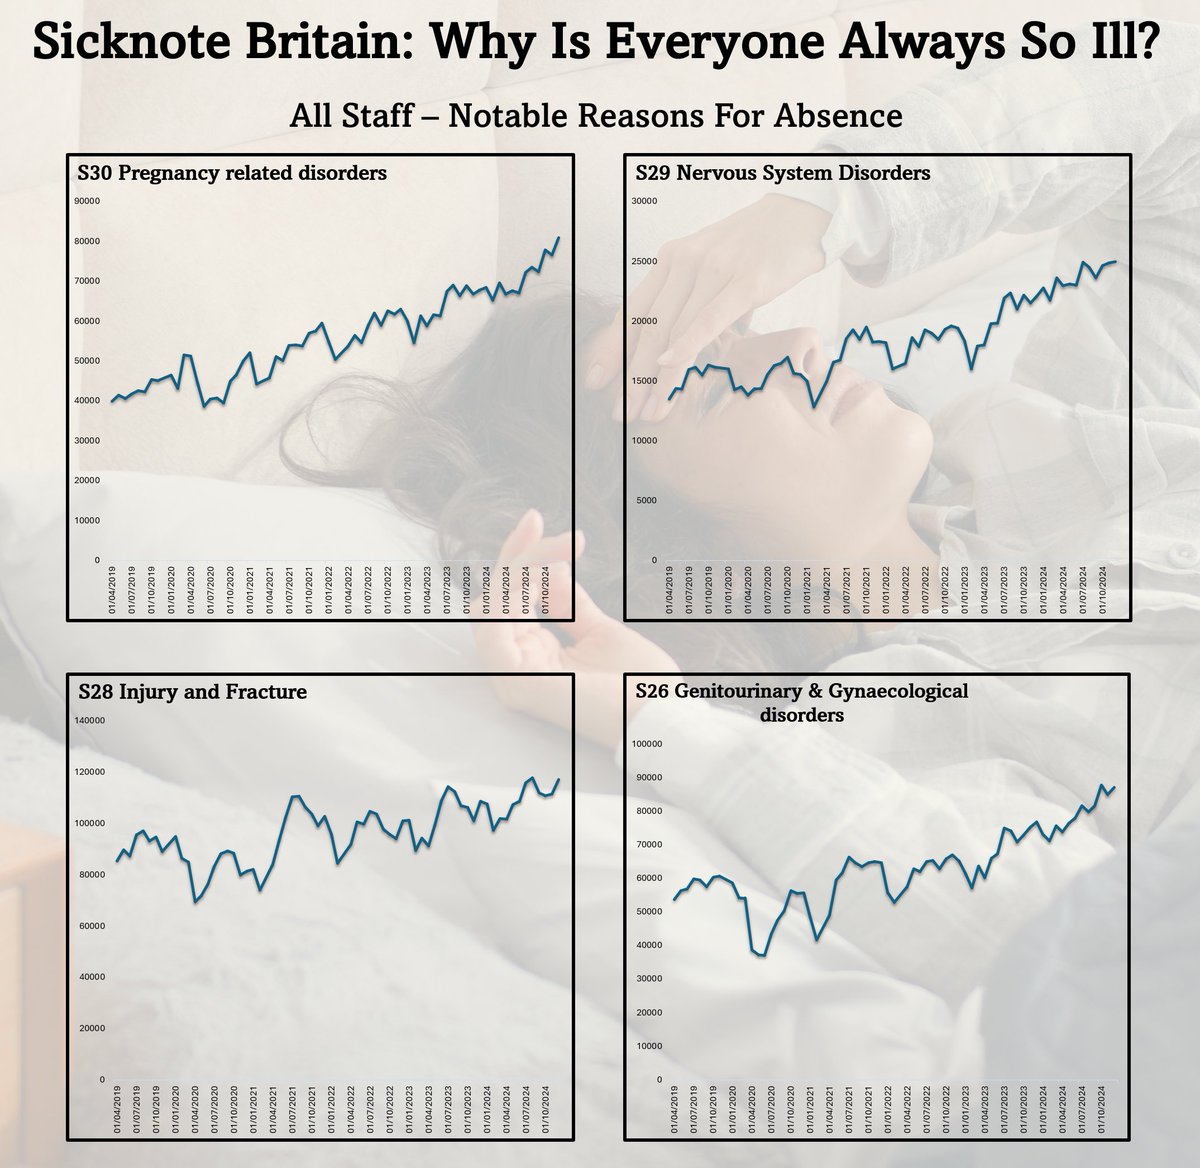
More:

More.

I think there are odd things notable on each of these, but can you look at how there are more people off sick with 'cold cough flu influenza' not just in the winters, but in the summers too??

And when you aggregate flu, cough, infectious diseases, ear nose throat, asthma, you get this:

Recognise the shape?
I hope you do by now.

And please remember.
This is a Covid peak too:
This is a Covid peak too:
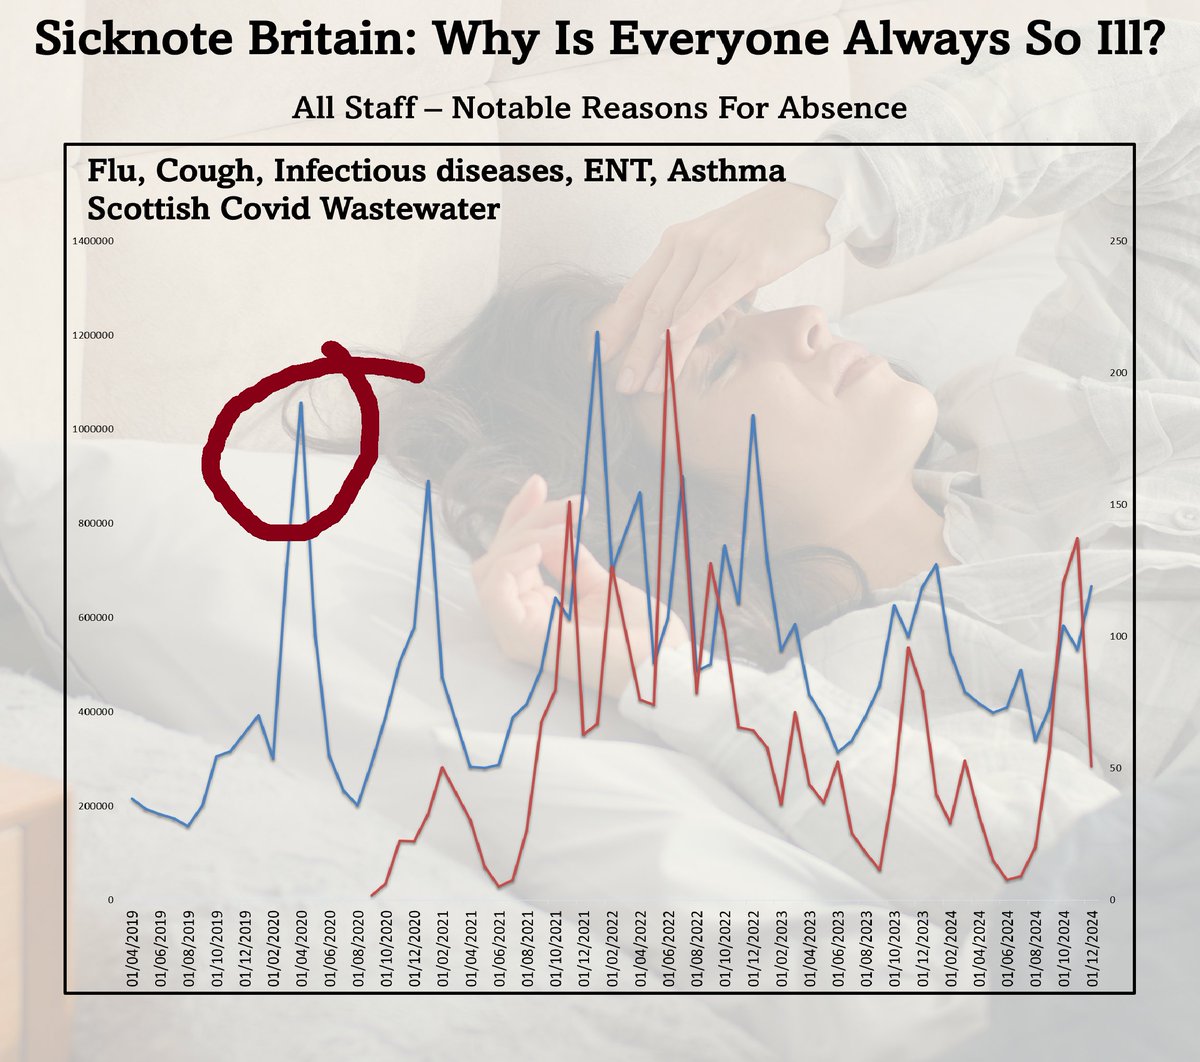
And like I said earlier, those peaks don't match *exactly*.
It's the next door forking country.
It's the next door forking country.
Go back through those 'notable reasons for absence'.
I'm going to post the rates per staff group tomorrow, because the 'notable reasons for absence' graphs don't take into account the changes in staff numbers...
... and because when we dial down into the *doctors* groups we get to see what may be happening to different age groups...
... but for now I'll leave you with one thought.
Some of these *young* people are off *a lot more* than they used to be... and...
Some of these *young* people are off *a lot more* than they used to be... and...
... take out 2022...
Do you see the trend?
Do you see the trend?

• • •
Missing some Tweet in this thread? You can try to
force a refresh