
Arg. I'm just going to bash through a messy thread.
I've been whacking my head against this data for three months after looking it up, and it's only got worse for the last three months.
It's about that question "are people still getting sicker".
Summary in the next tweet...
I've been whacking my head against this data for three months after looking it up, and it's only got worse for the last three months.
It's about that question "are people still getting sicker".
Summary in the next tweet...
Basically, I'm starting to think that there's a trend of sickness absence worsening since 2020, but that *2022* was an outlier.
So things gradually get worse 2020, 2021, 2023, 2024...
So things gradually get worse 2020, 2021, 2023, 2024...
And I think 2022 was a/the blip.
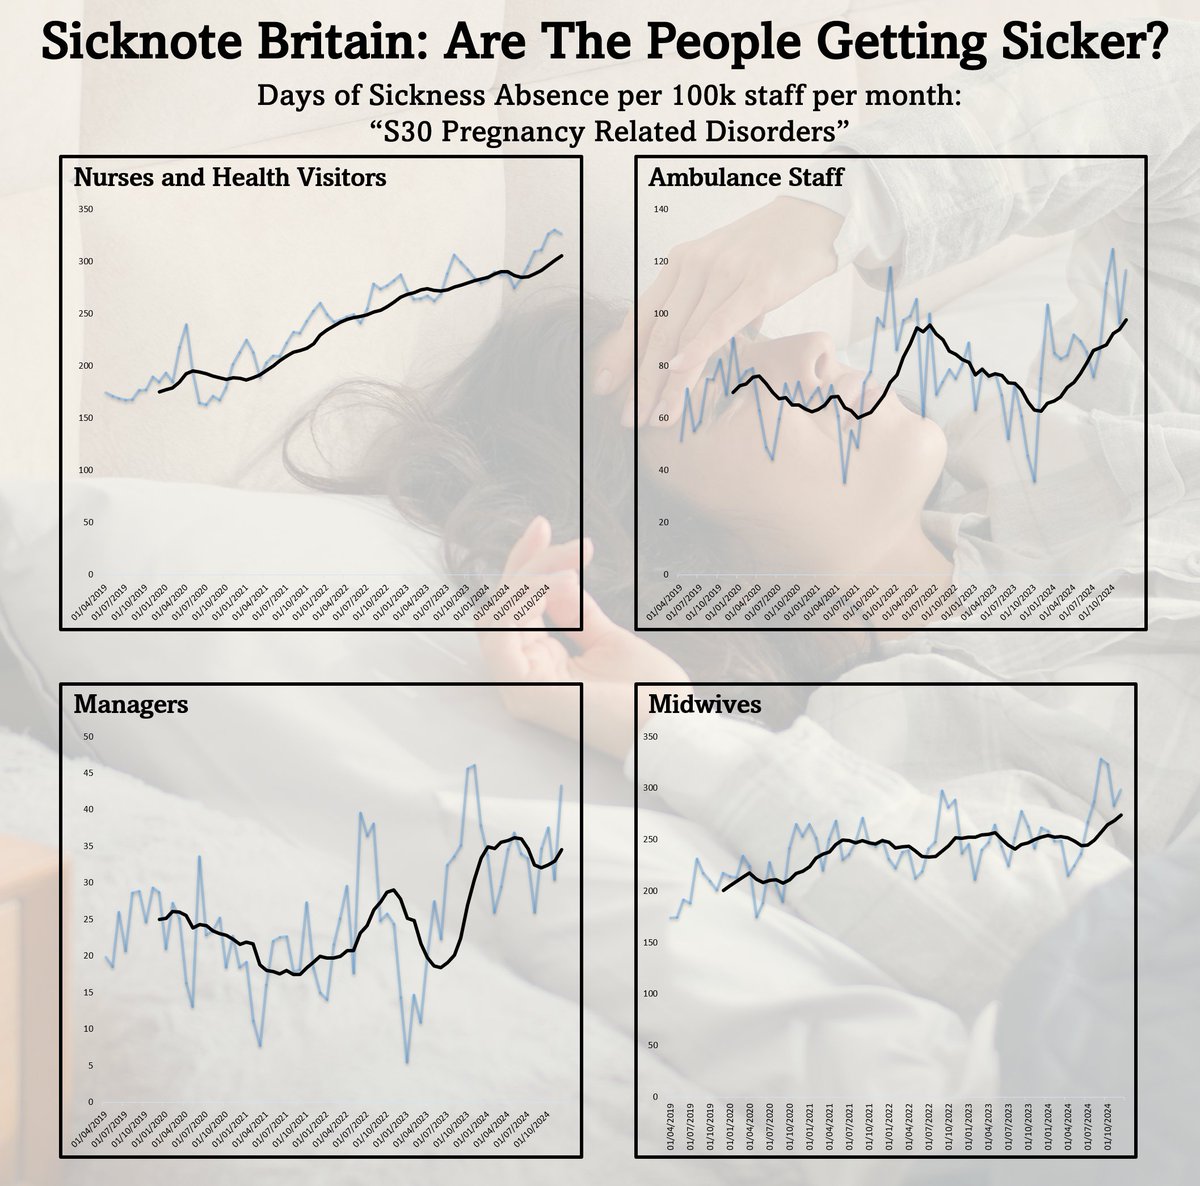
Here's a graph of how much sickness absence has increased above the 2017-2019 trend in these four groups of healthcare workers.
Yeah, I know that sometimes 2021 is higher than 2023, and sometimes 2020 is higher than 2021... this isn't stuck on rails.
Yeah, I know that sometimes 2021 is higher than 2023, and sometimes 2020 is higher than 2021... this isn't stuck on rails.

(I'm going to break that increased absence in 2022 down in a minute and explain why that blip is there and explain the overall trend, it's really fascinating.)
Let's look at the change in the general trend for a moment...
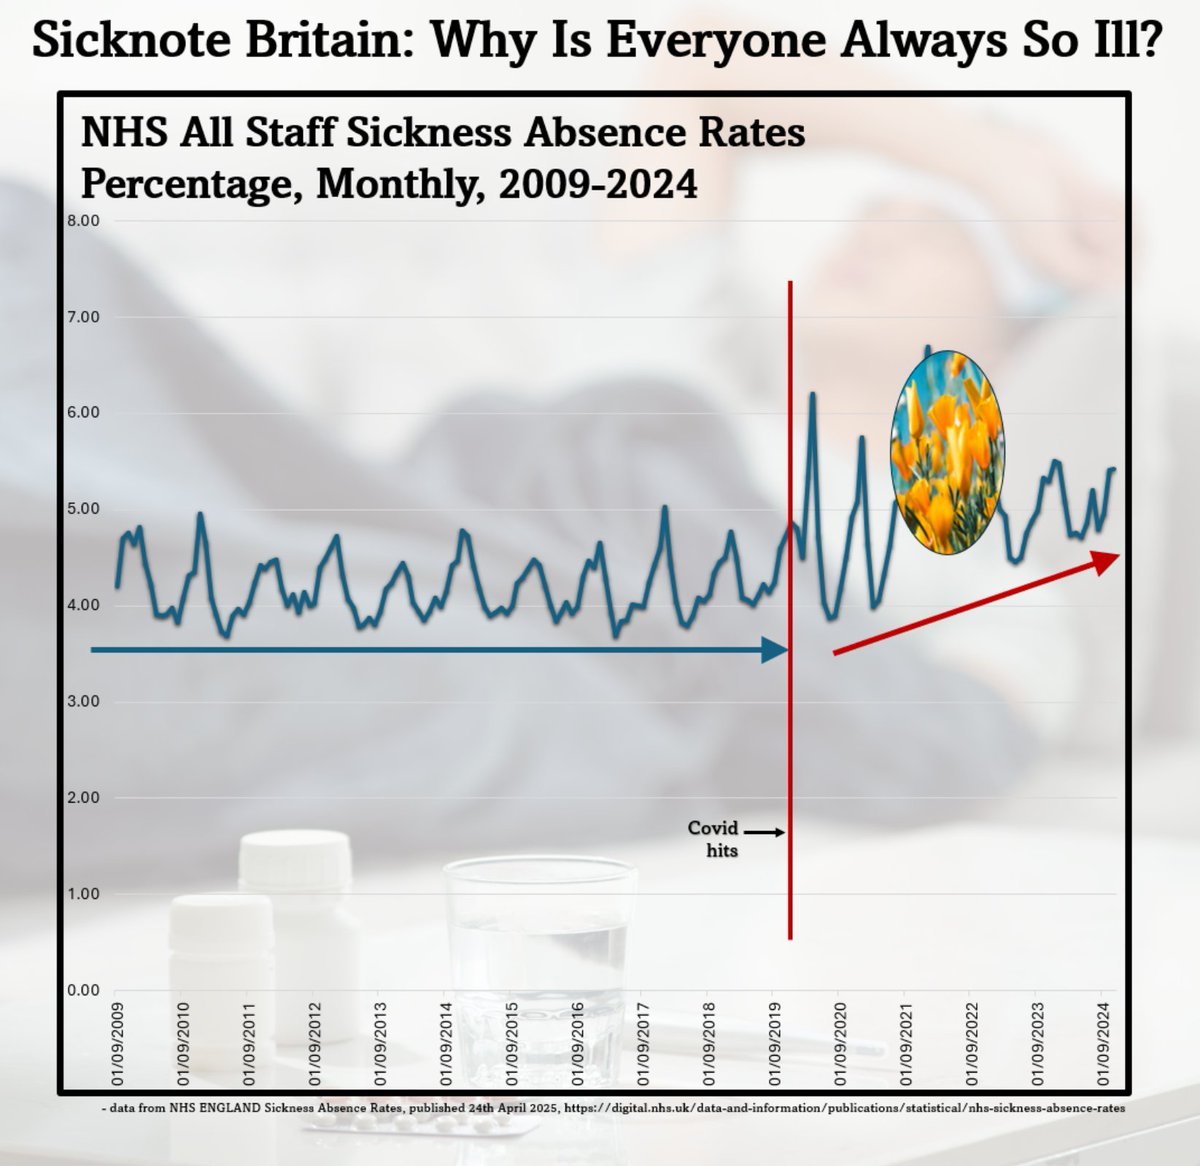
Hide 2022 for a moment on this graph of sickness absence rates for all staff in the NHS.
Can you see the new trend?
Hide 2022 for a moment on this graph of sickness absence rates for all staff in the NHS.
Can you see the new trend?
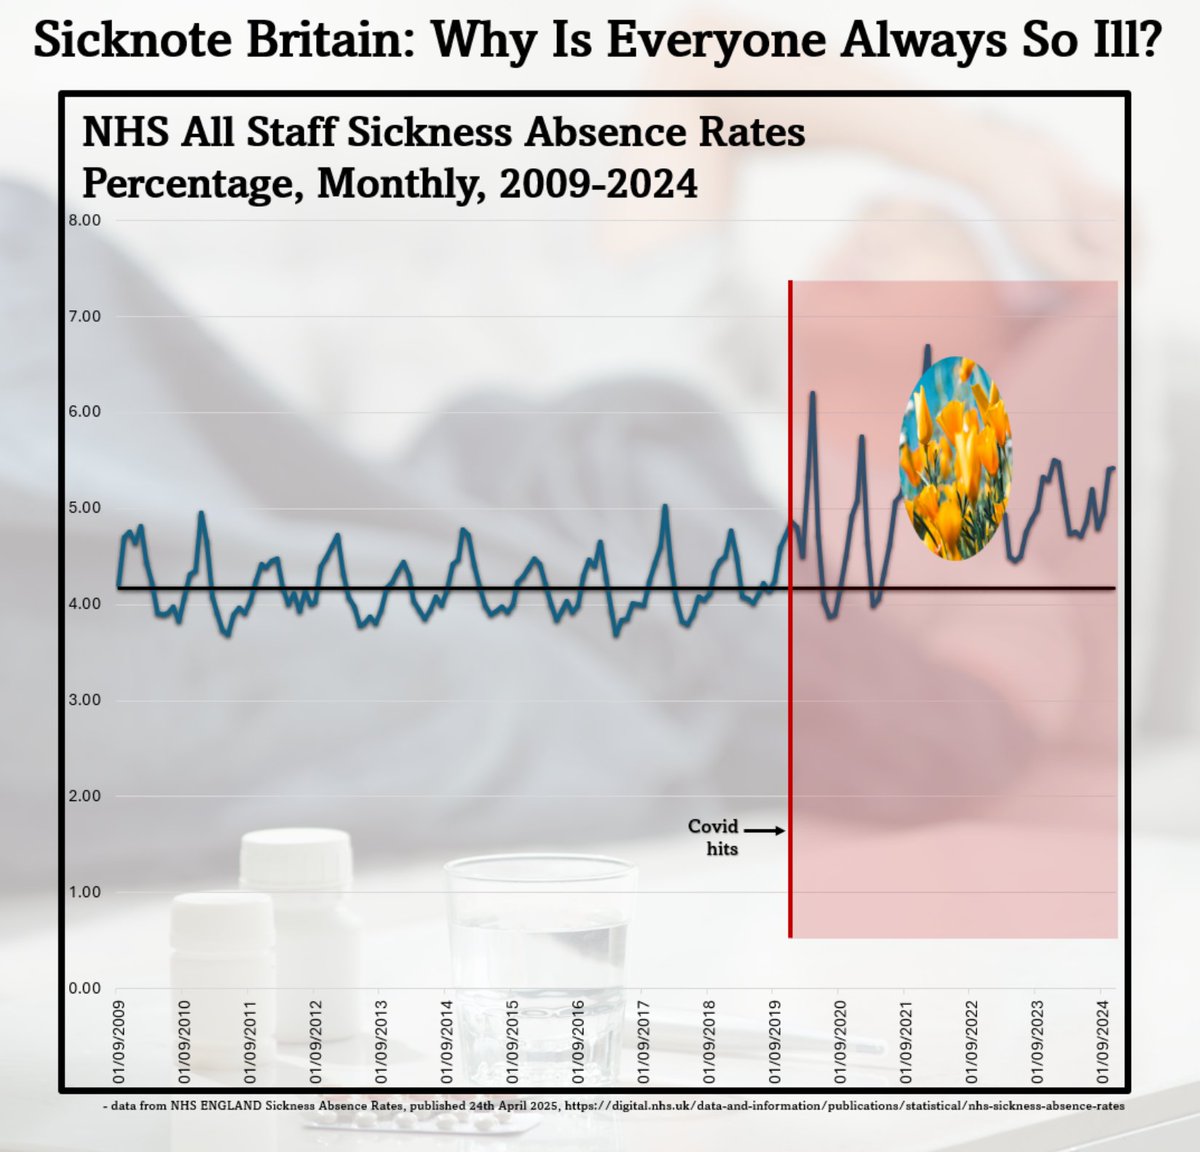
Can you see?

*2023 and 2024 were better than 2022*, *but 2023 and 2024 were worse than 2020 and 2021*.
Now the reason I started looking at all this data was that through my job I met a healthcare worker who told me about a personal tragedy, and they said that it was funny how it seems to be that these things happen to other people at the same time too.
And I thought to myself, "well, I've heard about a couple of other examples of the same personal tragedy", but that's not a good way to estimate rates of prevalence... so I went to look to see if there was any data about it.
Now, the data about that stuff happening on a population level in the UK is only published about 18 months after the end of a year.
So the data on it for 2023 is just out now.
So the data on it for 2023 is just out now.
But these were all situations that I heard about in 2024.
And then I remembered that the data for NHS staff also includes *sickness absence by reason*.
And the number of people on the database is something like one point three million.
And the number of people on the database is something like one point three million.
So even if there isn't data for the entire population, there's data for the working age population of the NHS, and they're all across the country, so it may show some signs of trends.
Getting the data together was complicated and long-winded, because the sickness absence by reason data is in monthly files and has changed format a couple of times.
digital.nhs.uk/data-and-infor…
digital.nhs.uk/data-and-infor…
It doesn't go back to 2009 like the overall staff absence rate data (below), but it does go back to 2019, so there's a year's worth of data before Covid hits.
But you can see, sickness absence rates for 2009-2019 are *pretty consistent*.
But you can see, sickness absence rates for 2009-2019 are *pretty consistent*.

So any changes in individual reasons for sickness from 2020 onwards are probably pretty representative of any changes in the overall trends.
So I looked up the NHS staff data for the different reasons for sickness absence, and I compiled them all, and I found some stuff that makes me quite uneasy.
And like I said, this is a messy thread. I've been looking hard at this NHS data for three months, and I've tried to get my head round it all, but I feel like I've failed to make sense of it.
If you're of a nervous disposition, please stop reading.
That's a trigger warning.
That's a trigger warning.
So people are off sick... and when they're off sick in the NHS they give a reason, and that reason gets noted down.
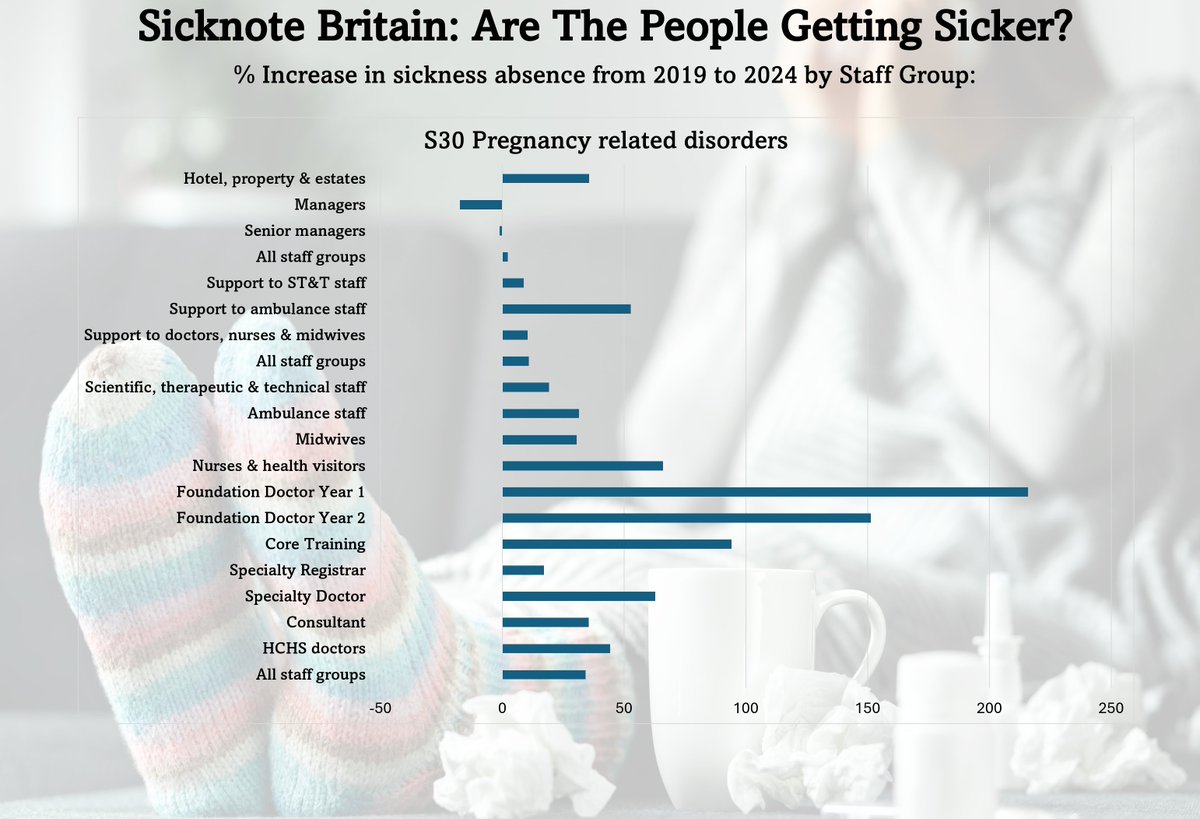
And when I went looking for the closest thing I could find to the condition I mentioned earlier, I found these kind of increases in sick leave for "S30 Pregnancy Related Disorders".
Blue line is monthly numbers, black line is 12 month average.
Blue line is monthly numbers, black line is 12 month average.

You notice that in all these different staff groups (and all the rest too) the most recent year is the worst?
And you might think "oh well, this is only the trend over the last five years".
Yes, that's right, that's all we have.
Yes, that's right, that's all we have.
But do you remember how consistent things were for the 10 years before covid, and how things have increased in the last five years?
One of my next thoughts was "well, this rolling annual average only goes back to the beginning of 2020".
But that represents the absences in *2019*.
Before the arrival of Covid, and year that was actually...
A tiny bit worse than the preceding years.
But that represents the absences in *2019*.
Before the arrival of Covid, and year that was actually...
A tiny bit worse than the preceding years.

And then I thought, "well, these numbers are tiny", this problem with pregnancy disorders is only affecting a small number of people.
But there are other conditions that are steadily increasing that are affecting larger numbers of people...
But there are other conditions that are steadily increasing that are affecting larger numbers of people...
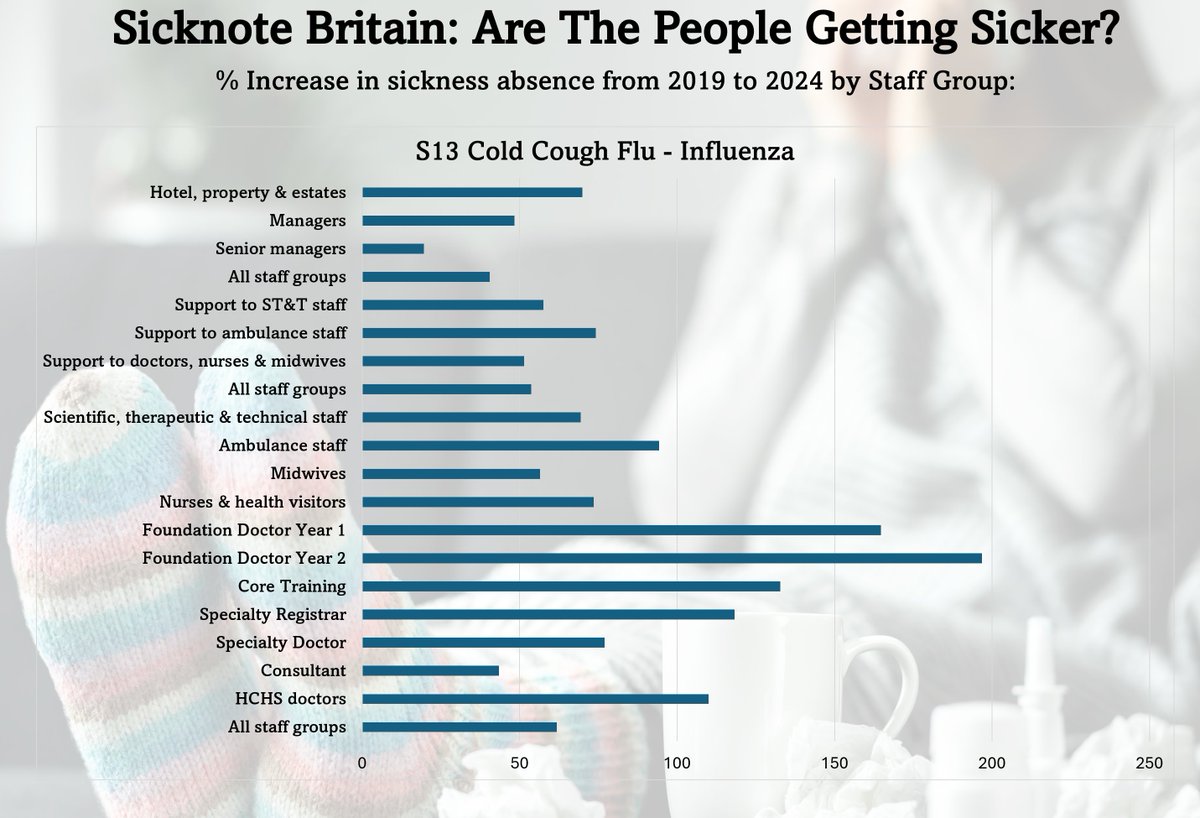
Here's "S13 Cold Cough Flu - Influenza"
See the green circle?
That's how likely all doctors were to be off for this reason in the year leading up to the pandemic.
See the red circle?
That's now.
See the green circle?
That's how likely all doctors were to be off for this reason in the year leading up to the pandemic.
See the red circle?
That's now.

Or at least, it's the year up to *December 2024*.
But do you see the overall trend there?
Do you see that the best points keep getting worse, and so do the worst point?
Do you see that the best points keep getting worse, and so do the worst point?
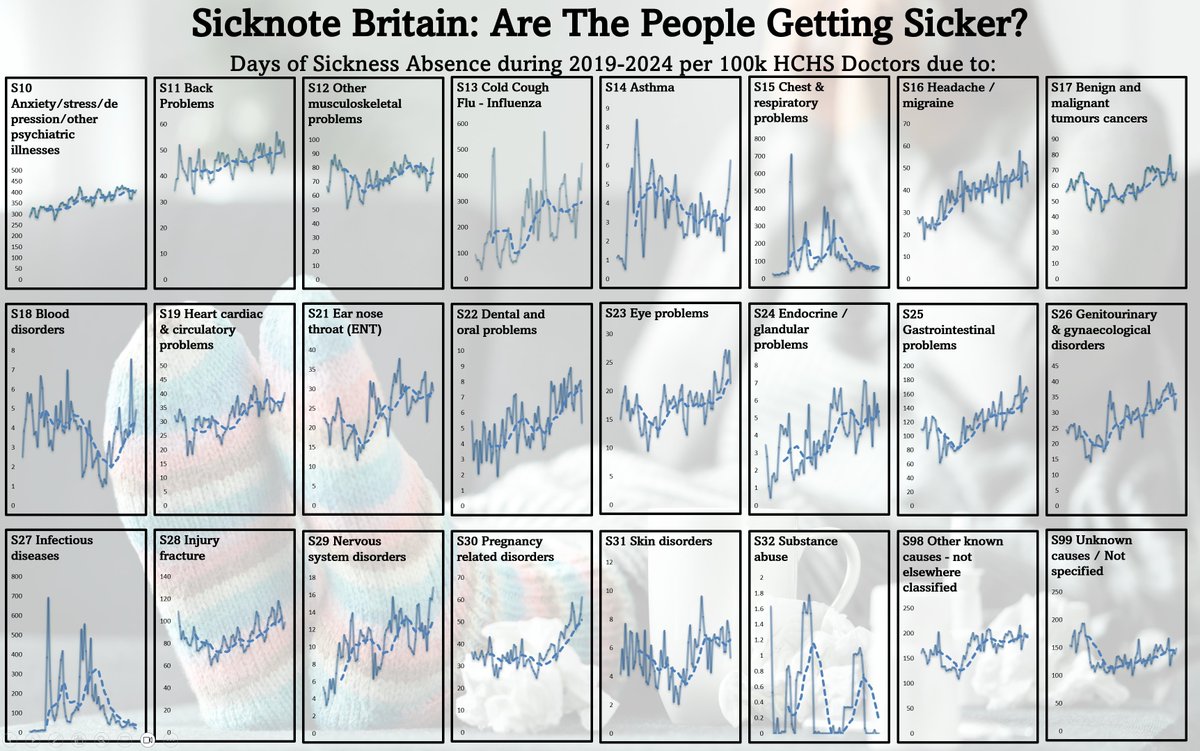
These are *all* the reasons that Hospital and Health Care Settings Doctors have been off sick with:

And those, and all the preceding, graphs take into account the growing number of NHS staff.
This is *per 100k*.
This is *per 100k*.
Now.
Can you see the two that skew the absence rate in 2022?
Can you see the two that skew the absence rate in 2022?
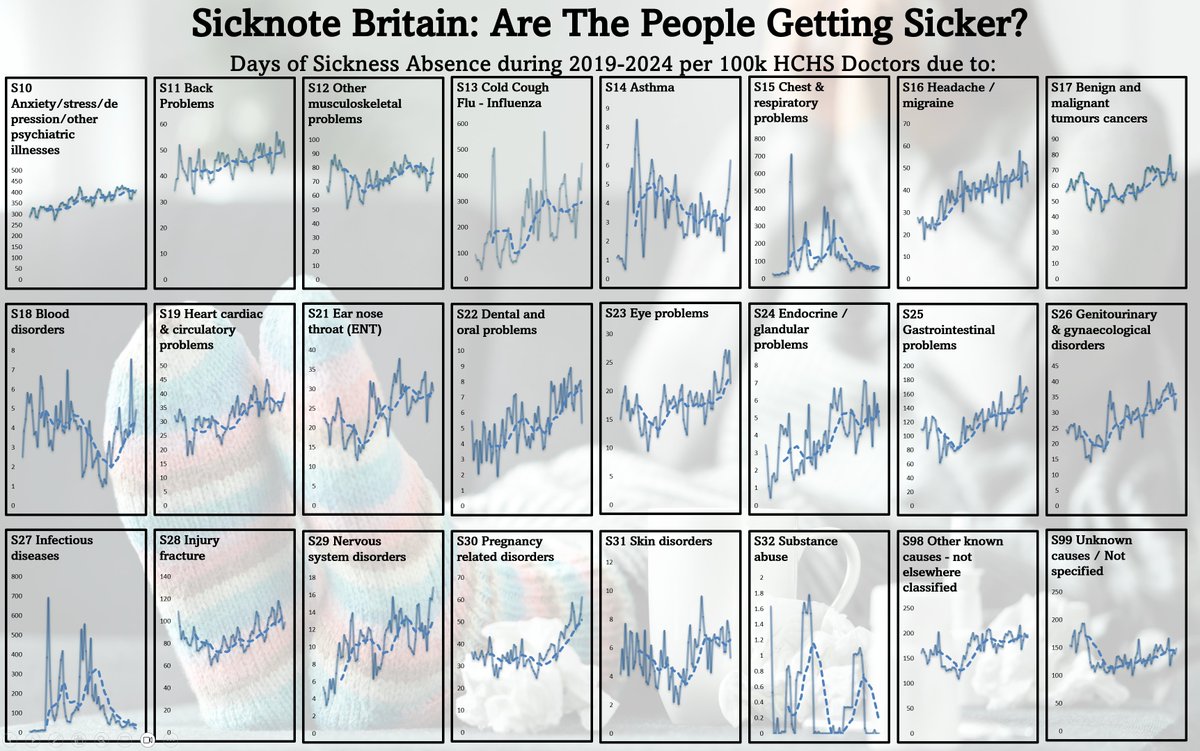
So the massive number of people who were off short term with Covid... and yes, those graphs perfectly match the covid waves... skew the number of people off that year.

But it's all the rest of them that are driving that increase in overall absence.
And yes, 20% of them are mental health illnesses like Anxiety, stress, depression.
BUT COVID INFECTIONS CAUSE THOSE PROBLEMS.
And yes, 20% of them are mental health illnesses like Anxiety, stress, depression.
BUT COVID INFECTIONS CAUSE THOSE PROBLEMS.
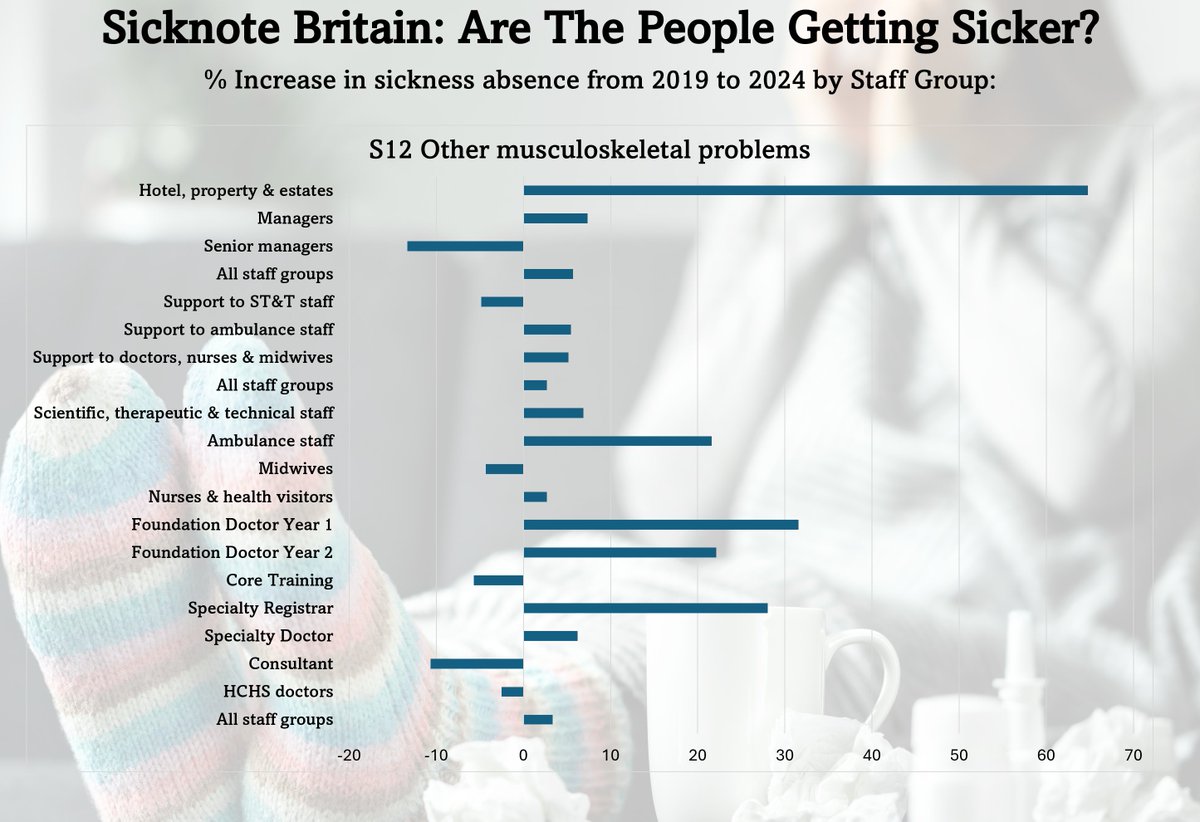
Rather than show all of the individual graphs, I'm just going to short cut to showing *how much worse things are in 2024 than in 2019*, for some of the sickness absence reasons for all the groups.
That pregnancy related disorders one.
Look at the scale at the bottom.
That's in percent.
Pregnancy related disorders.
Look at the scale at the bottom.
That's in percent.
Pregnancy related disorders.
S10 Anxiety/stress/depression/other psychiatric illnesses

S12 Other musculoskeletal problems
S13 Cold Cough Flu - Influenza
Look at that.
This is how much more likely all of these staff groups are off to be sick with a cold cough flu.
COVID INFECTIONS MAKE EVERY OTHER BUG WORSE.
Look at that.
This is how much more likely all of these staff groups are off to be sick with a cold cough flu.
COVID INFECTIONS MAKE EVERY OTHER BUG WORSE.
This is just the raw data.
I've taken out F1s, because there was a massive reduction which skewed the chart.
S17 Benign and malignant tumours cancers
I've taken out F1s, because there was a massive reduction which skewed the chart.
S17 Benign and malignant tumours cancers
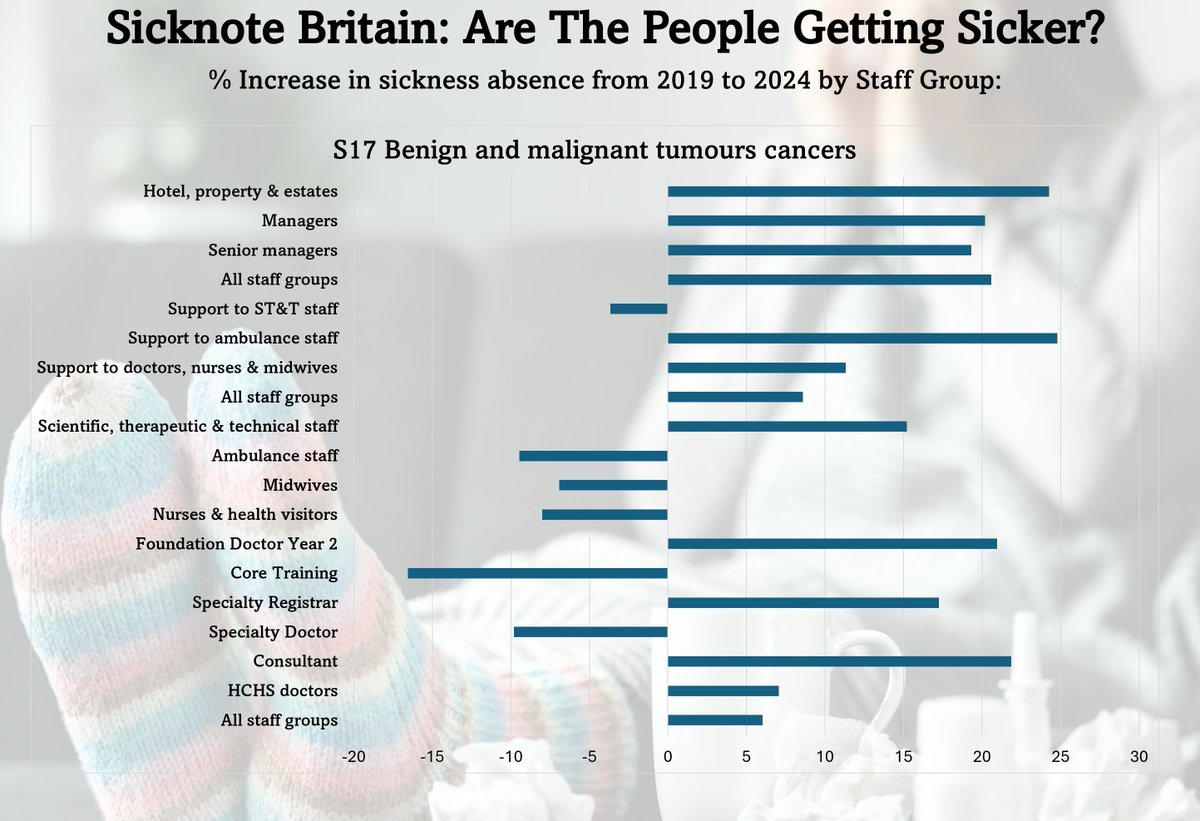
These.

These.

And these.

Are people sicker now than in 2019?
Across all of these markers, across all of these varied staff groups in the NHS, the answer is mostly:
Across all of these markers, across all of these varied staff groups in the NHS, the answer is mostly:
Yes.
Thank you for reading and caring.
I'm going to post some more graphs tomorrow.
Ha.
I forgot to distinguish between the three different types of 'all staff groups'.
That's just one of the dozens of things that are frustrating about the NHS Sickness Absence databases!
The bottom one is *all staff*.
I forgot to distinguish between the three different types of 'all staff groups'.
That's just one of the dozens of things that are frustrating about the NHS Sickness Absence databases!
The bottom one is *all staff*.
https://x.com/1goodtern/status/1920571214994567588
Just one more way of looking at it this morning...
Looking at each staff group, you can look at *how likely they were to be off in 2019 with each condition*, and *how likely they were to be off with that condition* in 2024, and compare the two.
So here are four staff groups:
Looking at each staff group, you can look at *how likely they were to be off in 2019 with each condition*, and *how likely they were to be off with that condition* in 2024, and compare the two.
So here are four staff groups:
All hospital and healthcare setting doctors.
Core training doctors.
Foundation Year 2 doctors
Foundation Year 1 doctors.
Core training doctors.
Foundation Year 2 doctors
Foundation Year 1 doctors.
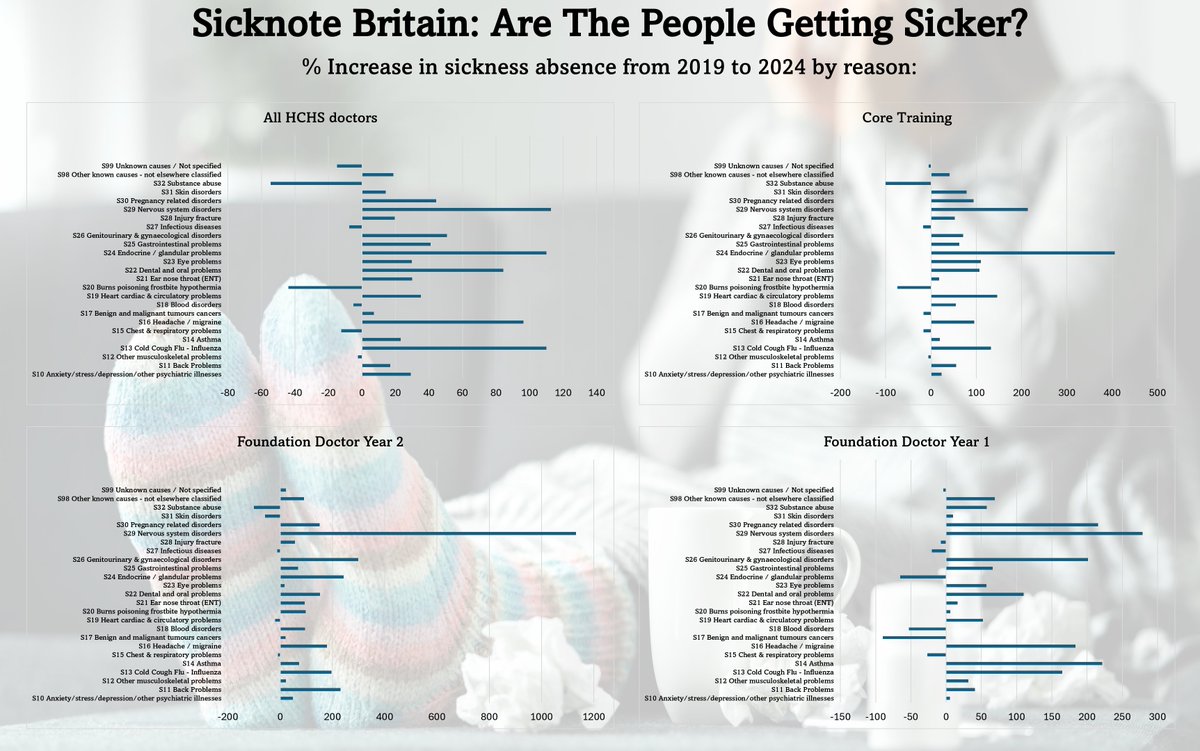
Look carefully at the increases in Core, F1, and F2s.

Why?
Because they are *young*.
Mostly in their 20s.
Mostly in their 20s.

And a lot of them are off sick TWICE AS MUCH as they were in 2019.
But more importantly...
Look at why
👀
Look at why
👀

• • •
Missing some Tweet in this thread? You can try to
force a refresh


