The COLLAPSE of the US Dollar has begun
This could have major consequences for the markets
A thread 🧵
This could have major consequences for the markets
A thread 🧵

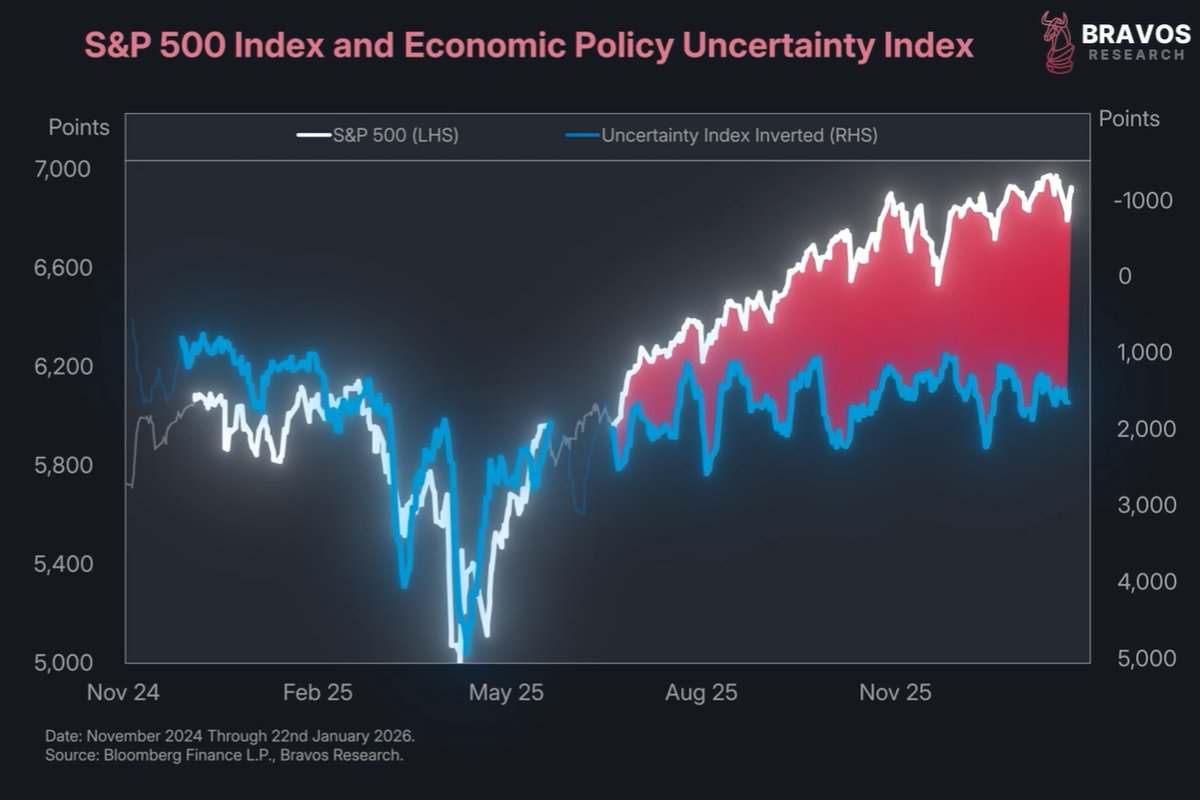
2/ Something has just broken on the US dollar
The DXY just posted its biggest drop since COVID
And it’s now completely disconnected from its fundamentals
The DXY just posted its biggest drop since COVID
And it’s now completely disconnected from its fundamentals

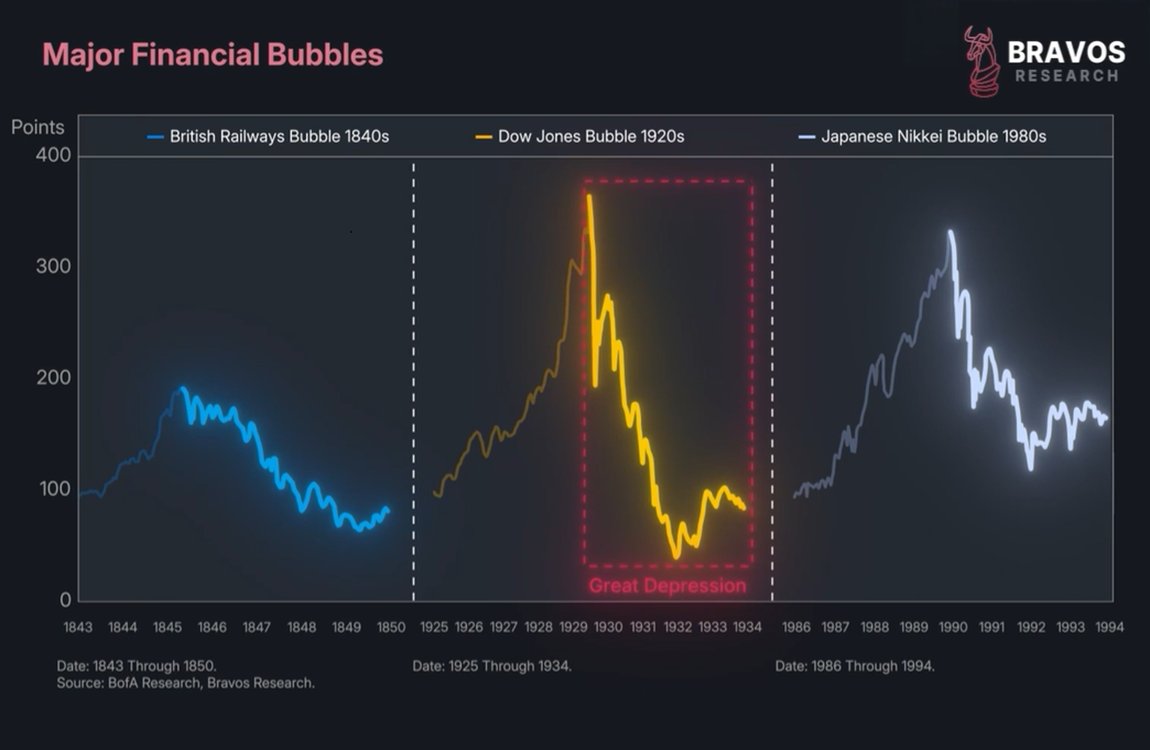
3/ Since the dawn of civilization, every fiat currency has eventually collapsed into irrelevance
And when that collapse comes, those holding the currency usually see their wealth wiped out
History is clear about how this ends
And when that collapse comes, those holding the currency usually see their wealth wiped out
History is clear about how this ends

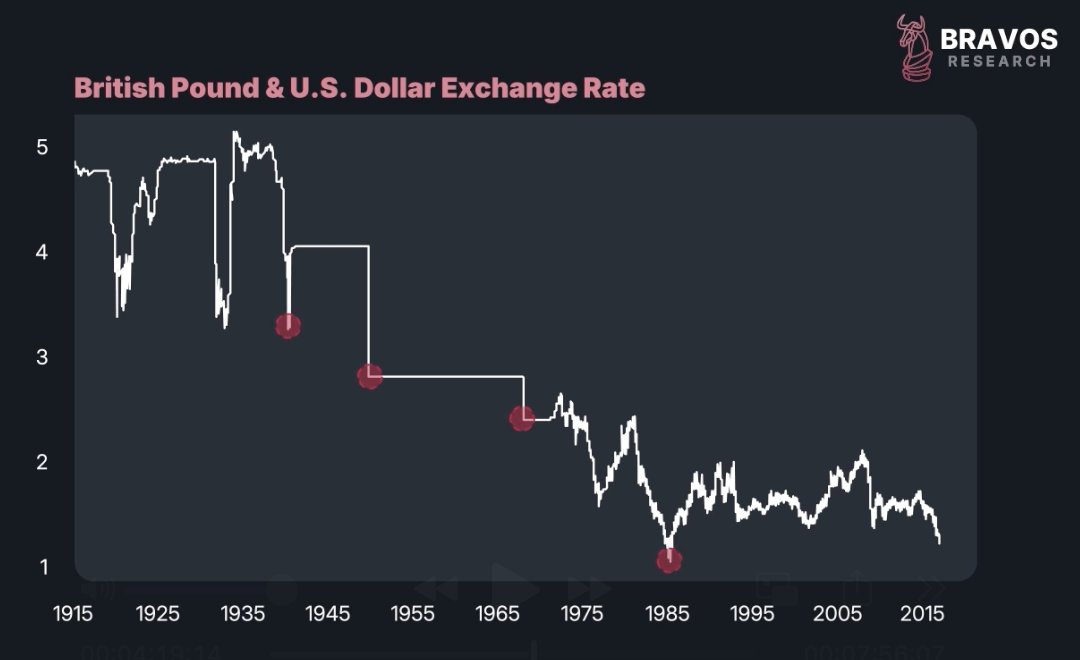
4/ Take the British pound, for example
In the 1940s, £1 was worth $5
It was the world’s dominant currency
By the 1980s, £1 was worth just $1
That collapse destroyed the purchasing power of its holders
And reshaped global trade, economic power, and geopolitics
In the 1940s, £1 was worth $5
It was the world’s dominant currency
By the 1980s, £1 was worth just $1
That collapse destroyed the purchasing power of its holders
And reshaped global trade, economic power, and geopolitics

5/ Today, it’s not the British pound under pressure, it’s the US dollar
Still the world’s dominant currency, but now some are projecting a similar decline ahead
And Donald Trump’s proposed government policies could be the spark that lights the fuse
Find out our exact trading strategy for these conditions at:
go.bravosresearch.com/X
Still the world’s dominant currency, but now some are projecting a similar decline ahead
And Donald Trump’s proposed government policies could be the spark that lights the fuse
Find out our exact trading strategy for these conditions at:
go.bravosresearch.com/X
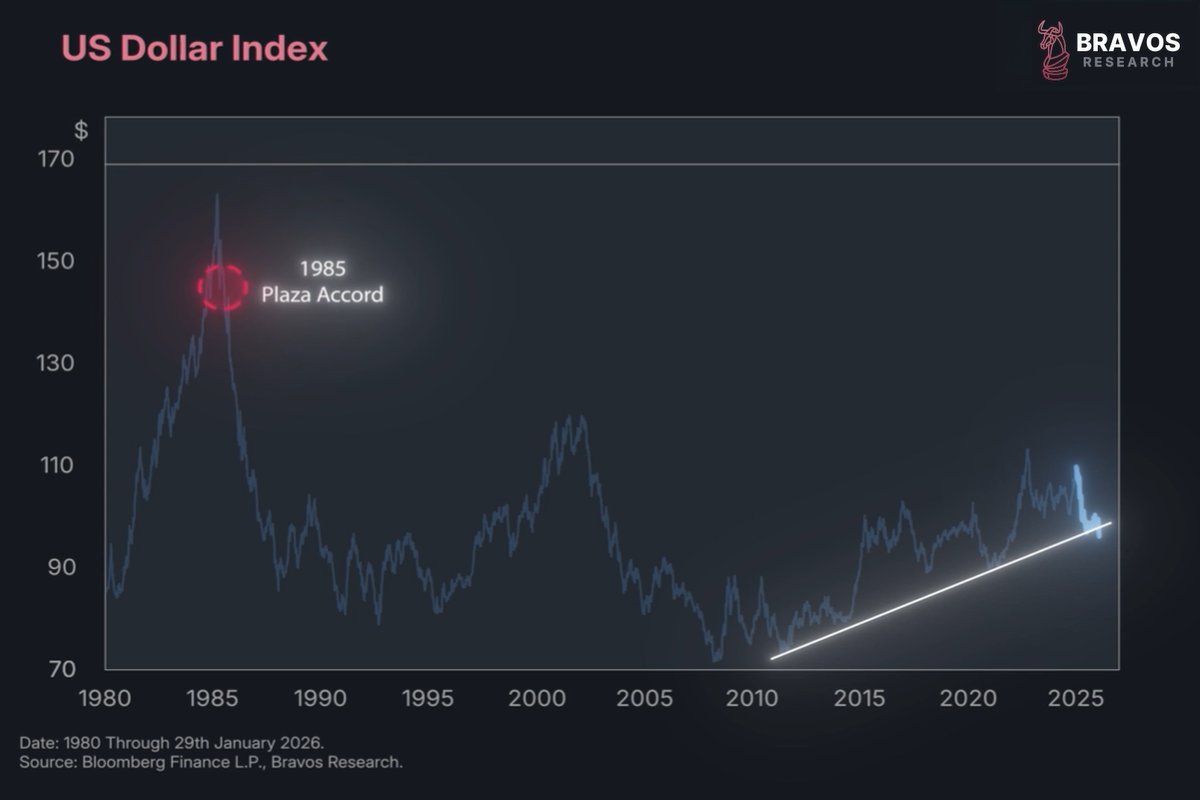
6/ The US dollar index (DXY) has faced heavy selling pressure since April 2nd (Liberation Day) when Trump announced new tariffs
Now, it's not been an outright collapse, but something has happened that is suggesting this decline in the US dollar could be a lot more dangerous than it looks
Now, it's not been an outright collapse, but something has happened that is suggesting this decline in the US dollar could be a lot more dangerous than it looks

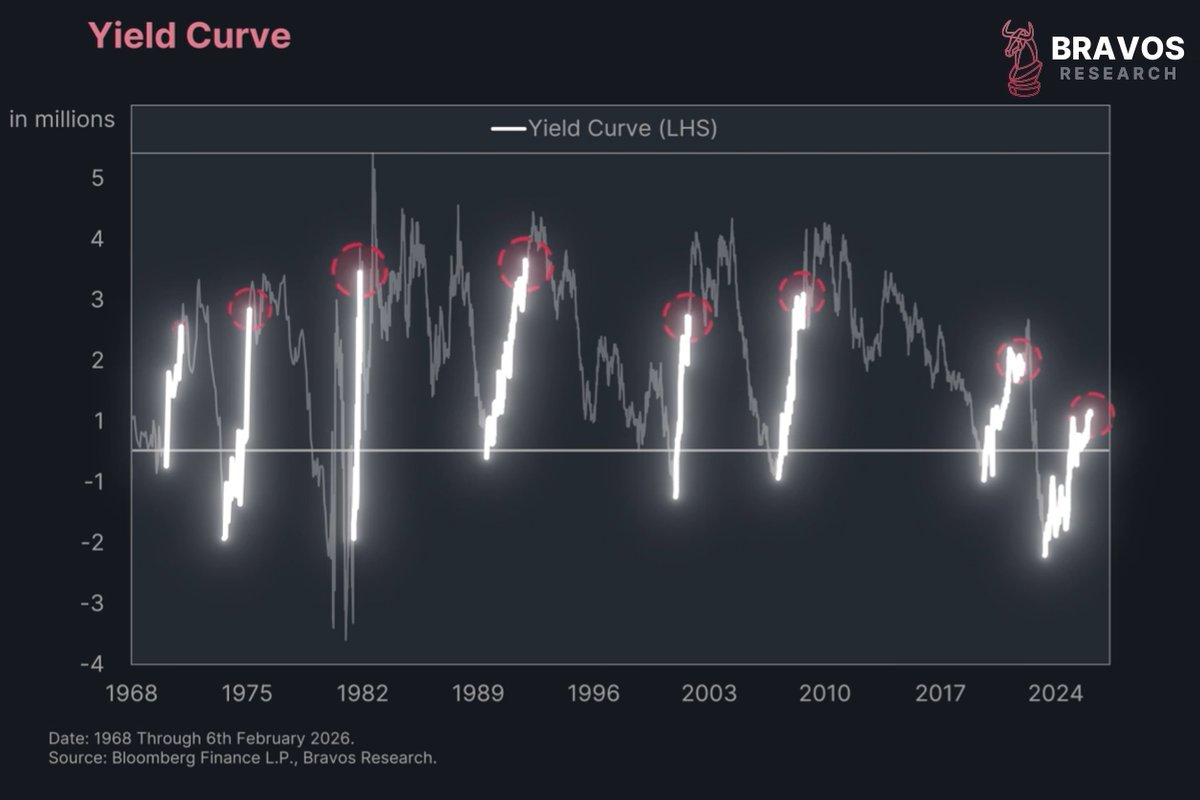
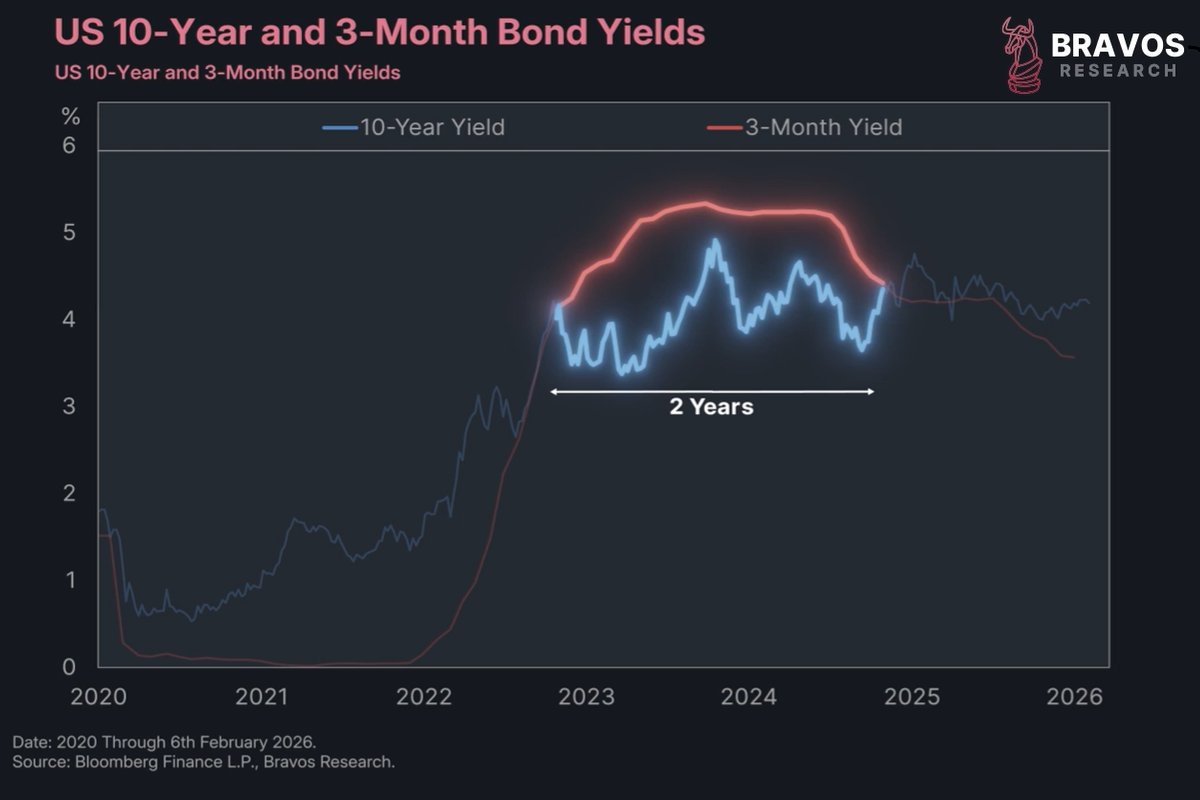
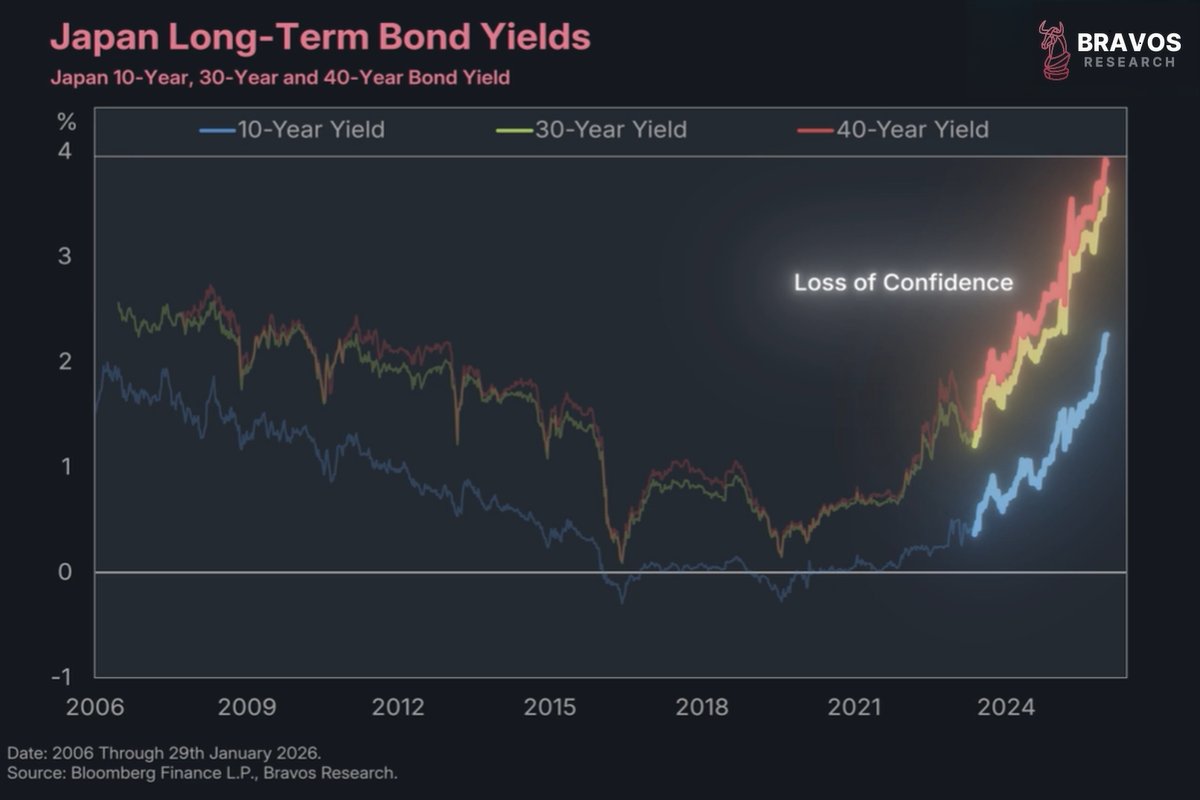
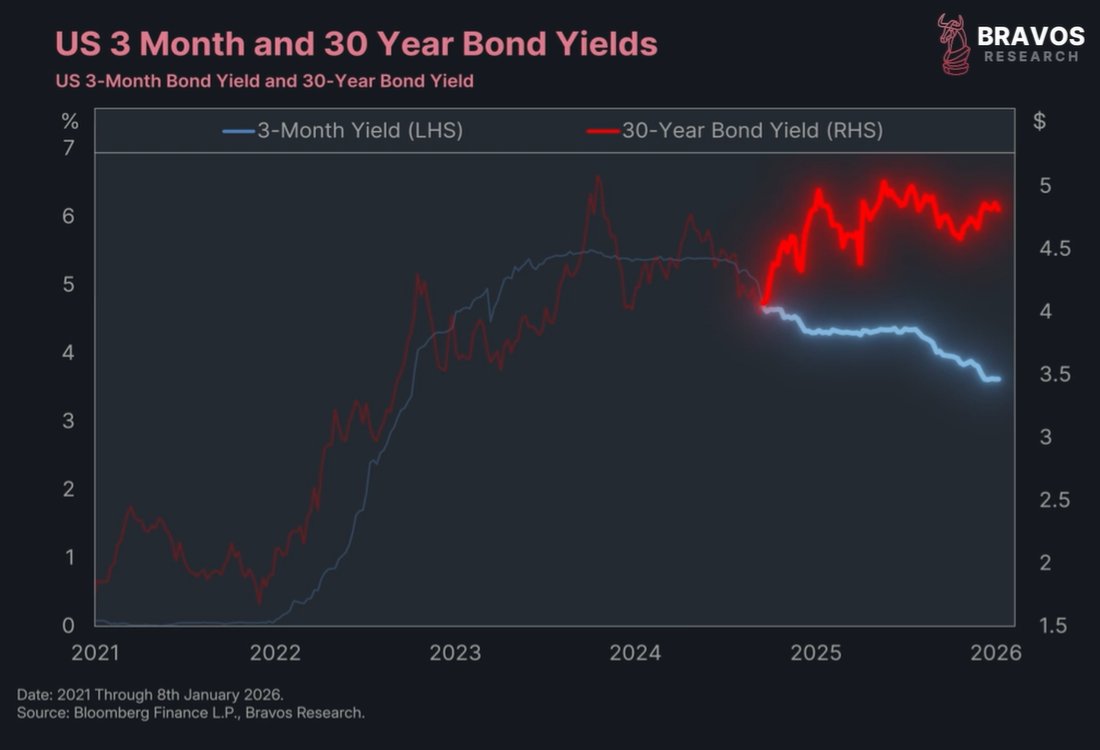
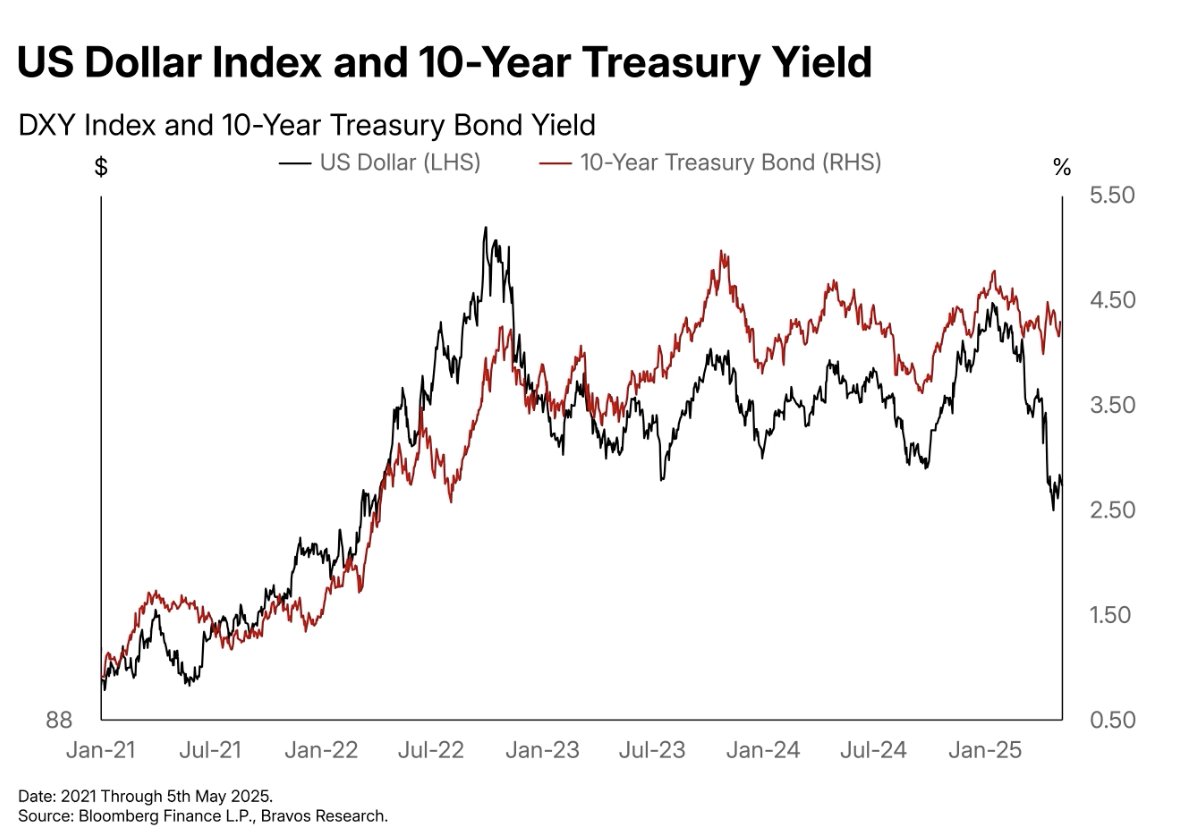
7/ You see, DXY usually moves in sync with US bond yields
Which reflect the return on holding US dollars
That relationship makes sense:
As yields rise, the dollar should strengthen
But for the first time in years, that connection is starting to break
Which reflect the return on holding US dollars
That relationship makes sense:
As yields rise, the dollar should strengthen
But for the first time in years, that connection is starting to break
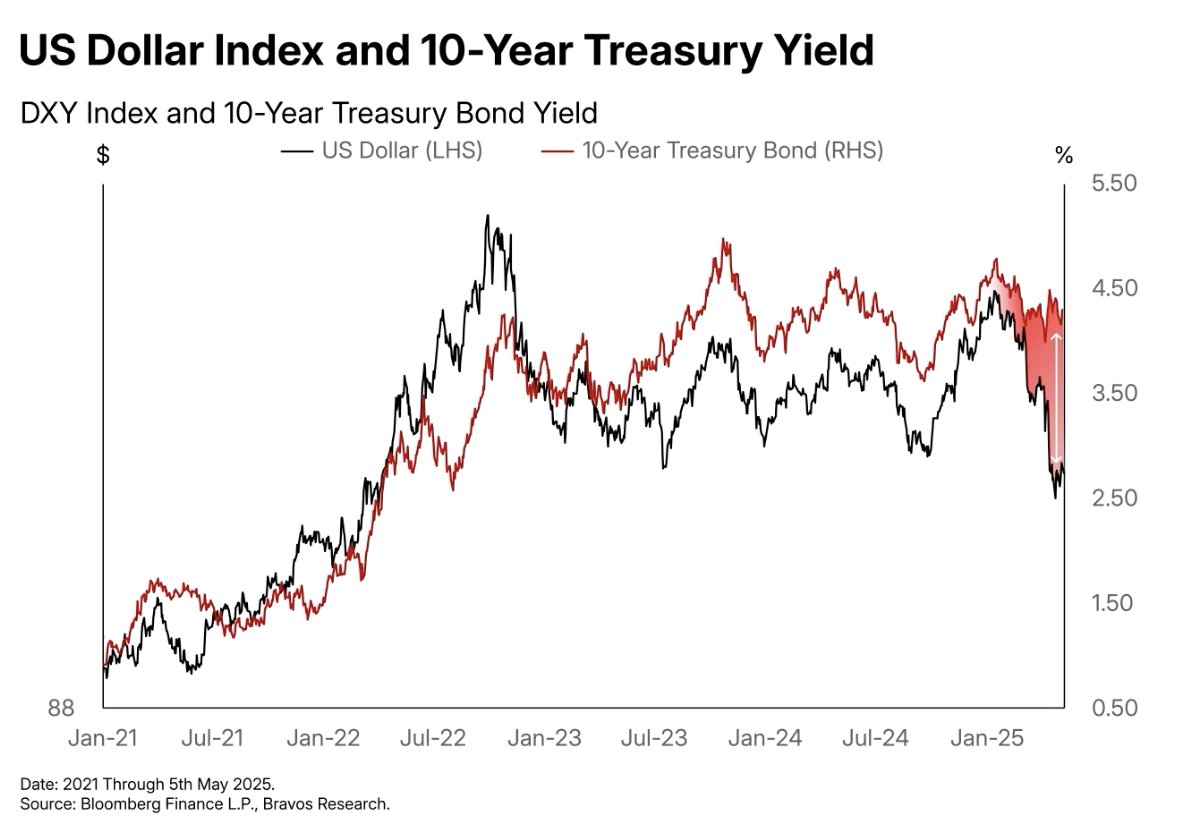
8/ The chart now shows the dollar weakening despite high yields
That’s a serious warning sign
It suggests 1 of 2 things:
Either interest rates must rise even more to stabilize the dollar
Or the dollar is at real risk of a steeper collapse
That’s a serious warning sign
It suggests 1 of 2 things:
Either interest rates must rise even more to stabilize the dollar
Or the dollar is at real risk of a steeper collapse
9/ So what’s behind this growing gap?
First, remember tariffs are taxes and taxes slow down the economy
And since forex markets price in growth, a weaker economy means a weaker dollar
That’s the most basic explanation for this dislocation
First, remember tariffs are taxes and taxes slow down the economy
And since forex markets price in growth, a weaker economy means a weaker dollar
That’s the most basic explanation for this dislocation
10/ That explanation might prove temporary though
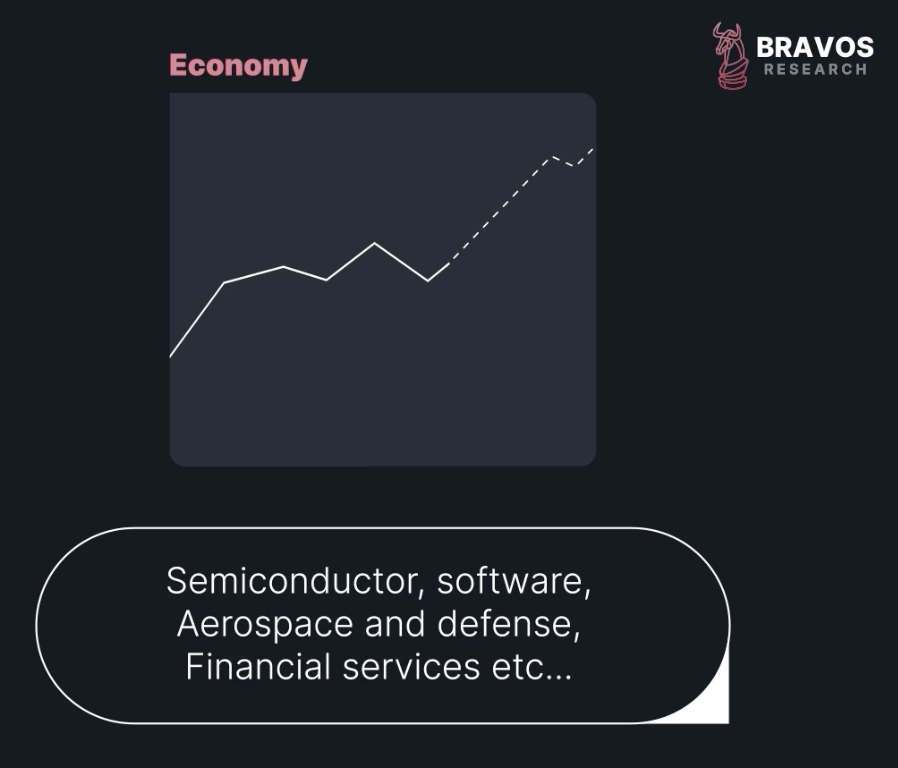
The US economy is still strong and leads in many future-facing industries
But the 2nd reason behind the DXY-yield gap is more worrying
The US economy is still strong and leads in many future-facing industries
But the 2nd reason behind the DXY-yield gap is more worrying
11/ Trump’s tariff policy could shrink global trade volumes
And since most global trade is conducted in dollars, falling trade activity directly reduces demand for dollars
If this happens, the US dollar’s downtrend could become a long-term theme
And since most global trade is conducted in dollars, falling trade activity directly reduces demand for dollars
If this happens, the US dollar’s downtrend could become a long-term theme
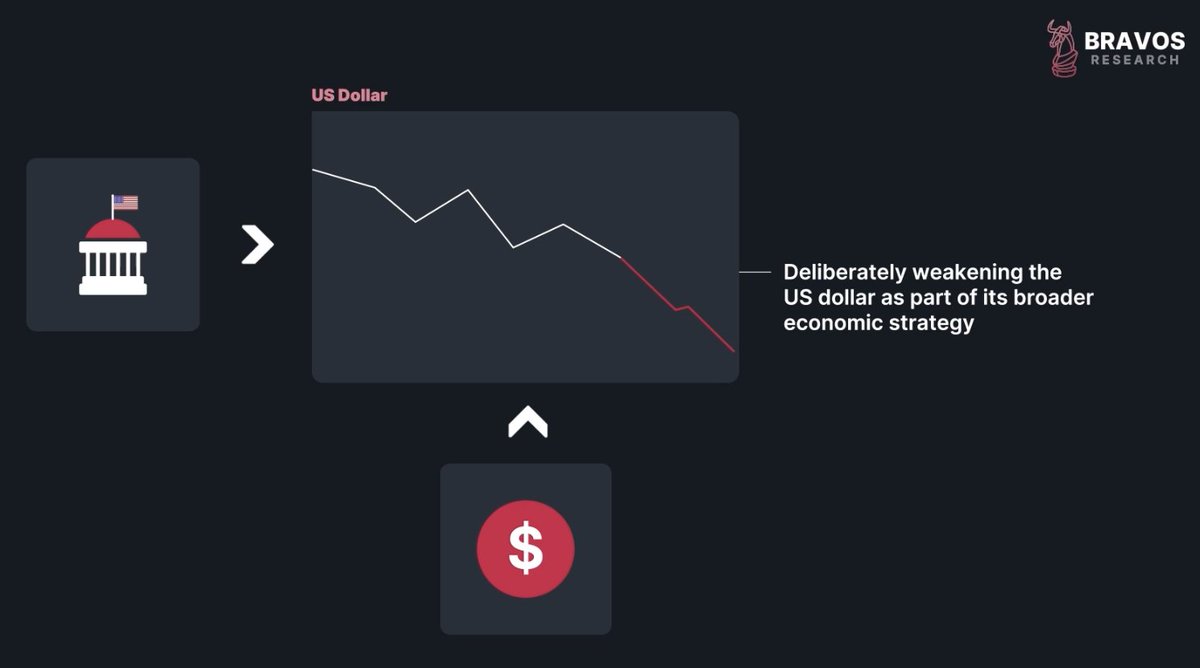
12/ But the biggest factor could be this:
The administration may actually want a weaker dollar
Trump has often said he prefers a weaker dollar to support US industry
A lower dollar boosts exports and helps revive domestic manufacturing
The administration may actually want a weaker dollar
Trump has often said he prefers a weaker dollar to support US industry
A lower dollar boosts exports and helps revive domestic manufacturing
13/ If Trump is actively pushing for a weaker dollar, we could see policies aimed at keeping it suppressed
That’s exactly what happened with the British pound in the 1940s
All of these currency devaluations of the British pound relative to the dollar that we highlighted earlier were driven by 2 root causes
That’s exactly what happened with the British pound in the 1940s
All of these currency devaluations of the British pound relative to the dollar that we highlighted earlier were driven by 2 root causes
14/ First, Britain had a large trade deficit
It wasn’t producing enough domestically
A weaker pound made its goods cheaper and more competitive globally
Which helped stimulate the local economy
It wasn’t producing enough domestically
A weaker pound made its goods cheaper and more competitive globally
Which helped stimulate the local economy

15/ Second, Britain was drowning in debt after WWII
Devaluing the pound made it easier to repay that debt
Since it had been accumulated when the currency was much stronger
Devaluing the pound made it easier to repay that debt
Since it had been accumulated when the currency was much stronger

16/ In short, the UK willingly sacrificed the strength of its currency to fix domestic problems: Debt and trade deficits
And that comparison to today’s US situation might not be as far-fetched as it sounds
And that comparison to today’s US situation might not be as far-fetched as it sounds

17/ We’ve been guiding our clients through this market environment with multiple successful Trades
Achieving 85 winning positions (out of 129) in 2024
With an avg profit of 16.65% and avg loss of just 3.67%
Try our service at:
go.bravosresearch.com/X
Achieving 85 winning positions (out of 129) in 2024
With an avg profit of 16.65% and avg loss of just 3.67%
Try our service at:
go.bravosresearch.com/X
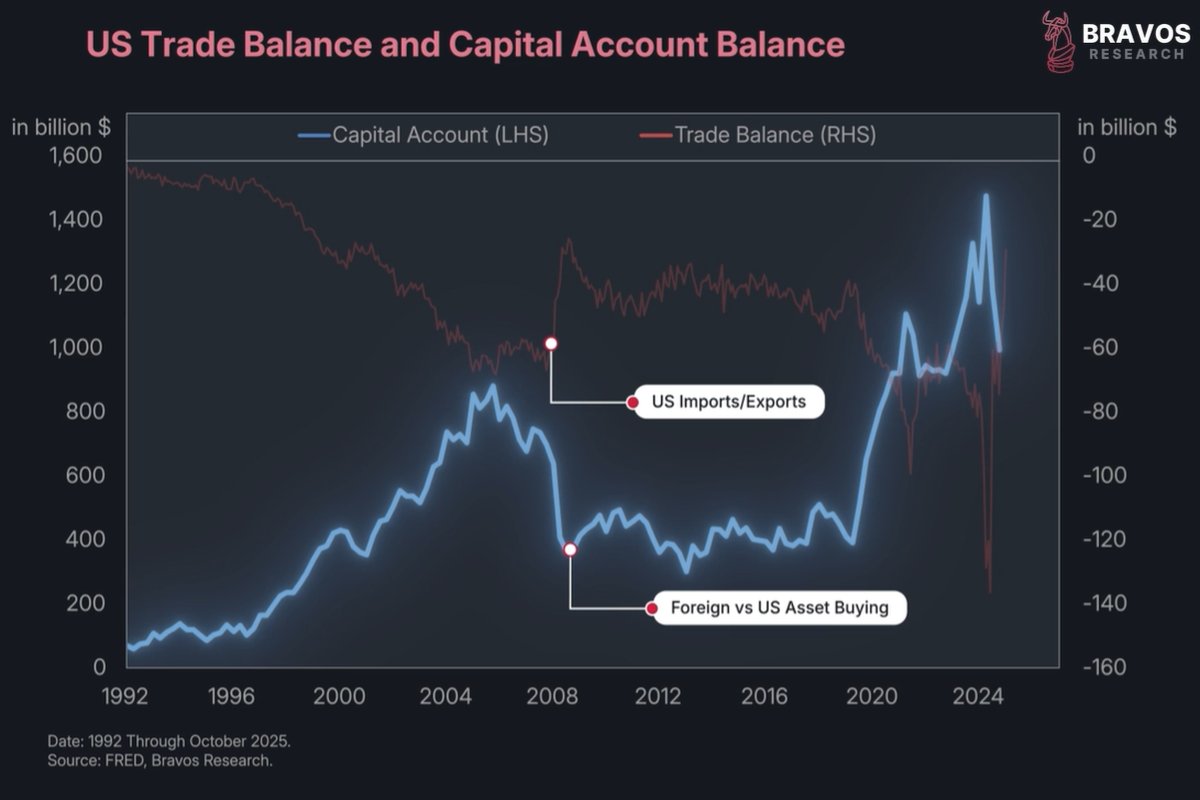
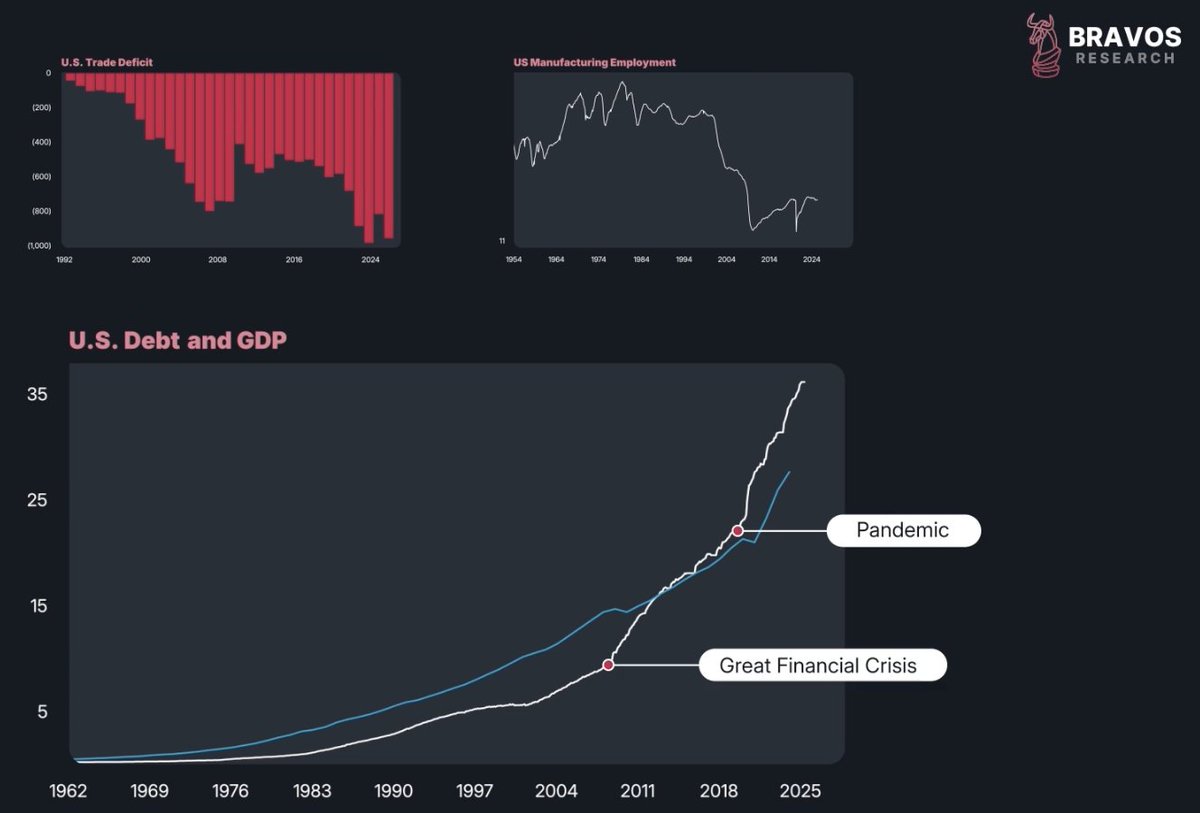
18/ The US trade deficit has ballooned over the past 30 years
Fewer goods are produced at home, and entire sectors, like manufacturing, have been hollowed out
This can be seen by the employment trends in the US manufacturing industry
Fewer goods are produced at home, and entire sectors, like manufacturing, have been hollowed out
This can be seen by the employment trends in the US manufacturing industry

19/ At the same time, US government debt has exploded
America is now one of the most indebted countries in the world
With government liabilities exceeding GDP, and COVID only made it worse
America is now one of the most indebted countries in the world
With government liabilities exceeding GDP, and COVID only made it worse
20/ Ideally, the US should cut spending and raise taxes to fix the deficit
But both are politically painful
The easier path is to let the dollar fall
Which would stimulate growth and make debt cheaper to repay
But both are politically painful
The easier path is to let the dollar fall
Which would stimulate growth and make debt cheaper to repay

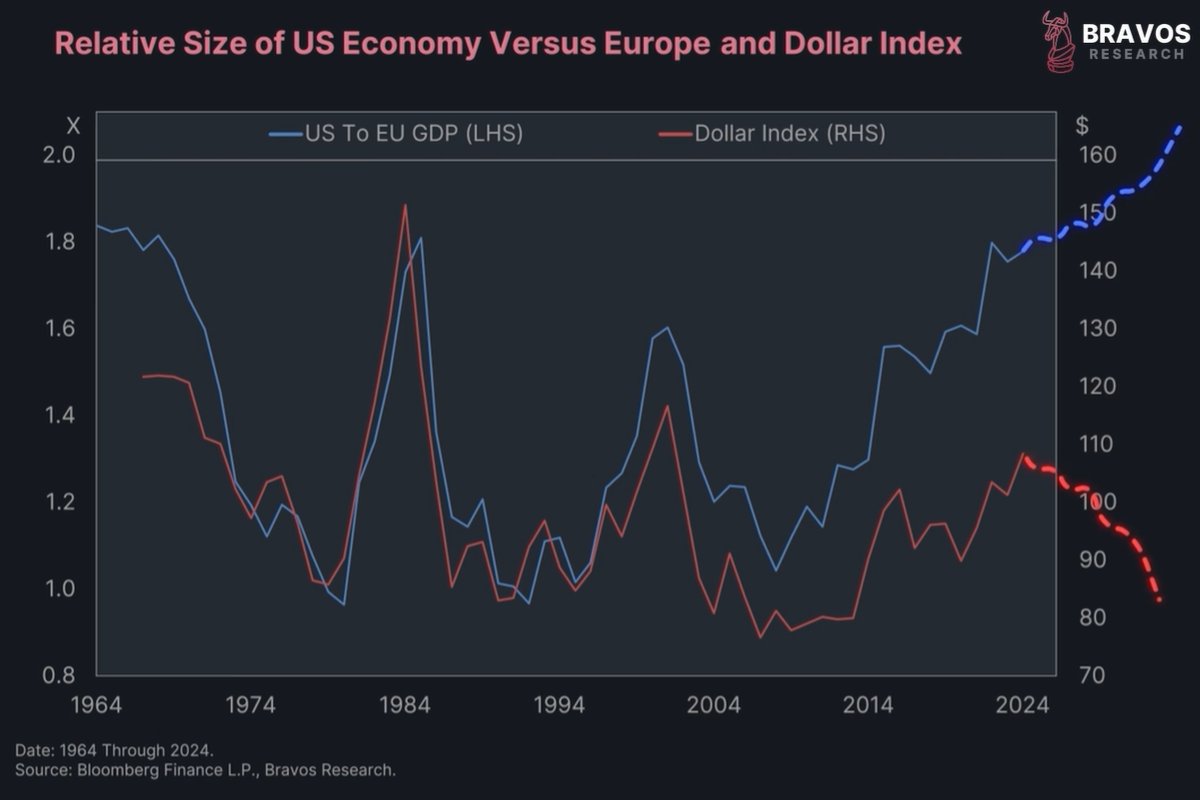
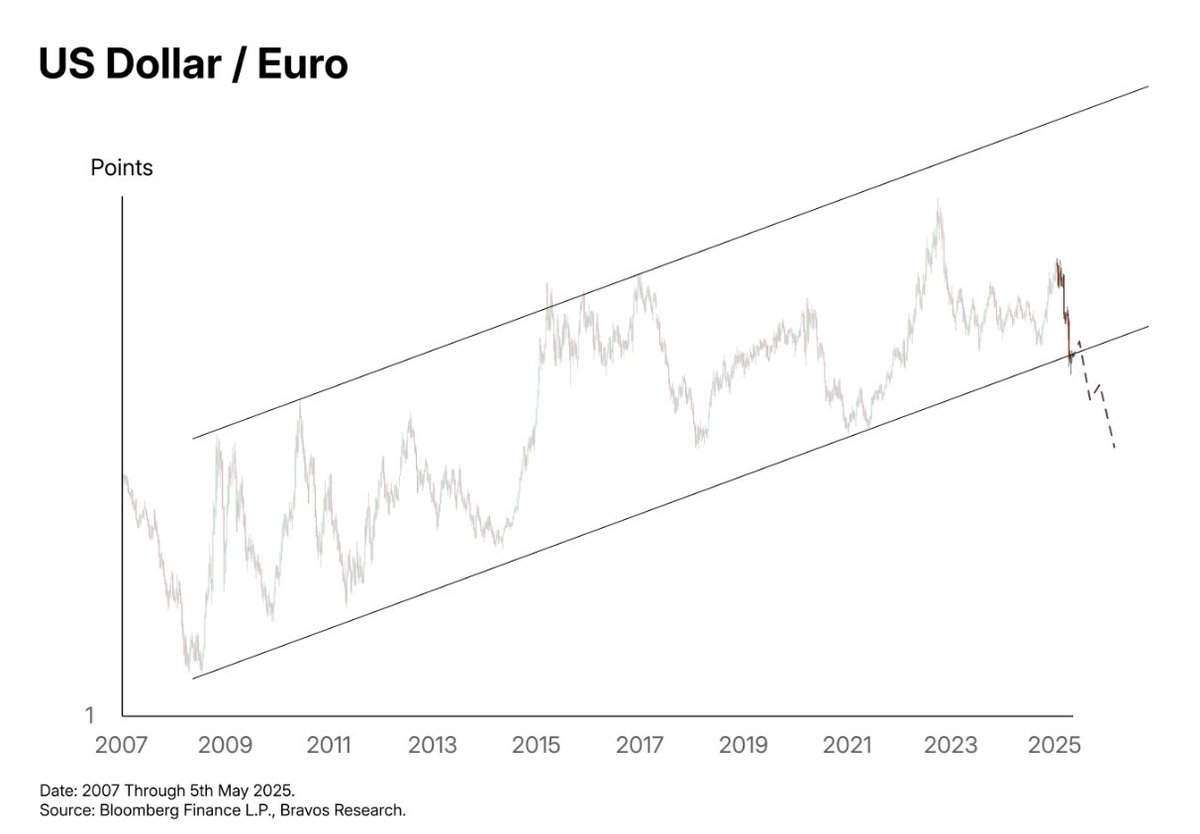
21/ Technically, the dollar is also showing cracks
Its exchange rate against the euro, one of the key components of DXY, has broken below a long-term uptrend that started in 2008
That’s a serious breakdown
Its exchange rate against the euro, one of the key components of DXY, has broken below a long-term uptrend that started in 2008
That’s a serious breakdown
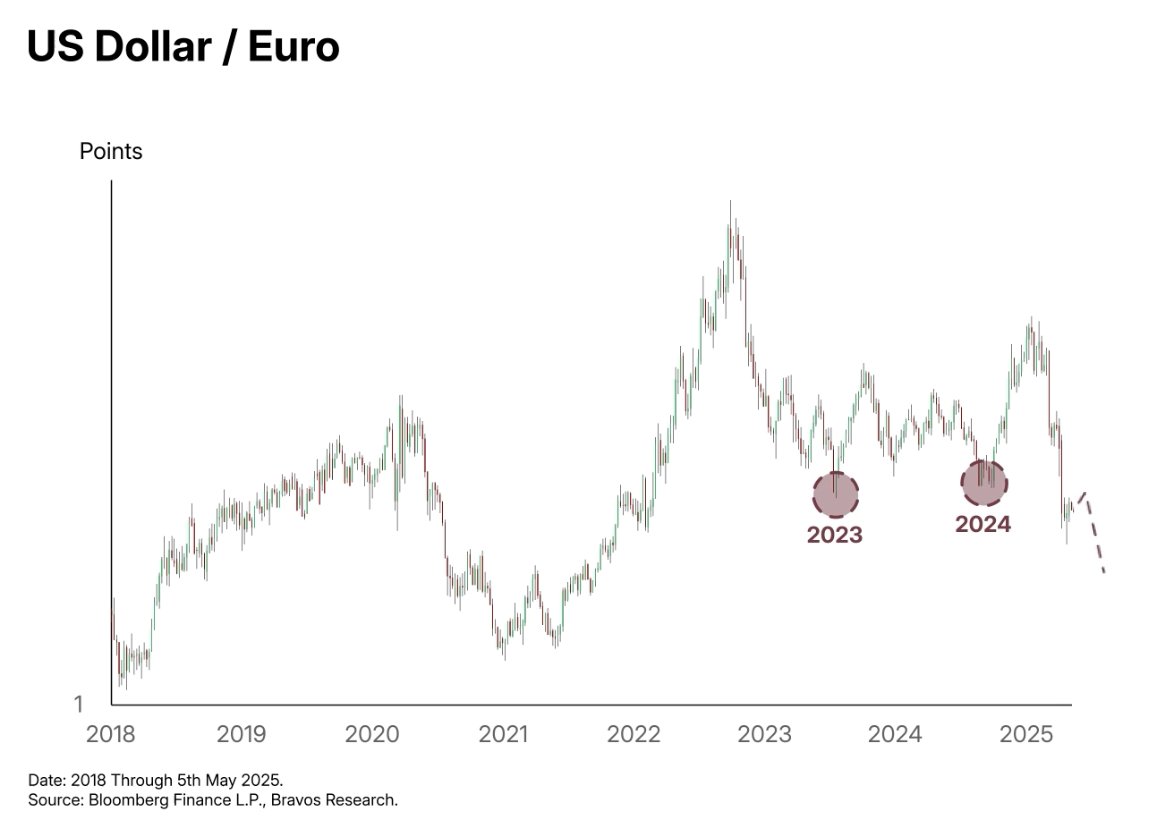
22/ We weren’t bullish on the dollar during the dips in ‘23 and ‘24
Today, we’re not convinced it can recover like before though
That said, nothing is guaranteed
If you’re trading the dollar, manage your risk carefully
Today, we’re not convinced it can recover like before though
That said, nothing is guaranteed
If you’re trading the dollar, manage your risk carefully
23/ If you’re sitting on a lot of US dollars and concerned about a decline, there are steps you can take
This isn’t financial advice, just educational
First, diversify your currency exposure
You don’t need to keep all your cash in USD
This isn’t financial advice, just educational
First, diversify your currency exposure
You don’t need to keep all your cash in USD

24/ One option is the Swiss franc
It doesn’t offer much yield
But it has a strong history of holding value vs. the dollar
Switzerland has very low government debt
Which supports long-term currency strength and investor confidence
It doesn’t offer much yield
But it has a strong history of holding value vs. the dollar
Switzerland has very low government debt
Which supports long-term currency strength and investor confidence

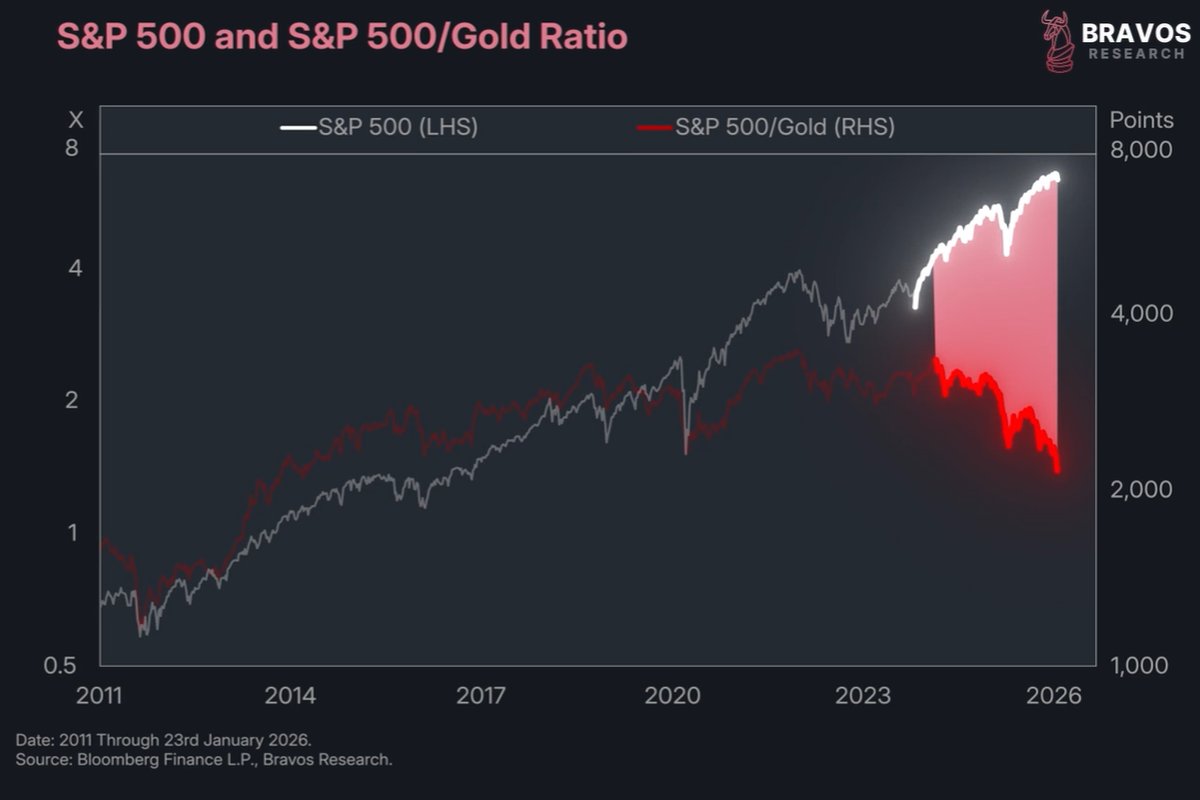
25/ The second option: Own assets
If the dollar weakens, things like housing, stocks, oil, gold, and Bitcoin should benefit
In fact, we just released a video on how Bitcoin fits into the current macro setup:
If the dollar weakens, things like housing, stocks, oil, gold, and Bitcoin should benefit
In fact, we just released a video on how Bitcoin fits into the current macro setup:
26/ Our members have seen solid returns in the past year
With an avg. win of 16.65% and an avg. loss of just 3.67%
View our track record for FREE at:
go.bravosresearch.com/X
With an avg. win of 16.65% and an avg. loss of just 3.67%
View our track record for FREE at:
go.bravosresearch.com/X
27/ Thanks for reading!
If you enjoyed this thread, please ❤️ and 🔁 the first tweet below
And follow @bravosresearch for more market insights, finance and investment strategies
If you enjoyed this thread, please ❤️ and 🔁 the first tweet below
And follow @bravosresearch for more market insights, finance and investment strategies
https://x.com/bravosresearch/status/1921960892293374085
• • •
Missing some Tweet in this thread? You can try to
force a refresh