New tariff update today from @The_Budget_Lab incorporating
1. Today's announcement of lower US-China tariffs (10% instead of 125% reciprocal tariffs);
2. The May 8 US-UK trade deal; and,
3. The April 29 auto tariff rebate announcement.
Some high level takeaways:
1/13
1. Today's announcement of lower US-China tariffs (10% instead of 125% reciprocal tariffs);
2. The May 8 US-UK trade deal; and,
3. The April 29 auto tariff rebate announcement.
Some high level takeaways:
1/13
@The_Budget_Lab • In broad strokes, the lower China tariffs announced today have 2 main effects, assuming they stay in place:
1. They reduce the economic damage of 2025 tariffs by 40% (judged by price & GDP);
2. They raise $300bn *more* over 10Y, showing how suboptimal 145% was.
2/13
1. They reduce the economic damage of 2025 tariffs by 40% (judged by price & GDP);
2. They raise $300bn *more* over 10Y, showing how suboptimal 145% was.
2/13
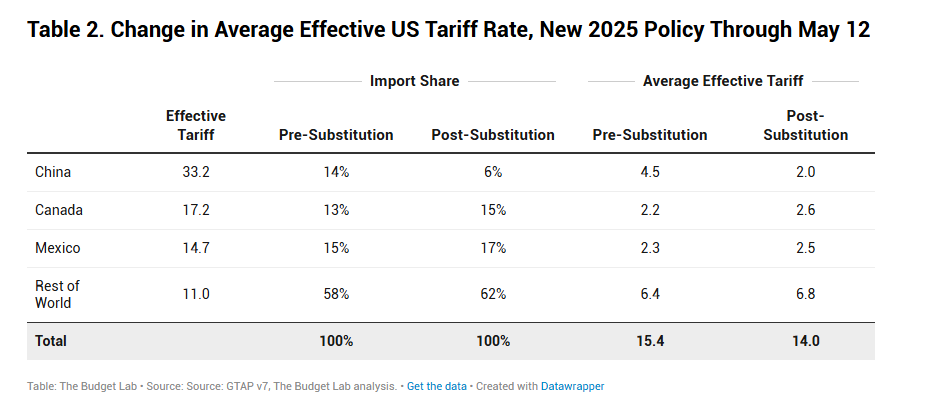
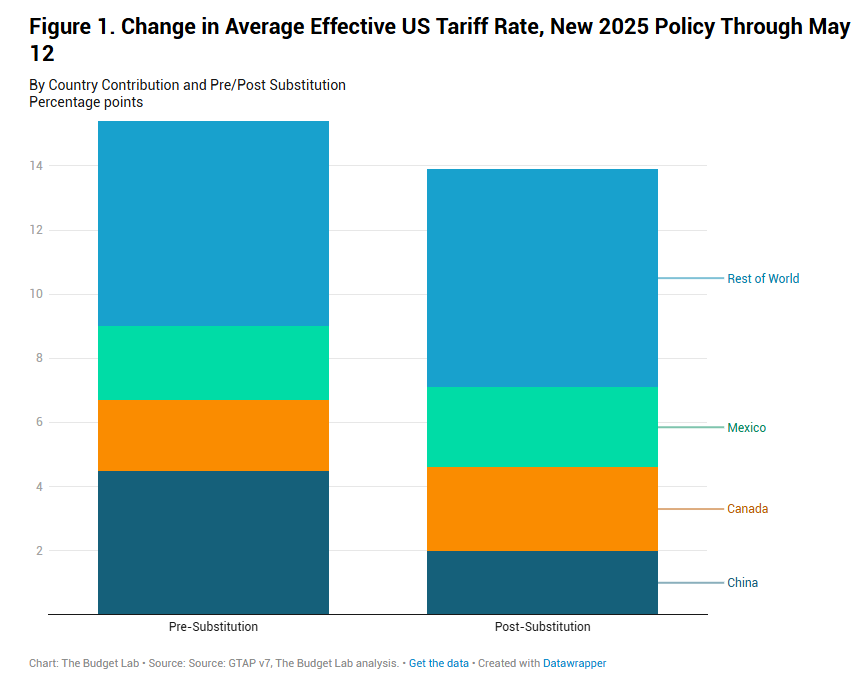
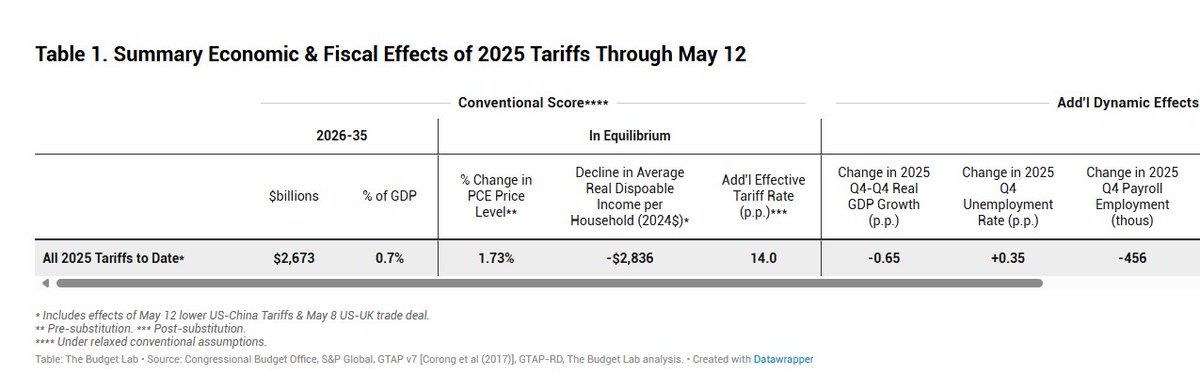
@The_Budget_Lab • The current US average effective tariff rate is now 17.8% pre-substitution, highest since 1934. Post-substitution, it's 16.4%, the highest since 1937. Virtually all of the fall since our April 15 report is due to the lower China tariffs; the US-UK deal has little effect.
3/13
3/13

@The_Budget_Lab • The difference between the pre- and post-substitution average tariff rates is because the new 30% China tariff still causes China's share of US imports to contract meaningfully, from 14% to 6%, as businesses & consumers substitute away from Chinese goods.
4/13
4/13
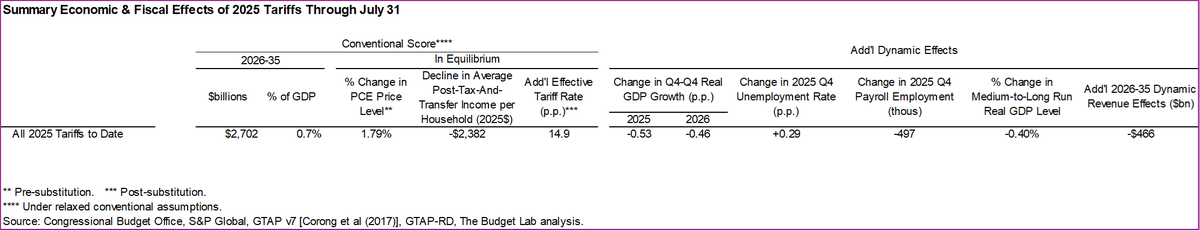
@The_Budget_Lab • The PCE price level rises by 1.7% pre-substitution assuming no Fed response. This is the equivalent of a loss in purchasing power of $2,800 per household per year in 2024$.
• Post-substitution, prices rise 1.4%, a $2,300 average loss.
5/13
• Post-substitution, prices rise 1.4%, a $2,300 average loss.
5/13
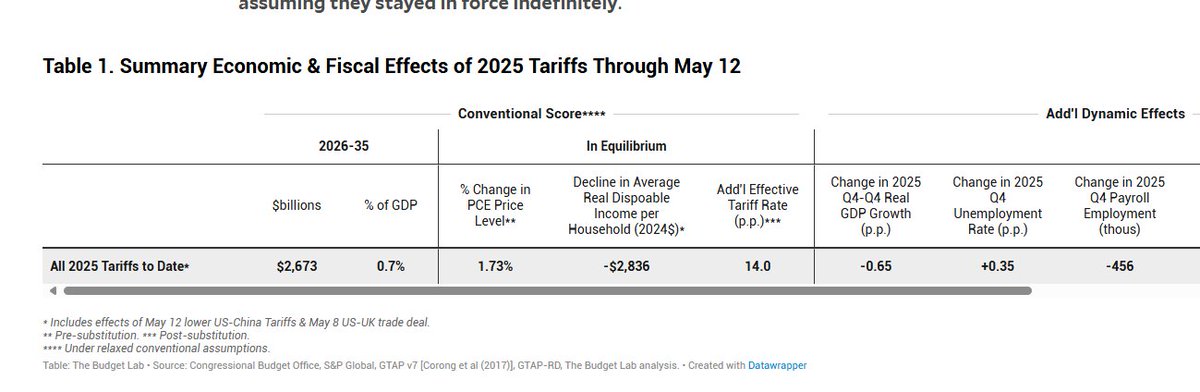
@The_Budget_Lab • US real GDP growth over 2025 is 0.7pp lower.
• The unemployment rate is 0.4pp higher in 2025 Q4, and employment is -456K lower.
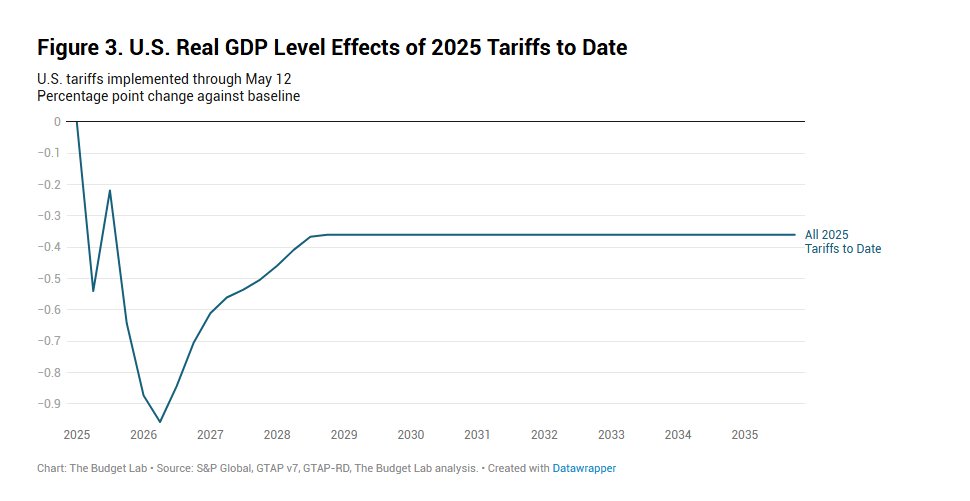
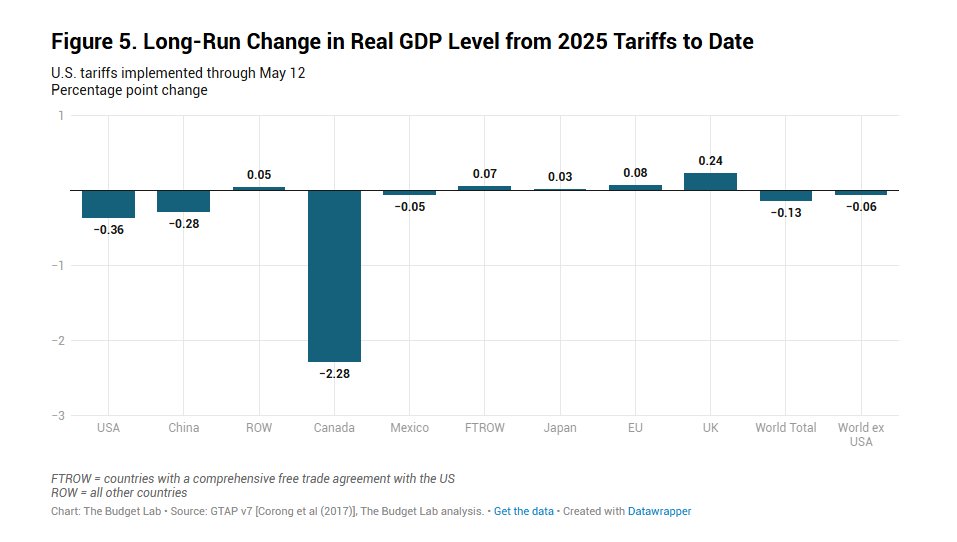
• In the long-run, US real GDP is -0.4% smaller in level terms, the equivalent of a $110bn loss in 2024$ each year every year.
6/13
• The unemployment rate is 0.4pp higher in 2025 Q4, and employment is -456K lower.
• In the long-run, US real GDP is -0.4% smaller in level terms, the equivalent of a $110bn loss in 2024$ each year every year.
6/13
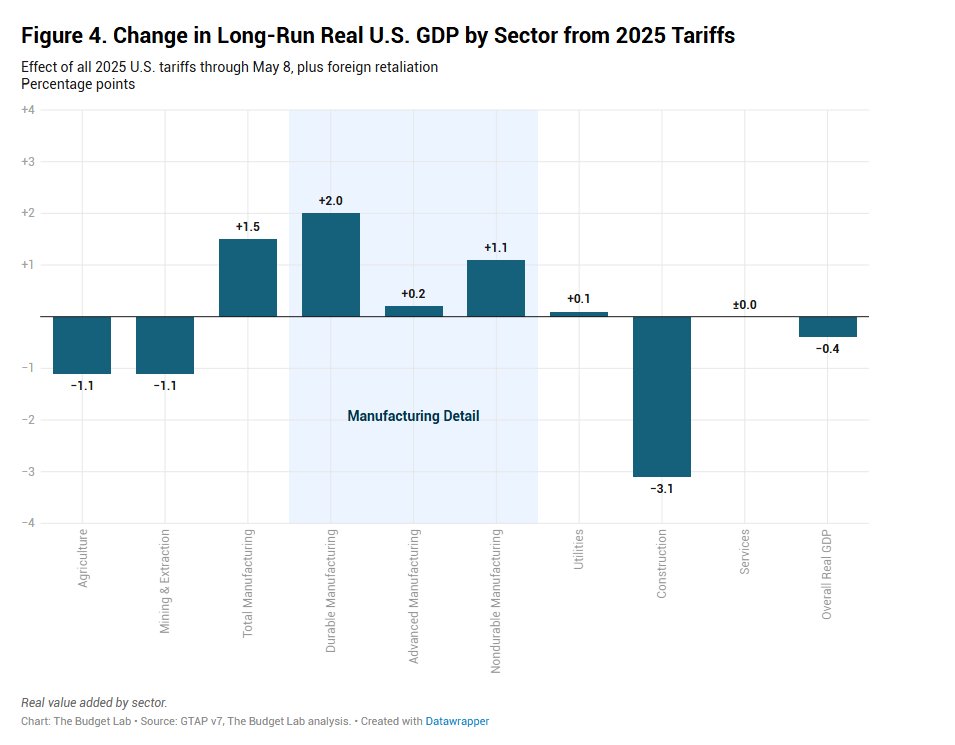
@The_Budget_Lab • In the long-run, tariffs present a tangible trade-off for the US economy. US manufacturing output expands by 1.5%, but this more than crowds out other sectors: construction output contracts by 3.1% and agriculture declines by 1.1%. Overall GDP is 0.4% smaller.
7/13
7/13
@The_Budget_Lab • All tariffs to date in 2025 raise $2.7 trillion over 2026-35, with $394 billion in negative dynamic revenue effects. This is $300 billion more than under the higher 145% China tariffs, showing how far from revenue-optimal levels those rates were.
8/13
8/13
@The_Budget_Lab • Canada bears the brunt of the damage from US tariffs, with its long-run economy -2.3% smaller in real terms (reflecting both US tariffs and Canadian retaliation to date). China’s economy is -0.3% smaller, almost as large as the hit to the US.
9/13
9/13
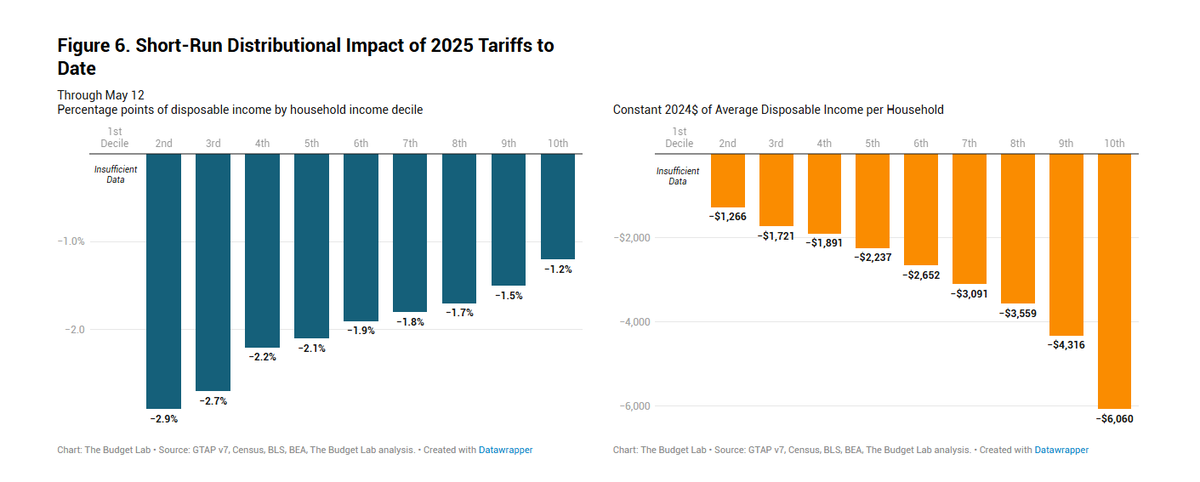
@The_Budget_Lab • Tariffs are a regressive tax, especially in the short-run. The burden on the 2nd decile is 2.5x that of the top decile (-2.9% versus -1.2%). The average annual cost to households in the 2nd, 5th, and top decile rise to $1,300; $2,200; and $6,100 respectively.
10/13
10/13
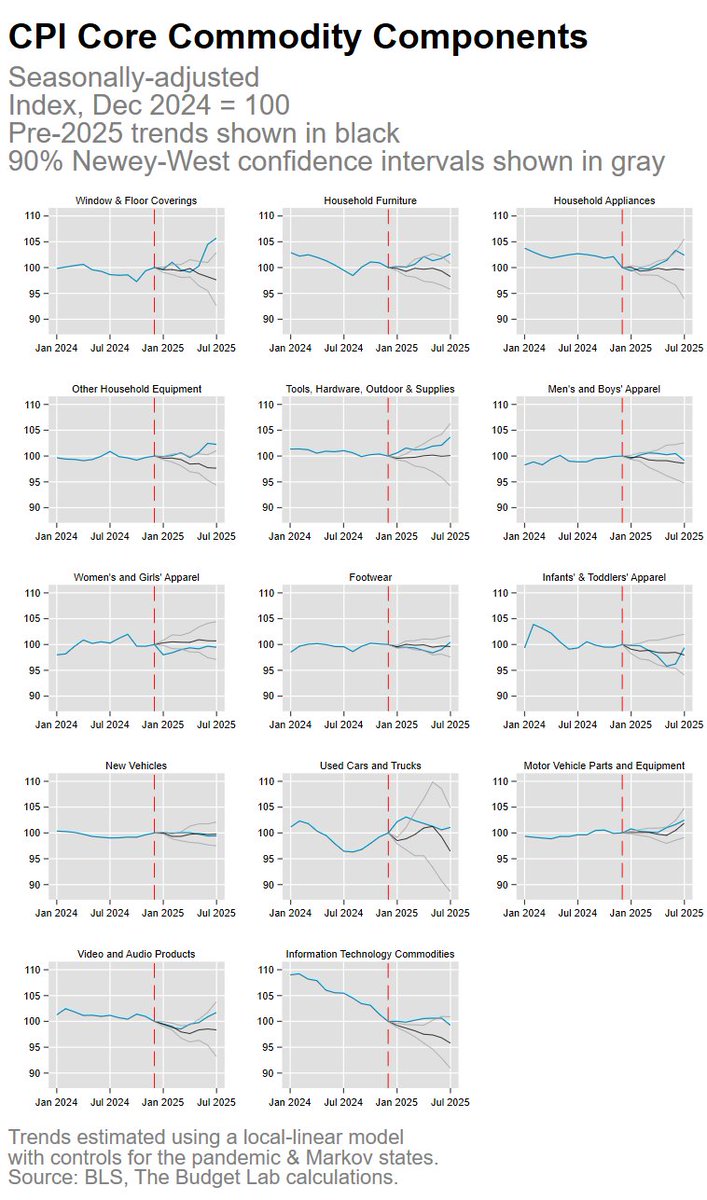
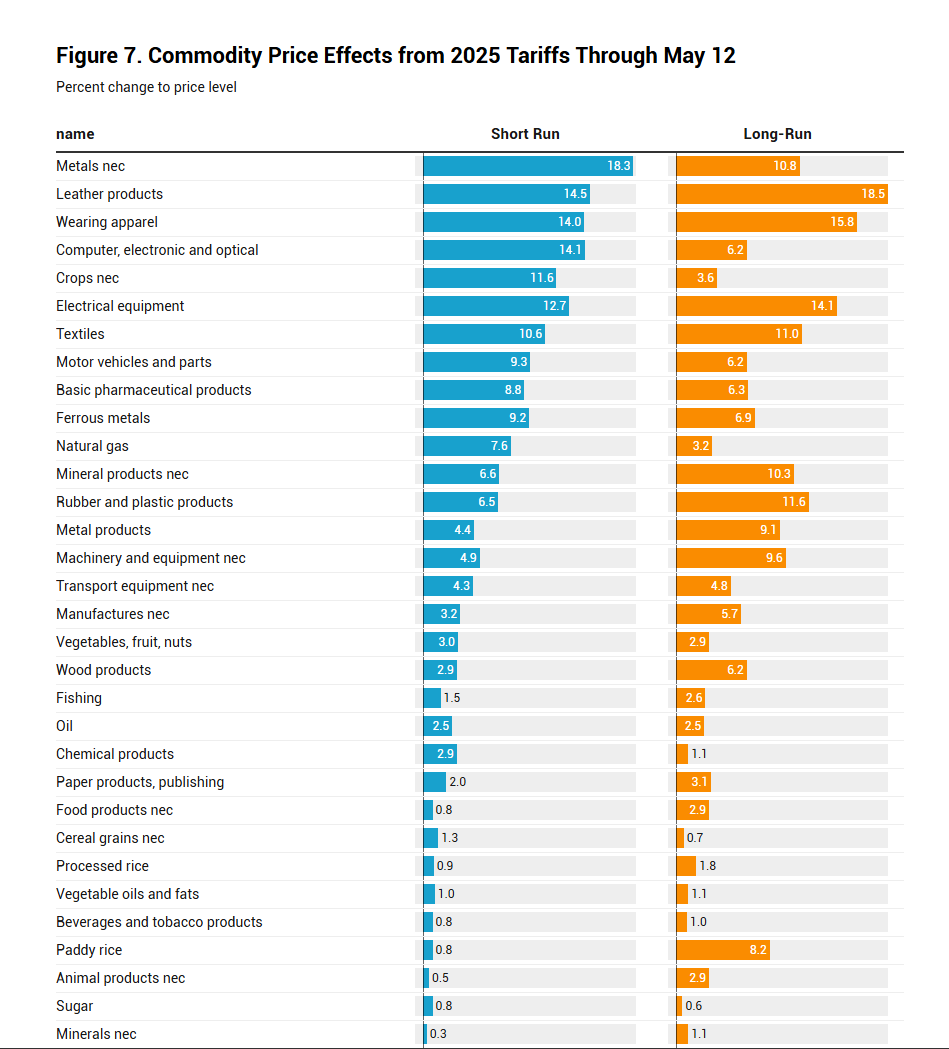
@The_Budget_Lab • The 2025 tariffs disproportionately affect clothing and textiles, with consumers facing 15% higher shoe prices and 14% higher apparel prices in the short-run. Shoes and apparel prices stay 19% and 16% higher in the long-run respectively.
11/13
11/13
@The_Budget_Lab • Without the lower China tariffs—but with the US-UK trade deal & auto rebates—the average effective tariff rate would have been 27.6% pre-substitution, the highest since 1903, & prices would have been 2.9% higher in the short-run, a $4,800 per household loss.
12/13
12/13
@The_Budget_Lab Full report here:
13/13budgetlab.yale.edu/research/state…
13/13budgetlab.yale.edu/research/state…
• • •
Missing some Tweet in this thread? You can try to
force a refresh