
Personal account. Chief economist at @Stripe. Former Director of Economics at @The_Budget_Lab. Former Chief Economist at @WhiteHouseCEA.

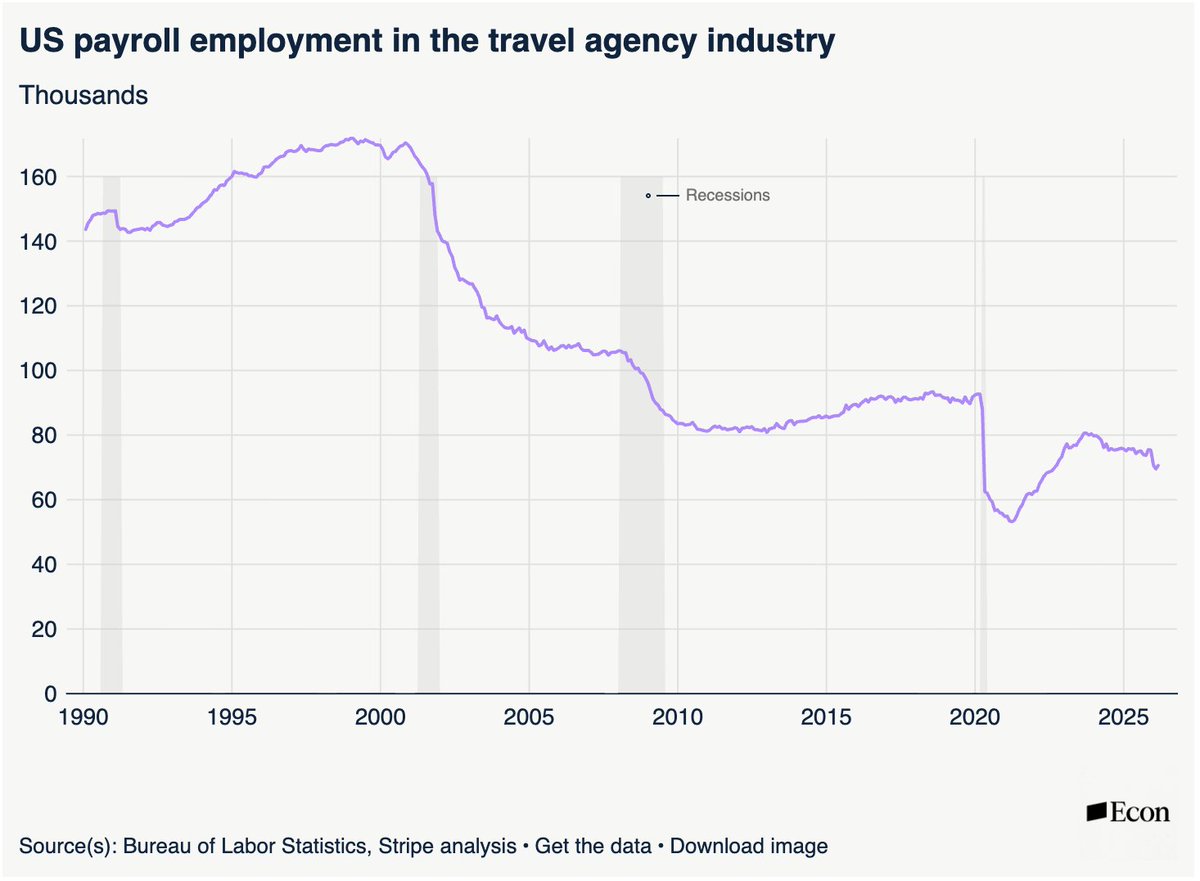 Some background: Between 1980 & 2000, US travel agent jobs tripled to ~340K thanks in part to airline deregulation. Then came a one-two punch: airlines slashed agent commissions, & internet platforms like Expedia let consumers book it themselves. /2
 @The_Budget_Lab TARIFF RATE: The September 25 announcement raises the average effective tariff rate by 0.5pp to 17.9% pre-substitution (as of Oct 1), the highest since 1934. After consumers & businesses shift their spending mix, the post-substitution rate is 16.7%, highest since 1936.


 @The_Budget_Lab Under our all-tariff baseline, consumers face an effective tariff rate of 17.4%, a 15.0pp increase from 2024 & the highest since 1935. After shifts in spending in reaction to the tariffs, the effective tariff rate will be 16.4%, a 13.9pp increase & the highest since 1936


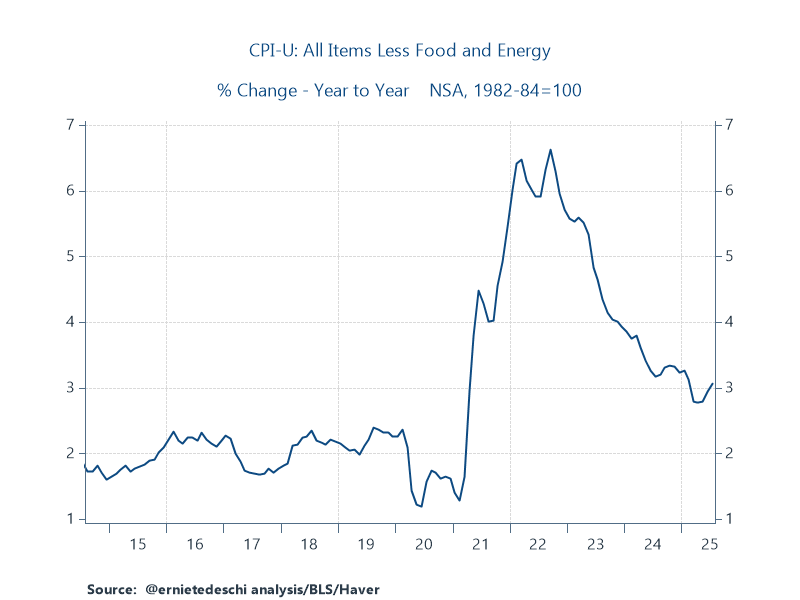 In June, excess monthly core inflation was largely a goods story, in large part driven by tariff price adjustments.
 @The_Budget_Lab Consumers face an overall average effective tariff rate of 18.3%, a 15.9pp increase from 2024 & the highest since 1934. After consumers & businesses shift spending in reaction to the tariffs, the average tariff rate will be 17.3%, a 14.9pp increase & the highest since 1935


 • Consumers face an overall average effective tariff rate of 18.0%, a 15.6pp increase from 2024 & the highest since 1934. After consumers & businesses shift spending in reaction to the tariffs, the average tariff rate will be 16.9%, a 14.5pp increase & the highest since 1935


 • Consumers face an overall average effective tariff rate of 17.6%, a 15.2pp increase from 2024 & the highest since 1934. After consumers & businesses shift spending in reaction to the tariffs, the average tariff rate will be 16.5%, a 14.1pp increase & the highest since 1936


 * The pre-substitution average effective US tariff rate rises from 15.4% now to 19.5%


 1. The proposal raises PCE prices by 0.76% pre-substitution (full retaliation & no Fed offset). That's the equivalent of a $1,250 per household loss in purchasing power on average in 2024$.
 This is a treading water jobs report at 114K, which is almost exactly the number of jobs we mechanically need to add to keep up with the labor force.
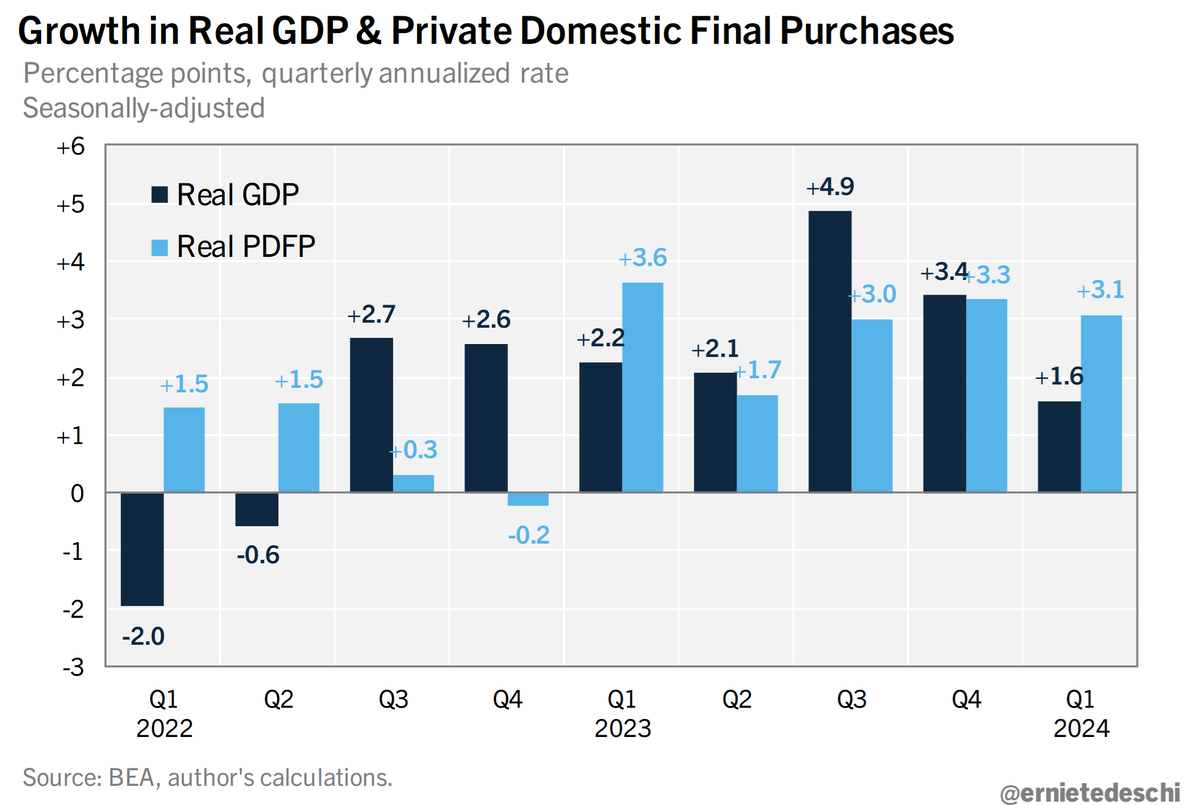 The chart below shows how much broad components of GDP contributed to grown in Q1, 2023 Q4, and on average over 2017-19. You can see the significant swing in exports. Goods consumption also cooled a bit. Services consumption and residential investment firmed.

 This was a strong report, and both surveys were aligned. Payroll employment grew 303K in March, with +22K net revisions. The 3M mov avg is now +276K.

 Misclassification may have pushed the unemployment rate to be up to 6.7% rather than the official 6.2%.