
Unmentioned by the government, by health media, by doctors, by wellness commentators, by anyone, there has been an >astonishing< change in the underlying causes of deaths in the UK.
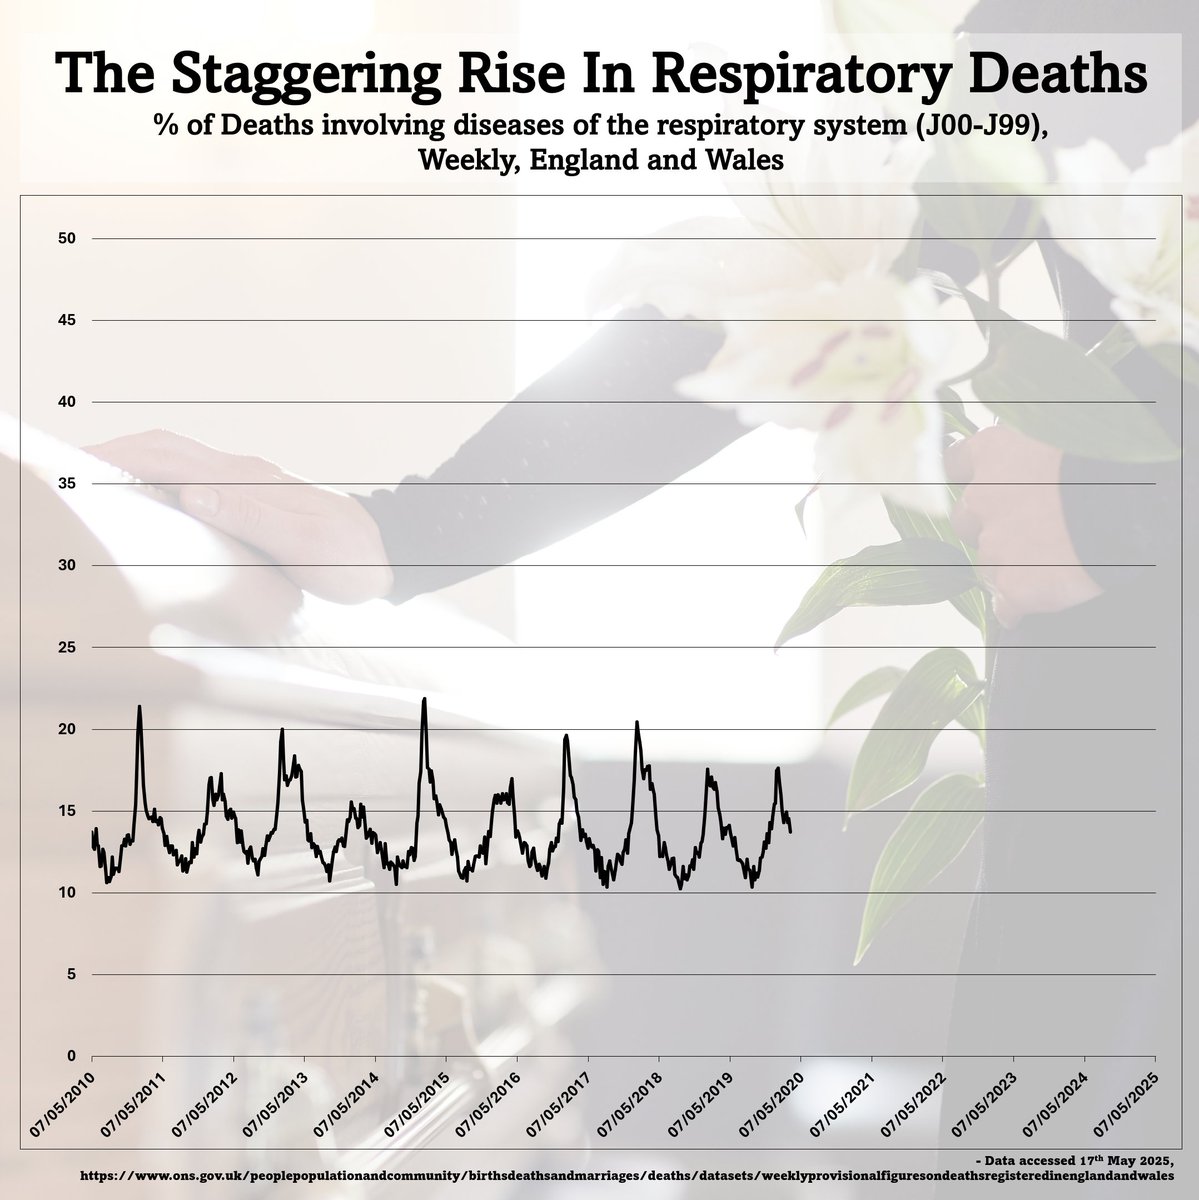
This is the proportion of each week's deaths in the UK that involved 'a disease of the respiratory system' in the years leading up to Covid's arrival. 

That graph comes from data provided by the UK government to track the causes of deaths.
Specifically, it's the percentage of "Deaths involving diseases of the respiratory system (J00-J99)" each week out of all deaths each week from 2010 to the start of 2020.
The codes J00-J99 come from the ICD-10 system, used worldwide to classify diseases, and cover all illnesses affecting the lungs and breathing, such as pneumonia, asthma and COPD.
You can see that before Covid arrives, the proportion is about 10-20% of all deaths involve a respiratory disease.
What's going to happen when Covid arrives?
Well, you can guess already, because the graph is so much taller...
Well, you can guess already, because the graph is so much taller...
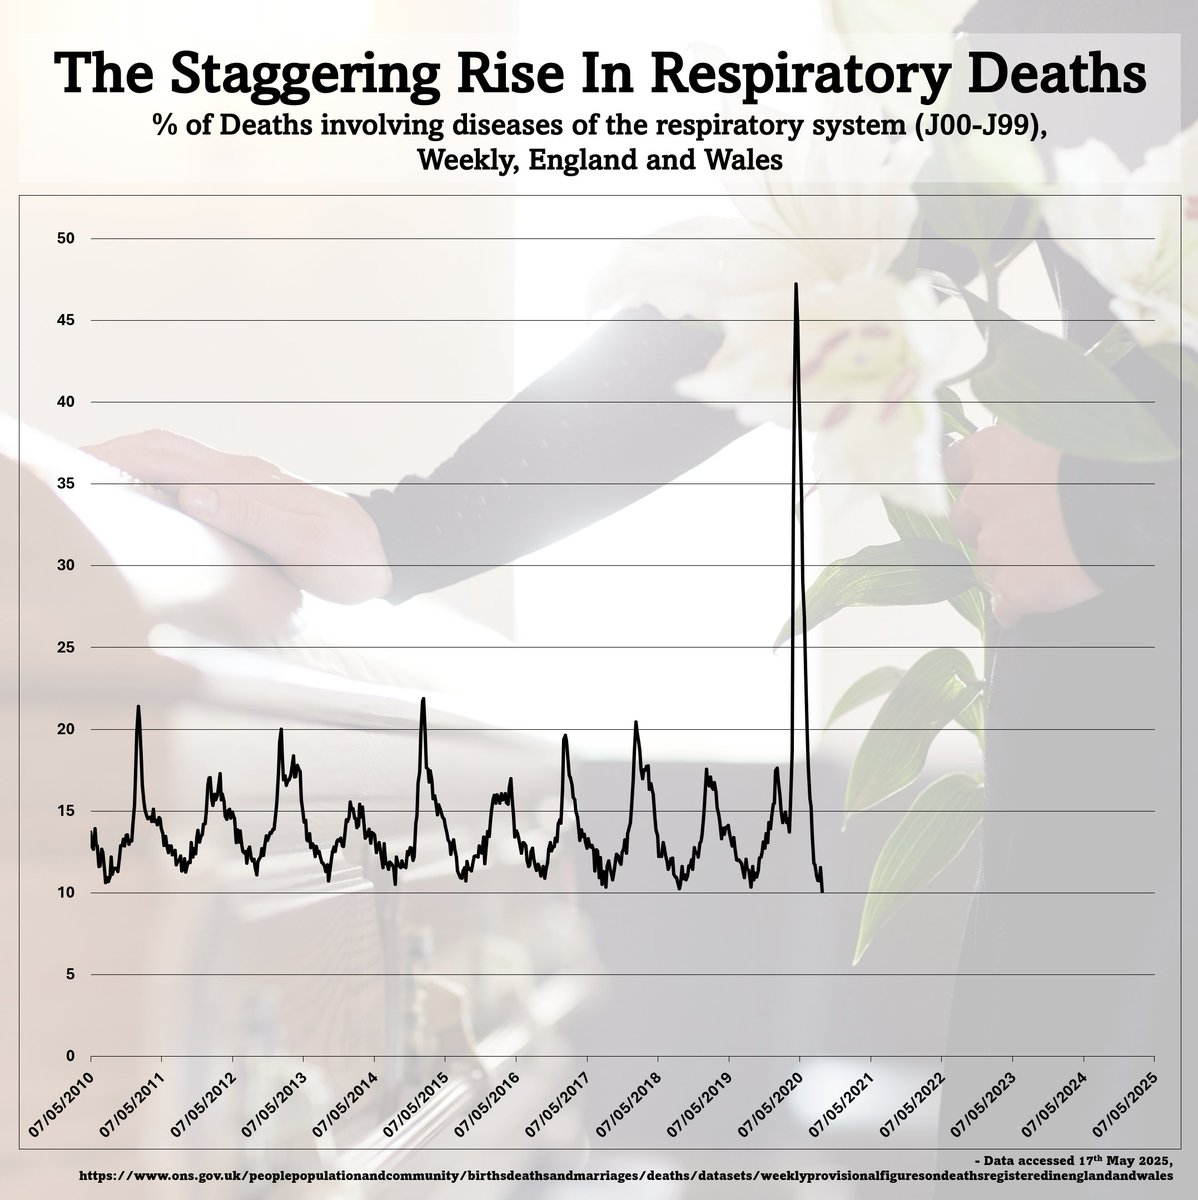
You can *definitely* guess the first stage, because you know that Covid infections killed *a lot* of people in that first wave in 2020.
Covid arrives, and the first wave causes a jump in the weekly percentage from the pre-pandemic range of 10-20% of all deaths all the way up to 47% of all deaths.

But there's a *very important* thing to note here.
It *returns back to the baseline* after that first wave.
It *returns back to the baseline* after that first wave.
That's really important to note.
Not everyone had been infected at this stage.
There were a lot of deaths, but only because the disease was so vicious.
Not everyone had been infected at this stage.
There were a lot of deaths, but only because the disease was so vicious.
And the widespread damage to people's bodies hadn't happened yet on a population wide level.
And the arrival of Covid didn't cause a change in the way the deaths were recorded.
When the second huge wave started to retreat, there might have been the expectation that the proportion of all deaths that were respiratory deaths might decrease again to baseline levels...

But, no.
That was the point at which everyone was *encouraged* to catch Covid.
That was the point at which everyone was *encouraged* to catch Covid.
That was the point at which infection and then reinfection became *commonplace*.
It's at this point that the *damage to the respiratory system* got baked in.
If I made this into a thread about the way Covid infections damage your respiratory system, this would be a ridiculously long thread, and I have work to go and do.
But Covid infections damage your respiratory system in *a lot* of ways.
And what's more...
Covid infections damage your ability to fight off *other respiratory infections*.
Covid infections damage your ability to fight off *other respiratory infections*.
And so, from the point at which Covid was allowed to totally run rampant, diseases of the respiratory system became a factor in an astonishing 30% or more of deaths.

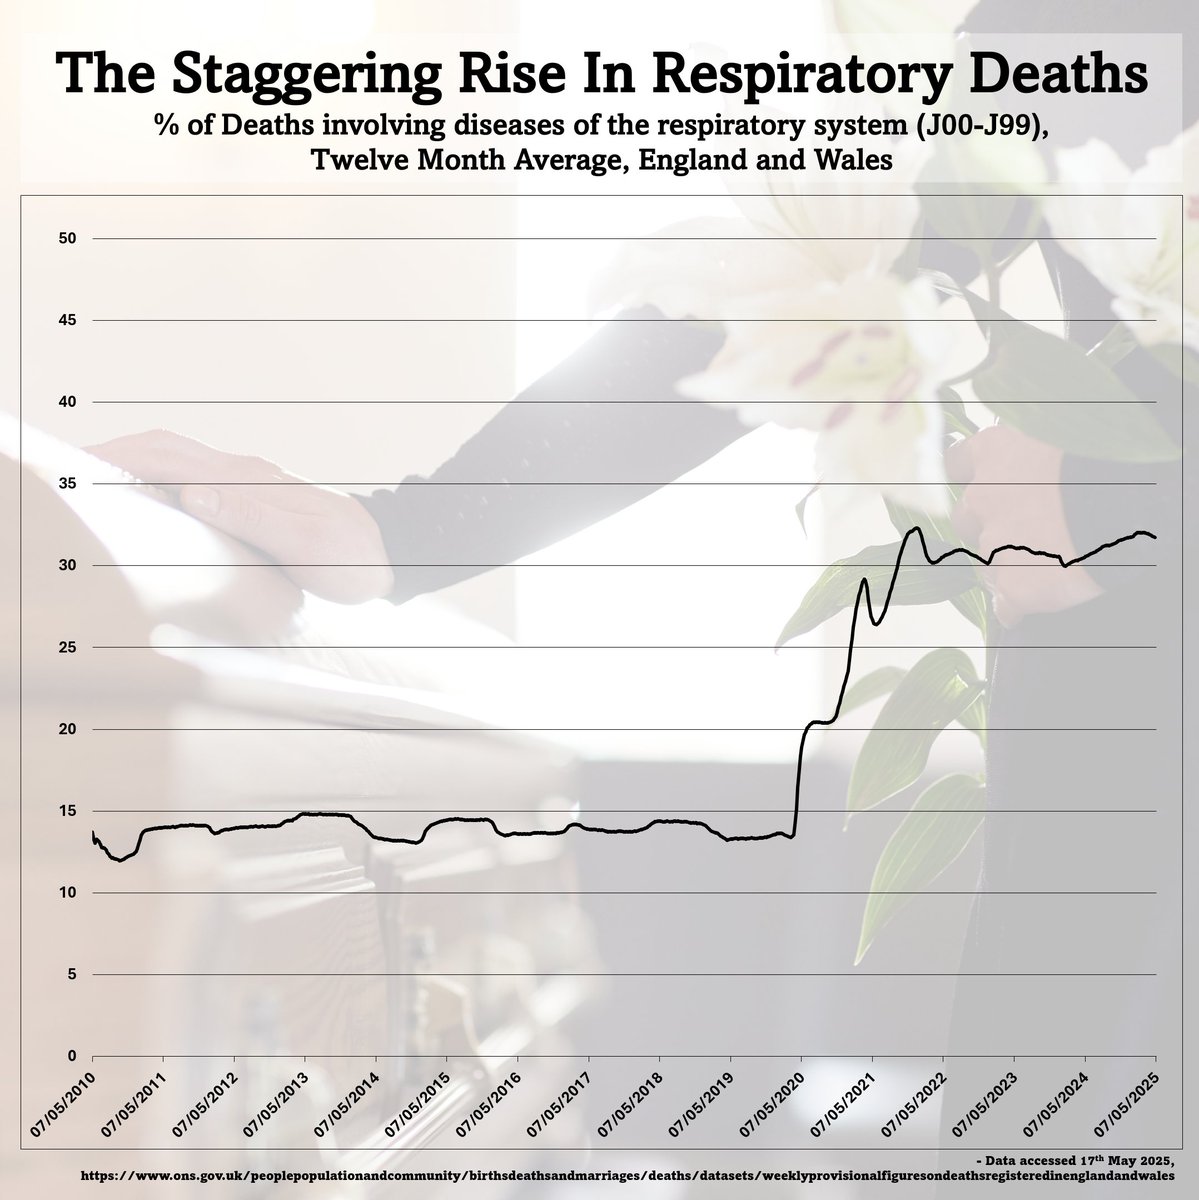
Now that's the weekly data, and the jagged line sometimes makes it a little harder to see a trend that is taking place over time.
So here's the same information, but smoothed out over a six month average, and a twelve month average:


Look at the annual average one...
You see how the last year is actually *worse* than the previous two?
You see how the last year is actually *worse* than the previous two?
So...
I was asked about what these conditions cover.
Here they are with whether or not covid infections are known to make them worse:
Here they are with whether or not covid infections are known to make them worse:
J00 Acute nasopharyngitis (common cold)✅
J01 Acute sinusitis✅
J02 Acute pharyngitis✅
J03 Acute tonsillitis✅
J04 Acute laryngitis and tracheitis✅
J05 Acute obstructive laryngitis (croup), epiglottitis✅
J06 Other acute upper respiratory infections✅
J01 Acute sinusitis✅
J02 Acute pharyngitis✅
J03 Acute tonsillitis✅
J04 Acute laryngitis and tracheitis✅
J05 Acute obstructive laryngitis (croup), epiglottitis✅
J06 Other acute upper respiratory infections✅
J09 Influenza due to avian flu✅
J10 Influenza due to other virus✅
J11 Influenza, virus not identified✅
J12 Viral pneumonia✅
J13 Pneumonia due to Streptococcus pneumoniae✅
J10 Influenza due to other virus✅
J11 Influenza, virus not identified✅
J12 Viral pneumonia✅
J13 Pneumonia due to Streptococcus pneumoniae✅
J14 Pneumonia due to Haemophilus influenzae✅
J15 Bacterial pneumonia (other)✅
J16 Pneumonia due to other infectious organisms✅
J17 Pneumonia in other diseases✅
J18 Pneumonia, unspecified✅
J15 Bacterial pneumonia (other)✅
J16 Pneumonia due to other infectious organisms✅
J17 Pneumonia in other diseases✅
J18 Pneumonia, unspecified✅
J20 Acute bronchitis✅
J21 Acute bronchiolitis✅
J22 Unspecified acute lower respiratory infection✅
J21 Acute bronchiolitis✅
J22 Unspecified acute lower respiratory infection✅
J30 Allergic rhinitis✅
J31 Chronic rhinitis, nasopharyngitis, pharyngitis✅
J32 Chronic sinusitis✅
J33 Nasal polyp✅
J34 Other nose disorders ✅
J31 Chronic rhinitis, nasopharyngitis, pharyngitis✅
J32 Chronic sinusitis✅
J33 Nasal polyp✅
J34 Other nose disorders ✅
J35 Chronic tonsil/adenoid disease✅
J36 Peritonsillar abscess✅
J37 Chronic laryngitis/laryngotracheitis✅
J38 Vocal cord/larynx disease✅
J39 Other upper respiratory disorders✅
J36 Peritonsillar abscess✅
J37 Chronic laryngitis/laryngotracheitis✅
J38 Vocal cord/larynx disease✅
J39 Other upper respiratory disorders✅
J40 Bronchitis, not specified✅
J41Simple/mucopurulent bronchitis✅
J42 Chronic bronchitis, unspecified✅
J43 Emphysema✅
J44 Chronic obstructive pulmonary disease (COPD)✅
J41Simple/mucopurulent bronchitis✅
J42 Chronic bronchitis, unspecified✅
J43 Emphysema✅
J44 Chronic obstructive pulmonary disease (COPD)✅
J45 Asthma✅
J46 Status asthmaticus✅
J47 Bronchiectasis✅
J46 Status asthmaticus✅
J47 Bronchiectasis✅
J60 Coal workers' pneumoconiosis✅
J61 Asbestosis✅
J62 Pneumoconiosis from silica✅
J63 Other inorganic dusts✅
J64 Pneumoconiosis, unspecified✅
J61 Asbestosis✅
J62 Pneumoconiosis from silica✅
J63 Other inorganic dusts✅
J64 Pneumoconiosis, unspecified✅
J65 Pneumoconiosis with TB✅
J66 Airway disease from organic dust✅
J67 Hypersensitivity pneumonitis✅
J68 Chemical/fume inhalation✅
J66 Airway disease from organic dust✅
J67 Hypersensitivity pneumonitis✅
J68 Chemical/fume inhalation✅
J69 Pneumonitis from solids/liquids (aspiration)✅
J70 Drug/radiation-related respiratory conditions✅
J70 Drug/radiation-related respiratory conditions✅
J80 Acute respiratory distress syndrome (ARDS)✅
J81 Pulmonary oedema✅
J82 Pulmonary eosinophilia✅
J84 Other interstitial pulmonary diseases✅
J81 Pulmonary oedema✅
J82 Pulmonary eosinophilia✅
J84 Other interstitial pulmonary diseases✅
J85 Lung abscess and mediastinitis✅
J86 Pyothorax (empyema)✅
J86 Pyothorax (empyema)✅
J90 Pleural effusion✅
J91 Pleural effusion in other diseases✅
J92 Pleural plaque✅
J93 Pneumothorax✅
J94 Other pleural conditions✅
J91 Pleural effusion in other diseases✅
J92 Pleural plaque✅
J93 Pneumothorax✅
J94 Other pleural conditions✅
J95 Postprocedural respiratory disorders✅
J96 Respiratory failure✅
J97 Procedural complications✅
J98 Other specified respiratory disorders✅
J99 Respiratory disorders in other diseases✅
J96 Respiratory failure✅
J97 Procedural complications✅
J98 Other specified respiratory disorders✅
J99 Respiratory disorders in other diseases✅
Which is, of course, all of them.
• • •
Missing some Tweet in this thread? You can try to
force a refresh


