There is no "Maturity Wall" 101.
Though this is a myth you may not be relieved by this thread.
Have you seen the doomer charts about the maturity wall of US Debt. It is a clear signal that you should unfollow those who post it. It usually starts with 9TN of debt comes due.
Notice the huge wall of debt maturities in the last chart. Sometimes the FURU posting the chart will do it monthly. Particularly when trying to suggest the Fed should cut rates to save the FURU's precious bags. Close to 6TN coming due in the next 3 months. OMIGOD PANIC!
Whats going on here? Well to put it simply the US has outstanding as of 4/30 6TN T bills. The distribution of these tbills looks like this. Notice while the graph above does not include it every month 4 week tbills mature and refinance and should be added to the next month.
In fact the Debt wall is all about tbills and has hardly anything to do with coupon maturities. Notice how the orange columns are small and about the same size.
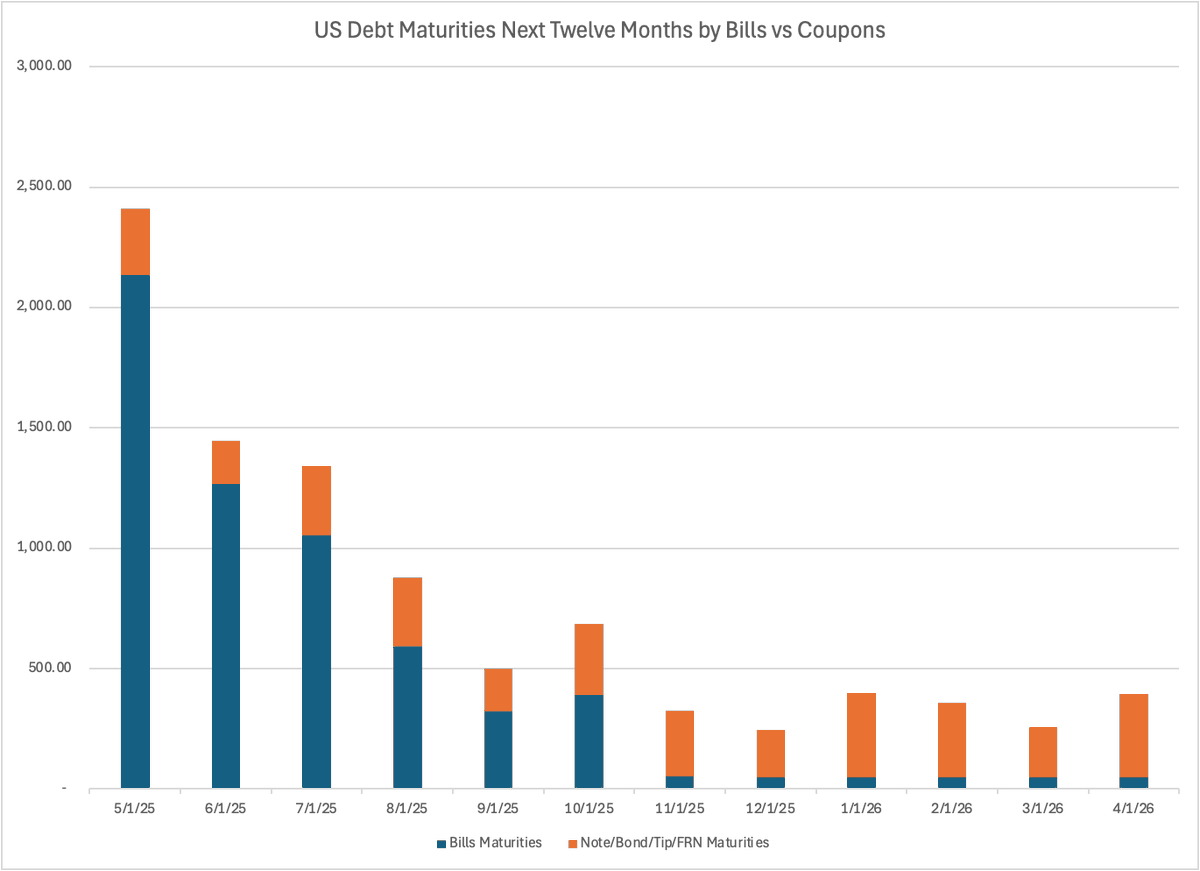
When corrected for the Tbills maturing and rolling each month there is no debt wall. Its a constant mountain of debt rolling which are mostly bills.
So there is no imminent debt wall. Not this year nor any future year. But are you reassured? Looking at that last chart between 2 and 2.5TN of US obligations are auctioned every month (AGAIN MOSTLY BILLS). Is that something to panic about? Almost certainly not.
The holder of the maturing bills, notes, bonds, TIPS, and FRN WANTS to roll. Even if on the margin the holder doesnt want to roll they have to buy something with their maturity proceeds. The seller of that something has to buy something and ultimately the seller buys the
auctioned treasuries. Its a circle of life. The debt gets refinaced because there is no place for the money to go.
The price can change but the circle of life is highly unlikely to break
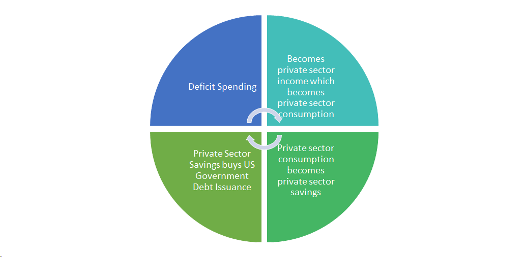
That brings us to another topic not covered. Besides the maturing debt that needs to be rolled an additional pile of new debt is auctioned. That grows the pile by roughly 2TN this year and that adds 166BN per month to the auction pile. Again the circle of life will almost
certainly result in no problems getting the financing. But the price that the Treasury can finance its debt can change. Thats for a different thread. There is no debt wall approaching. For over 3 years the 2-2.5TN of auctions per month have gone mostly fine. They will
likely continue to go fine. Its okay to think that 2-2.5TN is alot but thinking that something new and dangerous is about to happen is simply not true
• • •
Missing some Tweet in this thread? You can try to
force a refresh
Money creation and credit creation in the private sector 101 part 2.
Role of Repo.
In the prior thread I outline credit creation which can happen without banks and money creation which requires banks.
I also hinted at bank reserves role as being one of grease to the
system and NOT necessary for bank money creation but necessary for interbank deposit shifts. I also didn't discuss base money creation from the Fed and won't be dealing with that in this thread either.
Here I will discuss the specific role of Repo in today's financial system
The big takeaway is it is one of many important and necessary means of credit creation AND it has no role in money creation unless a bank is a party to the transaction.
That will take some weedy mechanics to prove. But before we do that let's talk about the entire economy
Money creation and credit creation in the private sector 101
There has been a lot of focus on the repo market lately. I get it. It's an important part of the capital markets in the credit creation process. But its growth and contraction is part of the credit creation process
The repo market where transactions are between hedge funds and money market investors, and those who desire leverage for whatever purpose is an important market in the credit creation process BUT is not part of the money creation process UNLESS a commercial bank or the Fed is
A party to the transaction. Because this is largely misunderstood by even some plumbing experts it's worth it for me to write out my understanding (maybe im wrong which would be awesome so I can learn). So here I go.
I've been studying various versions of balance sheet expansions over my career. I'd classify them as
Japanese first failed effort
UK's version
U.S. Version 1
U.S. version 2
ECB version
Japanese all in version 2
They are all fairly different in approach. The big takeaway 🧵
The developing Fed version that most are excited about is most akin to the Japanese first failed effort.
Here's a rough summary of each
In 2001-2006 Japan the BOJ initiated QE. In their version they offered significant lending to the Japanese banking system for good collateral
The balance sheet doubled in size at a pace of 35 Tn yen per year. However of that 35tn only 5 was direct asset purchase and most of that was Japanese Tbills. This is very similar to the BTFP program from SVB time and the current SRF. It was also sorta similar to ECB LTRO
Why do repo rates change and what do they have to do with reserves. This is a super technical issue and there are better folks to follow on this topic than me but I'll give it a go.
Firstly what are the two sides of a repo transaction and why do they want to interact.
One side is a guy with a bank deposit he wants to earn interest on. The other is a guy who wants to borrow money overnight and has assets he owns that he is willing to provide as collateral to the loan. We can go down a level on each side but for now let's keep it simple.
Most repo transactions are done with UST as the collateral and most UST collatarel used is TBills but. UST's are also highly common collateral but do to the marked to market risk they offer less borrowing capacity per unit of notional (higher haircut)
Some thoughts on 10 year notes since Powell guided for a restart of the cutting cycle at Jackson Hole. Trying to answer what the bond market is saying
Nominal yields have fallen 33bp
Note yields are driven lower by
1)Falling real GDP expectations
2)Falling Inflation expectations 3) Falling "risk" of owning assets 4) Improving supply/demand balance vs expectations.
In attributing nominal yield changes to these 4 things unfortunately market prices don't
Easily demonstrate these things. For instance 3&4 are only able to be measured via a model which estimates risk premiums or the expected return over holding cash
Even Breakeven inflation and real TIPS yields have risk premium buried in there market yields. However we can try
SPX has a trailing earnings yield of 4% with expected 1 year earnings growth of 11.7%. What's the bull case? For me the bull case is a combination of simply collecting the earnings accrual
and having the multiple expand slightly. In that case a 16% return would occur which is roughly 1 std higher and happens 1 out of 6 timer.
The big driver of equity returns is the accrual of earnings. Over the last 5 years earnings accrual has dominated historic returns
As long as companies continue to grow earnings they will go up over the long term.
Multiples rise and fall and as can be seen in the chart can dominate performance of equities in the short term. Furthermore multiples are impacted by interest rates