1/
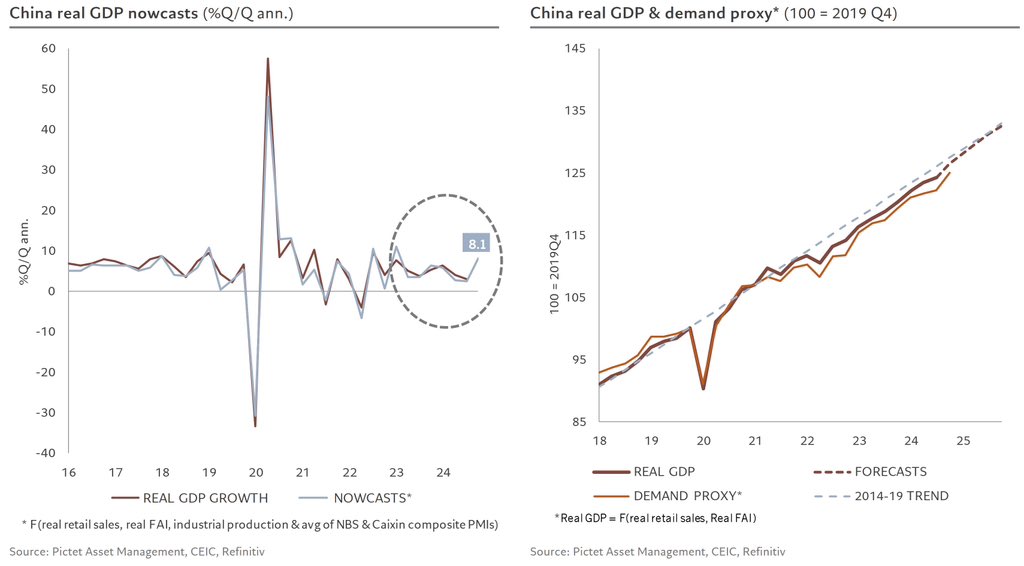
Chinese activity data for April slowed, with most indicators contracting. Our Q2 GDP nowcast shows 3.6% q/q ann. growth, down from 5.9% in Q1. With an average of 4.8% over the first two quarters, the slowdown isn't significant enough to trigger the anticipated fiscal response, especially after recent monetary support.
Chinese activity data for April slowed, with most indicators contracting. Our Q2 GDP nowcast shows 3.6% q/q ann. growth, down from 5.9% in Q1. With an average of 4.8% over the first two quarters, the slowdown isn't significant enough to trigger the anticipated fiscal response, especially after recent monetary support.

2/
On the supply side, industrial production remains 5% above pre-pandemic trends, with slowing growth but still around 7% annualized over the past six months.
On the supply side, industrial production remains 5% above pre-pandemic trends, with slowing growth but still around 7% annualized over the past six months.

3/
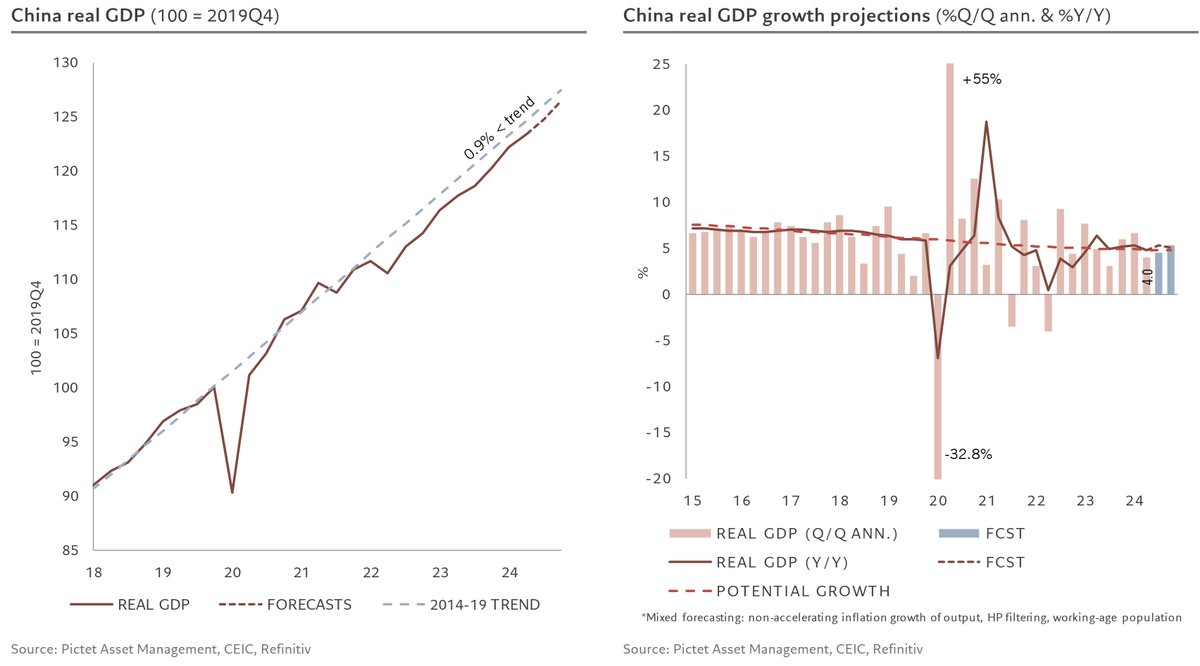
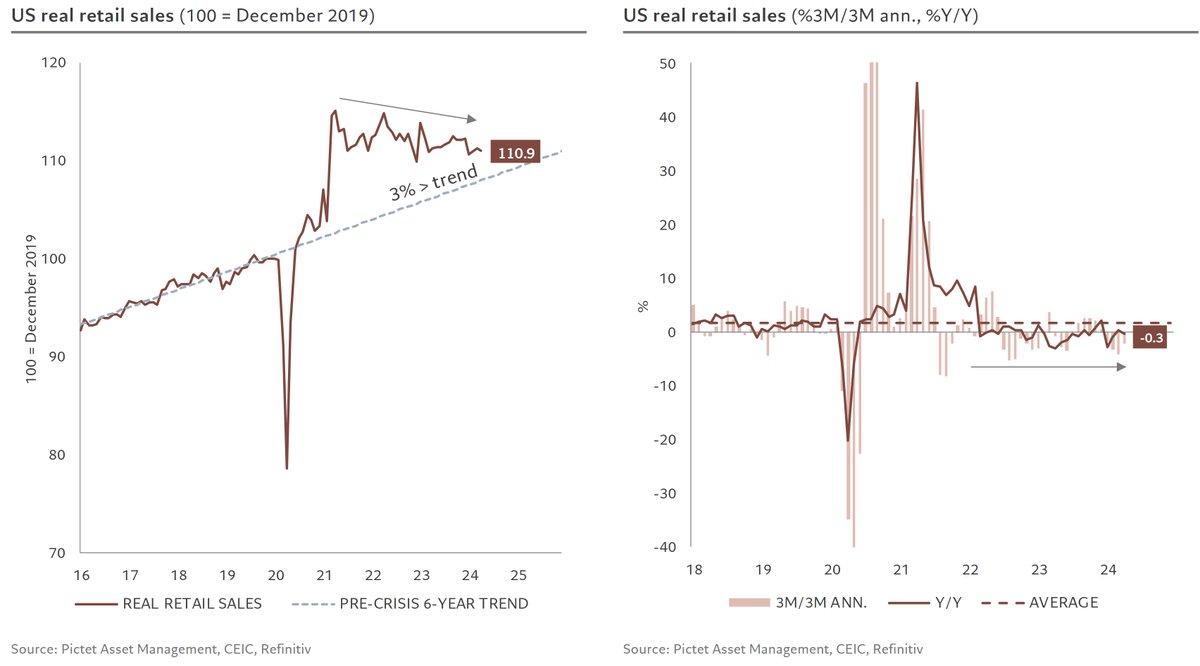
On the demand side, consumption is driven by services (quarterly data), while retail sales fell in April, reducing six-month growth to 5% and maintaining a gap of over 10% from the pre-pandemic trend
On the demand side, consumption is driven by services (quarterly data), while retail sales fell in April, reducing six-month growth to 5% and maintaining a gap of over 10% from the pre-pandemic trend

4/
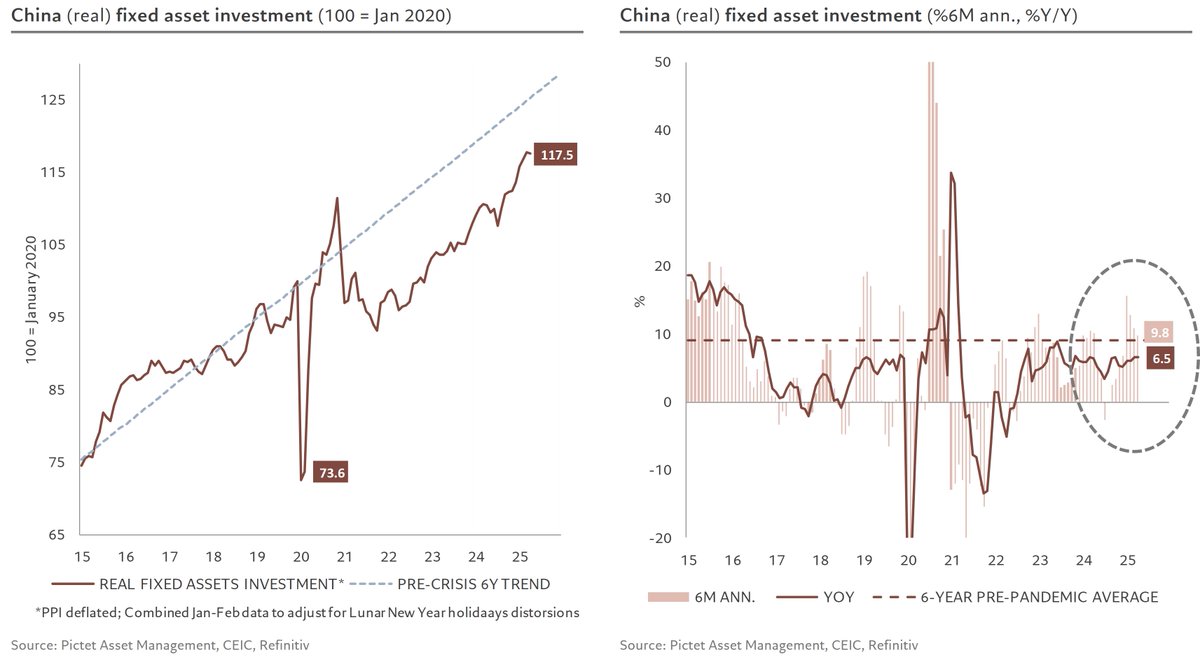
Investment spending also contracted in April but maintained six-month trends, slightly above average…
Investment spending also contracted in April but maintained six-month trends, slightly above average…
5/
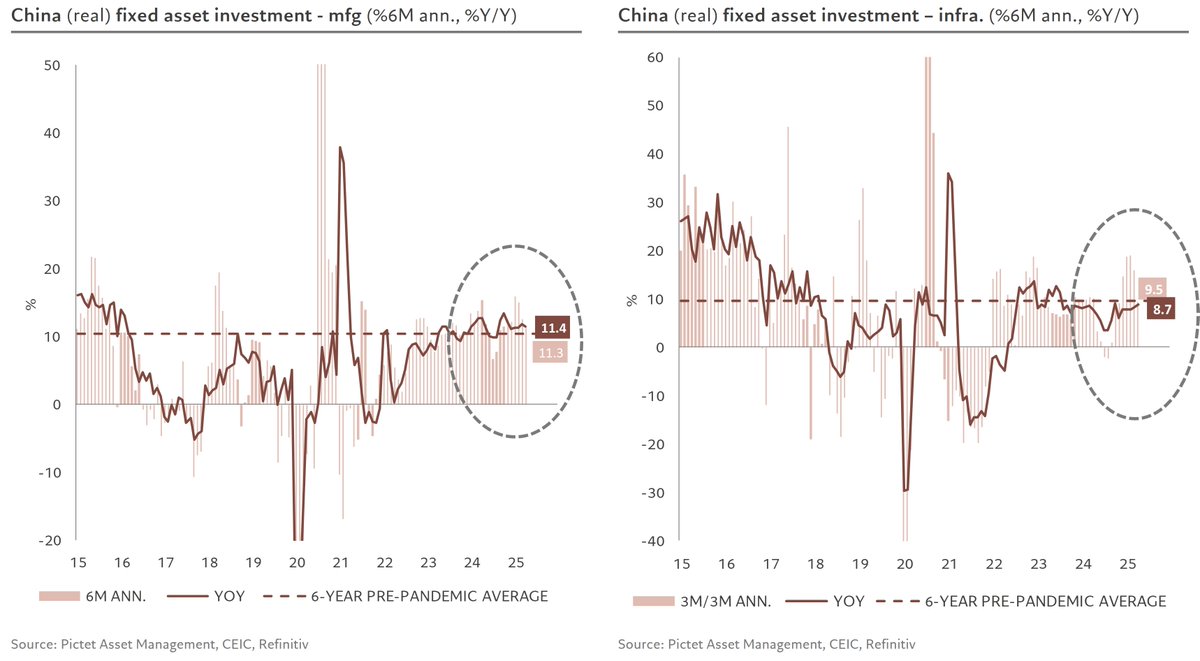
… This is driven by manufacturing investments exceeding historical norms and infrastructure investments returning to their average.
… This is driven by manufacturing investments exceeding historical norms and infrastructure investments returning to their average.
6/
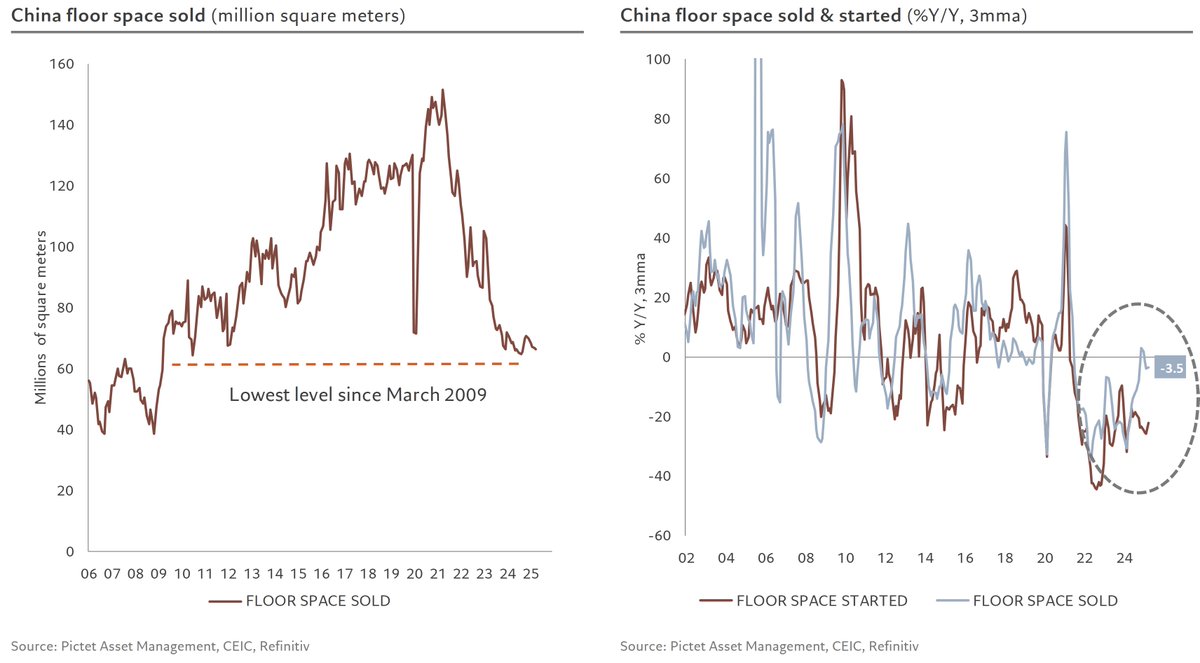
Residential investment remains at its lowest in over 15 years. On the bright side, residential demand has stabilized over the past year, no longer negatively impacting growth…
Residential investment remains at its lowest in over 15 years. On the bright side, residential demand has stabilized over the past year, no longer negatively impacting growth…
7/
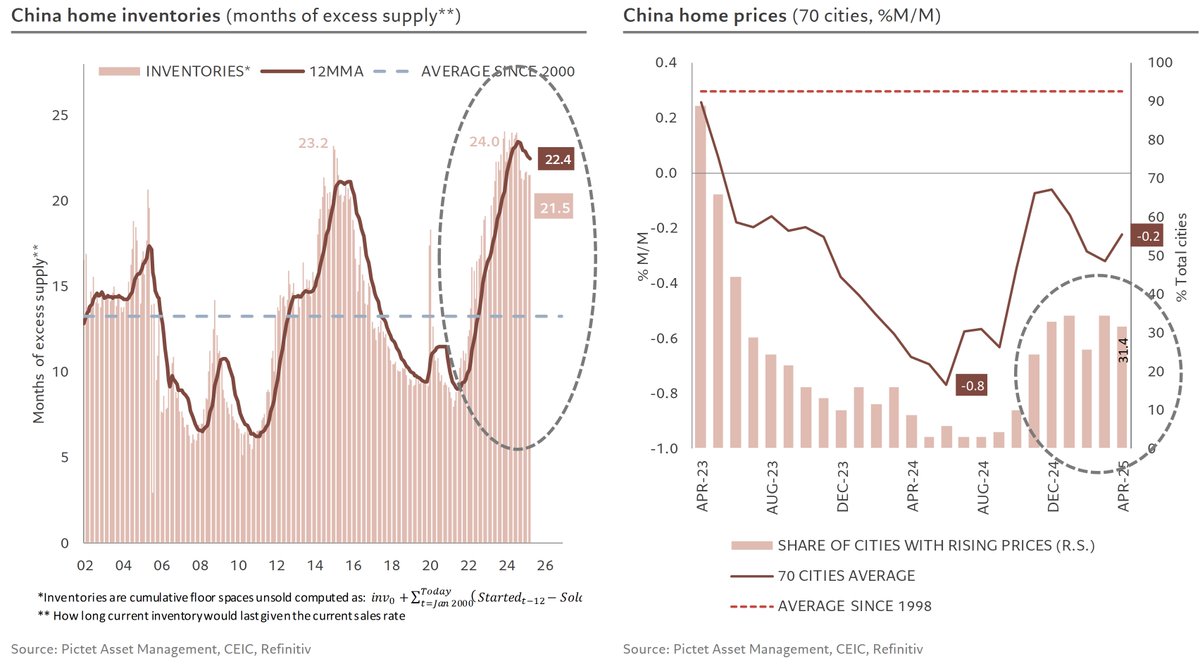
… Additionally, unsold inventory has started to decline from historic highs, still far from the 13-month norm, but suggesting house prices may stabilize, with nearly a third of cities seeing price increases this month.
… Additionally, unsold inventory has started to decline from historic highs, still far from the 13-month norm, but suggesting house prices may stabilize, with nearly a third of cities seeing price increases this month.
8/
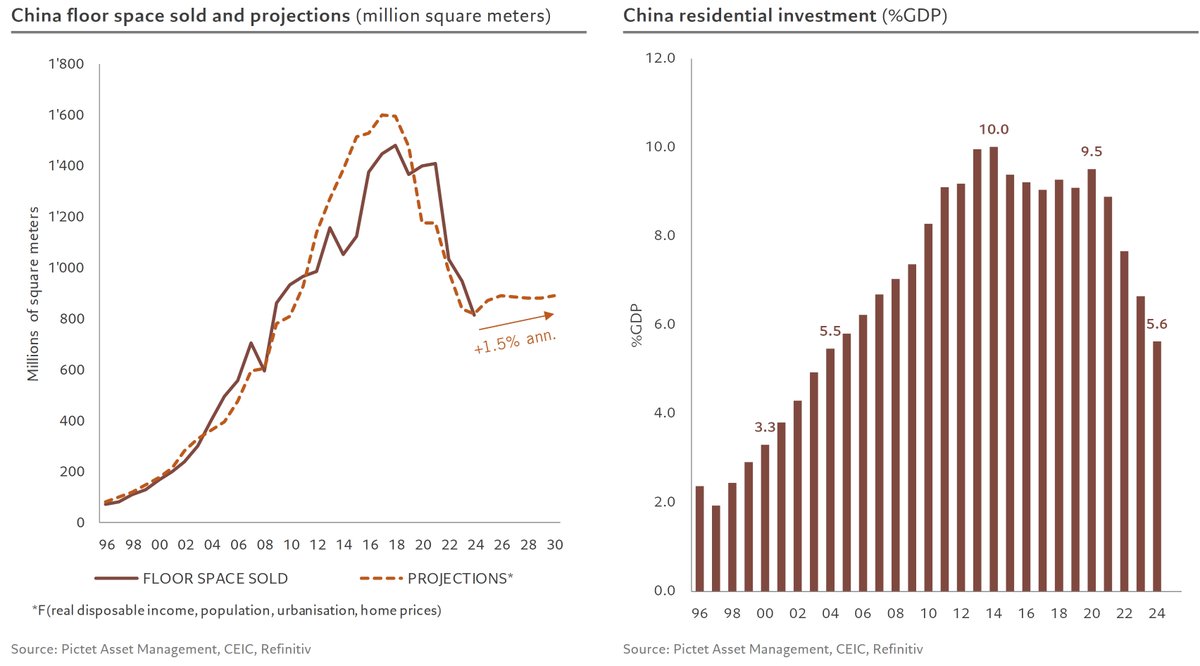
No significant rebound in the property market is expected, as projections using four key factors indicate just 1.5% growth, well below overall GDP growth. This suggests the sector will continue to shrink in GDP size, currently at its 2004 level of 5.6%.
No significant rebound in the property market is expected, as projections using four key factors indicate just 1.5% growth, well below overall GDP growth. This suggests the sector will continue to shrink in GDP size, currently at its 2004 level of 5.6%.
9/
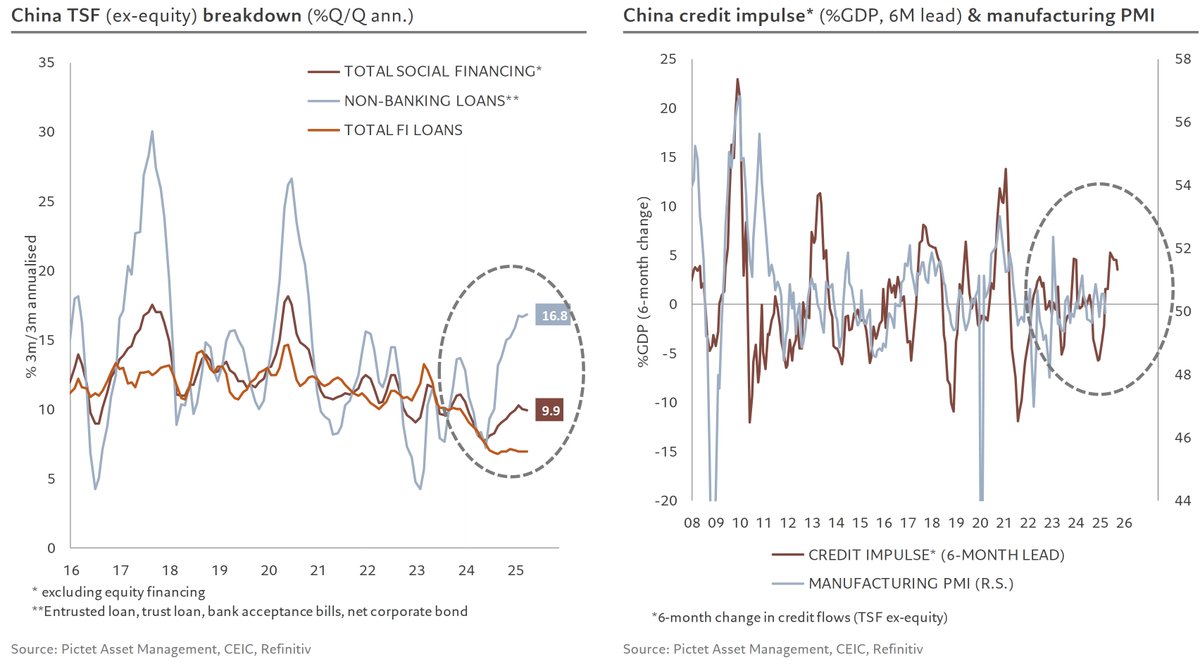
Finally, total social financing (TSF) continues to expand, with growth close to 10% annually this quarter, resulting in a solid increase in credit impulse, around its highest level in five years…
Finally, total social financing (TSF) continues to expand, with growth close to 10% annually this quarter, resulting in a solid increase in credit impulse, around its highest level in five years…
• • •
Missing some Tweet in this thread? You can try to
force a refresh