Patrick Zweifel Profile picture
Chief economist at Pictet Asset Management. Tweeting about #GlobalMacro #EmergingMarkets #China #US. All views my own. RT=interesting
p rehmer Profile picture Kheng Lai Tan Profile picture 2 subscribed
May 31 10 tweets 4 min read
1/
A thread on rethinking emerging markets.

Since their introduction as an asset class in 1988, EM equities have outperformed developed markets (10.1% ann. vs 8.9%). But it has been a bumpy ride, with a couple of long cycles in the interim Image 2/
One of the most salient features of EM in that period was the variability among the asset class’s national equity markets in how they responded to economic factors.

EM outperformance was indeed driven by a very diverse group of 10 countries Image
May 15 6 tweets 3 min read
1/
US core #inflation came out in line with expectations, down to 3.6% y/y from 3.8%

The decline stems from the continued contraction in goods prices to -1.2% y/y from -0.7%, while services inflation is unchanged at 5.3%. Image 2/
The fall in the price of goods is justified by demand, since retail sales in volume have been declining for 3 years, falling by an annualized 0.7% since the Nov 2021 peak Image
Apr 29 11 tweets 4 min read
1/
The latest US activity and inflation data send a stagflationary signal, with GDP slowing to 1.6% q/q ann. from 3.4% in Q4 and slightly below potential for the 1st time in 18 months, and core inflation rising to 3.7% from 2%.
Where do we really stand in the US business cycle? Image 2/
A more detailed look at GDP gives a more nuanced picture
The decline in growth is indeed largely due to a sharp rise in imports, thus maintaining strong growth in domestic demand at 2.8% q/q ann. in line with the pre-pandemic 6Y average, but decelerating since Q4 (3.5%) Image
Mar 30 10 tweets 4 min read
1/
In February, US household disposable income contracted in real terms, and is now 3.7% below its pre-pandemic trend, but above all is growing at a rate (1.3% 6m ann.) 2 times slower than its long-term trend... Image 2/
... and households can no longer count on the excess savings accumulated during the pandemic, which should be fully spent by the end of April... Image
Mar 18 6 tweets 2 min read
1/
Chinese activity data for the first 2 months of the year were better than expected, starting with industrial production, which continues to grow above its pre-pandemic trend at an annualized rate of over 8% over 3 months Image 2/
Retail sales volume growth continued to improve gradually, at a rate of 7.7% 3m/3m ann., returning to the average rate seen in the 6 years prior to the pandemic Image
Mar 4 5 tweets 2 min read
1/
After a strong rebound in January, the world manufacturing PMI corrected in February, with an uneninspiring movement in the components as activity fell at the margin while inflationary pressure on goods increased Image 2/
The activity component of the global PMI fell marginally by 0.2pt, but with a wide dispersion by region, with the advanced countries losing 1pt and Latin America gaining more than 2. In terms of levels, EM Asia ex-China remains comfortably in the lead at 54.9 Image
Jan 17 7 tweets 3 min read
1/
Chinese activity data for December shows that GDP ends the year slightly below (1.6%) its pre-pandemic trend, while GDP growth (4.9% q/q annualized with our own seasonal adjustment) is back to its potential Image 2/
Growth is back to potential, but the image of the Chinese economy remains unchanged. The property market still shows no signs of recovery on the supply side, and has deteriorated further on the demand side, which is now at its lowest level since mid-2009 Image
Oct 31, 2023 9 tweets 3 min read
1/
Where is #China in its business cycle?
Activity data for September generally confirmed August's rebound after 6 months of declining growth. This is most evident in industrial production (+1%m/m), which continues to rise above its pre-pandemic trend Image 2/
By sector, industrial production continues to be driven by chemicals, electrical equipment and cars Image
Oct 14, 2023 15 tweets 6 min read
1/
Is China in or on the verge of balance sheet recession?
Not really, the path that leads from an excess of debt to a deflationary recession is different and longer in China and I'd rather call it a bit heavy-handedly “balance sheet potential growth decline”
Here is why
(thread) Image 2/
A balance sheet recession starts with a high level of debt, and China has a high debt: the highest of the emerging markets, greater than that of the US but lower than that of some developed markets, not necessarily perceived as the riskiest though (e.g. Switz. or Sing.) Image
Oct 5, 2023 5 tweets 2 min read
1/5
. September global manufacturing PMI was up three tenths to 48.6, yet remains below the 50 threshold for 13 months, still suggesting a global slowdown

. The rebound was driven by activity components while price pressures were marginally down Image 2/5
. PMI Activity components rose by five tenths to 48.4 driven by DM, which rebounded from very low levels to 46.2

. EM Asia excluding China remains the region with the highest PMI activity components, and by a wide margin (at 54) Image
Sep 22, 2023 4 tweets 2 min read
1/3
The first 2 #US manufacturing surveys for September give opposite signals, but taken together the main messages remain little changed from a month ago:
1. activity is expected to slow down as these survey levels are associated with a GDP growth of 0.7% y/y Image 
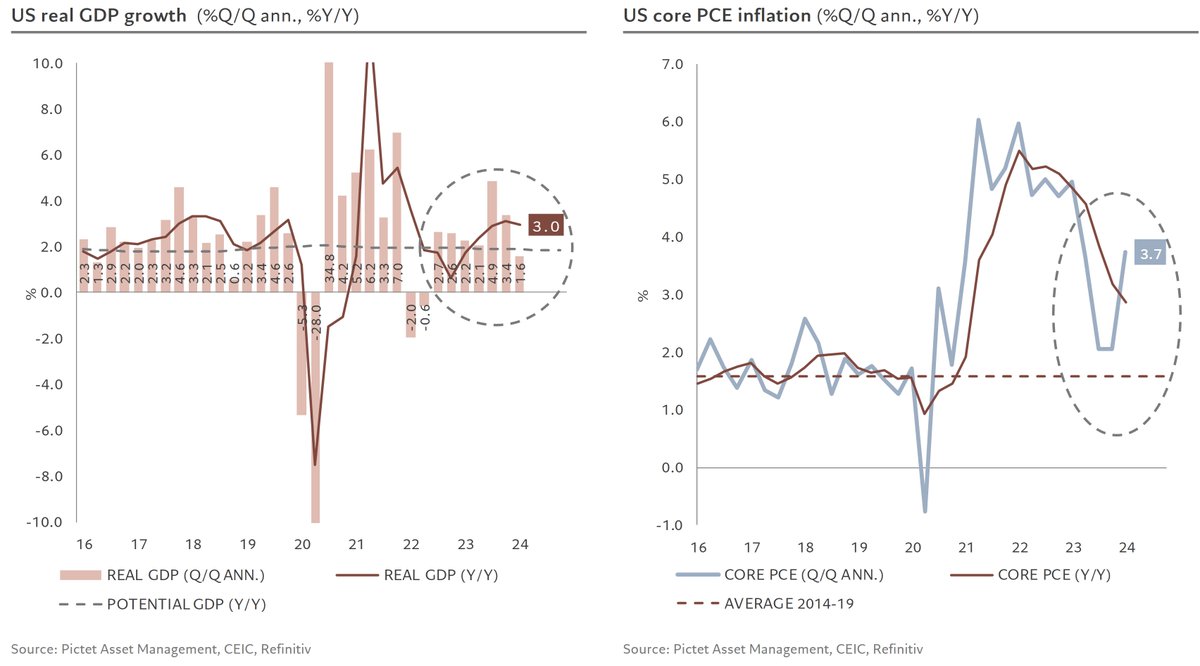
2. short-term inflationary pressures remain consistent with inflation returning towards its target Image
Sep 15, 2023 8 tweets 3 min read
1/
. For the first time since March, Chinese activity data for August surprised on the upside, rebounding for the most part from their July lows
. This is particularly true of industrial production, which jumped back above its trend Image 2/
. Retail sales volumes rebounded by 2% over the month driven by car sales, recovering half of the decline of the last 2 months. Improving trend in consumer spending, which remains well below its pre-crisis level, bodes well for the 2ndhalf of the year Image
Jul 4, 2023 4 tweets 2 min read
1/4
√ The world continues to slide further into recessionary territory with both activity and inflationary pressures falling

√ June global manufacturing PMI was down seven tenths of a point to 47.7, below the 50 threshold for the 10th consecutive month 2/4
√ Activity components declined for a 4th consecutive month to 47.6 driven by advanced economies (-0.9pt)

√ Emerging Markets declined less than developed markets, widening the gap further with DM
Jun 21, 2023 5 tweets 2 min read
1/5
After 11 months of collapse, which took our #US housing activity indicator to its lowest point in over 10 years, it has rebounded for the 6th consecutive month, with 10 out of 15 components up, among which housing starts (+22% m/m !), … Image 2/5
… homebuilders’ sentiment up 5 points, in expansive territory for the first time in 11 months and median new home price to disposable income ratio which fell 15% since its peak, returning to its >20-year average Image
Apr 26, 2023 4 tweets 2 min read
1/4
What is different about this cycle?

Starting point is the peak of the residential cycle, as it has caused 7 of the 10 past recessions, which are used to compare to the current cycle

The collapse of housing today (-21%) is very similar to that of the previous 7 cycles (-20%) Image 2/4
On the other hand, as we know, the consumption cycle is not only stronger than the previous cycles, but also stronger than each one individually👇

And without much surprise due to the consumption of services👇 Image
Mar 17, 2023 5 tweets 2 min read
1/5
After 10 months of decline and for the 3rd month in a row, our #US housing activity indicator has stopped deteriorating with 11 out of 15 indicators up, among which building permits 2/5
Housing was the 1st demand component to turn around in March 2021 and should, as in past cycles, be the first to recover

There are three main reasons for the first signs of recovery in the housing market:
Mar 15, 2023 5 tweets 2 min read
1/5
#China’s activity data for January and February combined confirm the recovery following the reopening of their economy and this recovery is strong starting with retail sales in volume which have increased by more than 6% since December, but still remains 13% below trend Image 2/5
√ The other very good news comes from the rebound in the real estate market with a strong recovery in both supply and demand for residential space… which is still nearly 30% below its trend though Image
Mar 14, 2023 5 tweets 2 min read
1/
√ US January core CPI inflation came in slightly higher than expectations (+0.5 m/m) with a continued normalisation of goods prices (1.0% y/y) and a continued rise in services prices (7.3%) Image 2/
√ in terms of momentum, the story is largely unchanged with a contraction in the price of goods (-1.2% 3m/3m ann.) and a continued stickiness on the price of services (+6.9%) Image
Feb 15, 2023 5 tweets 2 min read
1/5
√ US January CPI inflation came in largely in line with expectations (headline +0.5 and core +0.4 m/m) with a continued normalisation of goods prices (1.3% y/y) and a continued rise in services prices (7.2%)
(thread) 2/5
√ In terms of momentum, the story is largely unchanged with a contraction in the price of goods (-1.6% 3m/3m ann.) and a continued stickiness on the price of services (+6.9%)
Dec 15, 2022 7 tweets 3 min read
1/7
#China activity indicators for Nov came in much weaker than expected on Covid-linked restrictions and protests

. Too early for easing property measures to have an impact: floor space started remained at 13-year lows and residential demand is back to new cyclical lows

thread 2/7
. Overall construction activity was unchanged at cyclical lows and 24% below pre-pandemic trend while bottoming out on a y/y basis (-9.3% y/y vs -14.2% in Aug)
Dec 13, 2022 5 tweets 3 min read
1/5
#US inflation was lower than expected thanks to a reversal in energy prices: down 1.6% over the month and declining to 13% y/y from 17.6% with much further to go
(thread) 2/5
#US core inflation came in also lower than expected thanks to a marked fall in the price of core goods (-0.5% m/m) while the rise in the price of core services remained unchanged at 6.8% y/y