1) CDC & Biobot wastewater surveillance both show the West region in an apparent uptick in C19 transmission.
Here's the graph of regional transmission from CDC data with the West in green:
2) This image zooms in on the West (green line) so you can see the apparent departure from the C19 lull more easily.
3) Biobot still provides national & regional C19 updates. They usually post sometime between Thursday morning & Saturday evening. IMO, their most recent data point can be viewed as the Wednesday of the prior week.
Like the CDC, they have an apparent uptick in the West (green).
4) Here's the Zoom in on Biobot's C19 uptick in the West (green).
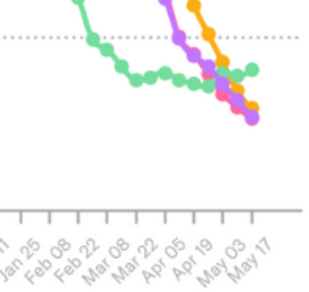
5) The CDC & Biobot data have long been *extremely* consistent at the national level, w/minor variation due to the specific sites sampled.
Right now, Biobot is running just a bit cooler than CDC. People sometimes wonder if the CDC would juke these stats. No evidence of that.
6) Overall, the data suggest it won't be long before we exit a lull. If lucky, levels will bounce around a bit longer before rising predictably.
My best guess is a late-Aug peak, but it's still much too early to say. Keep an eye on the West.
• • •
Missing some Tweet in this thread? You can try to
force a refresh
In this national "lull" in transmission, we are seeing...
🔥A quarter-million daily infections
🔥90-360k Long COVlD cases from the week's infections
🔥600-1,100 deaths from the week's infections
🔥LA, SD, NE, & GU in high transmission
1) Good luck getting any new federal research to support #LongCOVID until "covid" is dropped from the dirty words that get grant applications triaged to the trash bin.
You know which senator to call.
I just did, and got a staffer instead of voicemail.
2) I told the staffer that #LongCOVID is affecting millions and that no research will be funded to address this while "covid" remains on the banned word list.
3) I told them about my family member who was a strong Special Forces veteran, got covid once, & according to their neurologist, it triggered #LongCOVID in the form of Dementia w/Lewy Bodies.
DLB is one of the worst conditions imaginable. After a 2yr battle, they died in 2024.
Mortality displacement or "harvesting" is the idea that so many people died of COVID in the early pandemic that we should actually expect to see *fewer* deaths today if COVID were "over."
In fact, we see similar or slightly higher mortality relative to pre-pandemic levels. Despite the millions of people that have died, the mortality faucet keeps running strong. It should have slowed.
🌤️Only 1 in 5 days of the pandemic have seen transmission as low as today
🌤️1 in 196 actively infectious
⚡️BUT still 1.7 million weekly infections, resulting in >85,000 LC cases and up to 1,000 deaths
I'll walk you through it...
🧵2 of 8 | PMC Dashboard, April 21, 2025 (U.S.)
We're in the 6th year. See the small red line, bottom left. Notice how closely it tracks the median (gray), year 4 (yellow), & year 5 (orange).
Acknowledging caveats, those are plausible gist-level scenarios for months ahead.
🧵3 of 8 | PMC Dashboard, April 21, 2025 (U.S.)
Expect steady transmission bouncing up and down around the current national lull-level estimate the next several weeks. 200-350k daily infections nationally.
🔹2.2 million weekly infections
🔹1 in 149 actively infectious
🔹>100,000 LC cases resulting from the week's infections
🔹>800 deaths resulting from the week's infections
🔹"Lull" transmission steady/slightly declining
🧵2/5 | PMC Dashboard, Apr1il 14, 2025 (U.S.)
Year-over-year transmission (red line, lower left) is tracking the median (grey), year 4 (yellow), and year 5 (orange) closely.
If that trend continues, expect steady yet bumpy transmission the next couple months, until June/July.
🧵3/5 | PMC Dashboard, Apr1il 14, 2025 (U.S.)
The heat map shows only 4 states in the CDC 'high' level and none in the 'very' high level.
Check local data. Those timing activities to lulls may see a clear opportunity.
The NIH Clinical Center drops universal masking after 5 months of protecting patients, family, & staff.
Wastewater-derived estimates indicate 2.79 million Americans are getting Covid per week AND top actuaries suggest an American dies of Covid every 3 minutes.