What is happening in Japan?
In 45 days, Japan's 30Y Government Bond Yield rose a MASSIVE +100 basis points, to a record 3.20%.
Over $500 BILLION worth of "safe" 40Y Japanese Government Bonds have lost 20%+ in 6 weeks.
Is Japan's bond market imploding?
(a thread)
In 45 days, Japan's 30Y Government Bond Yield rose a MASSIVE +100 basis points, to a record 3.20%.
Over $500 BILLION worth of "safe" 40Y Japanese Government Bonds have lost 20%+ in 6 weeks.
Is Japan's bond market imploding?
(a thread)
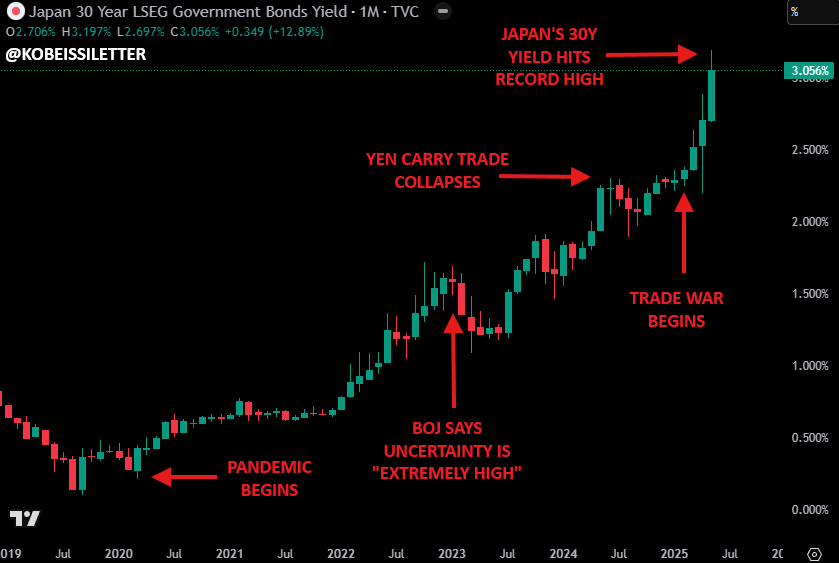
What's happening in Japan is not "normal."
Japan's 40Y government bond that was yielding ~1.3% two years ago is now yielding 3.5%.
As yields continue to surge, inflation has begun to rebound and Japan's economy is decline.
It appears Japan is entering a recession.
Japan's 40Y government bond that was yielding ~1.3% two years ago is now yielding 3.5%.
As yields continue to surge, inflation has begun to rebound and Japan's economy is decline.
It appears Japan is entering a recession.

The surge all began when the Bank of Japan (BOJ) made a major policy shift.
After years after BUYING bonds, the BOJ stopped doing so.
This resulted in much more bond supply hitting the market, which drove yields higher.
And, the BOJ has a colossal balance sheet still.
After years after BUYING bonds, the BOJ stopped doing so.
This resulted in much more bond supply hitting the market, which drove yields higher.
And, the BOJ has a colossal balance sheet still.

In fact, the Bank of Japan now owns a whopping 52% of all domestic government bonds.
By comparison, life insurers, banks, and pension funds hold 13.4%, 9.8%, and 8.9%, respectively.
The BOJ still holds a massive $4.1 trillion of government bonds on its balance sheet.
By comparison, life insurers, banks, and pension funds hold 13.4%, 9.8%, and 8.9%, respectively.
The BOJ still holds a massive $4.1 trillion of government bonds on its balance sheet.

Furthermore, the Japanese government now holds $7.8 trillion of debt.
This makes the Japanese government the third most indebted government in the world, behind the US and China.
As we are seeing in the US, rapidly rising government debt has left bond investors worried.
This makes the Japanese government the third most indebted government in the world, behind the US and China.
As we are seeing in the US, rapidly rising government debt has left bond investors worried.
Japan's Debt-to-GDP ratio recently exceeded 260% for the first time in history.
Their Debt-to-GDP ratio is roughly DOUBLE the United States.
It is also one of the top 5 in the world.
Last week, Japan's Prime Minister warned their financial situation is "worse than Greece."
Their Debt-to-GDP ratio is roughly DOUBLE the United States.
It is also one of the top 5 in the world.
Last week, Japan's Prime Minister warned their financial situation is "worse than Greece."

As we saw in the US last week, Japan's bond auctions are now spurring WEAKER demand.
When there is less demand, bond prices fall and yields rise.
As the Japanese economy slows and uncertainty rises, yields are accelerating.
This will be highly damaging to Japan's economy.
When there is less demand, bond prices fall and yields rise.
As the Japanese economy slows and uncertainty rises, yields are accelerating.
This will be highly damaging to Japan's economy.

We are already starting to see the effects of both tariffs and rising yields.
In Q1 2025, Japan's Real GDP CONTRACTED by -0.7%, much more than expectations of -0.3%.
This marked the first decline in Japan's GDP since Q1 2024.
We expect to see more weakness ahead.
In Q1 2025, Japan's Real GDP CONTRACTED by -0.7%, much more than expectations of -0.3%.
This marked the first decline in Japan's GDP since Q1 2024.
We expect to see more weakness ahead.

Meanwhile, Japan's CPI inflation is hit 3.6% in April, rising +0.4% month-over-month.
CPI ex fresh food jumped 0.7% MoM, the largest monthly increase since October 2023.
On an annual rate, it accelerated from 3.2% to 3.5%, the fastest since January 2023.
Stagflation is here.
CPI ex fresh food jumped 0.7% MoM, the largest monthly increase since October 2023.
On an annual rate, it accelerated from 3.2% to 3.5%, the fastest since January 2023.
Stagflation is here.

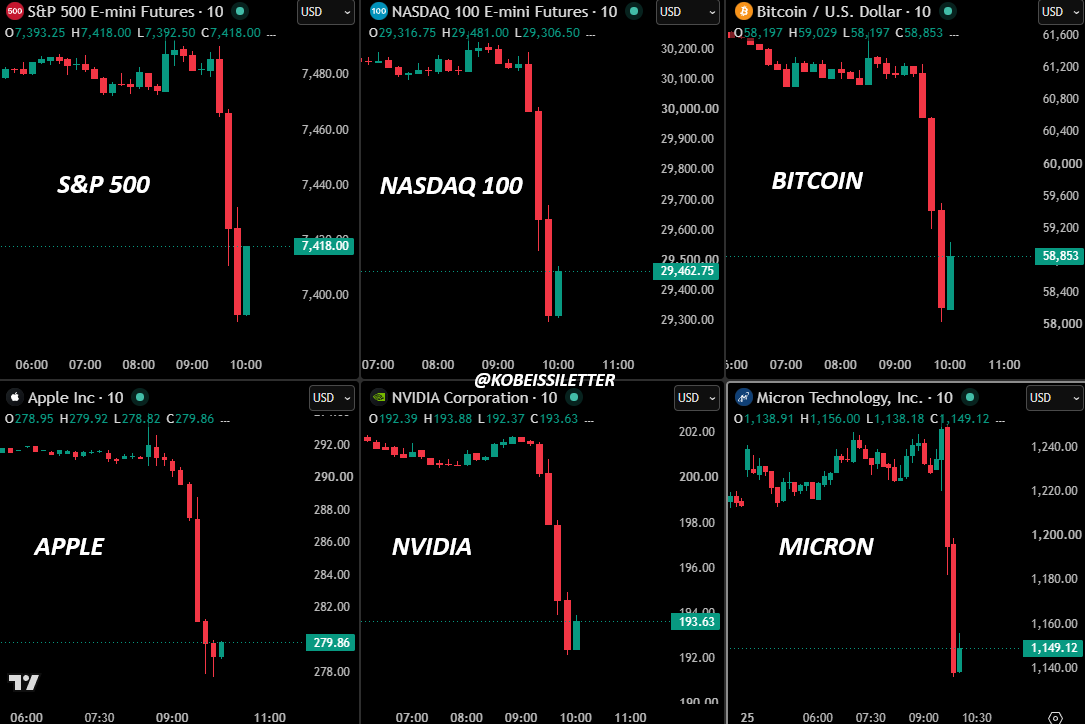
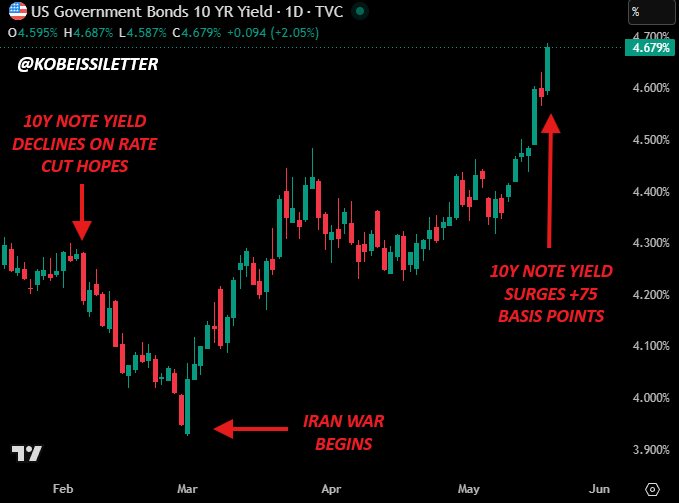
We have seen similar trends in the US, with the 10Y Note Yield surging above 4.60% last week.
Bond auction demand has weakened, rate cuts are being delayed, and deficit spending is rising.
Under the new tax bill, the US deficit is set to grow by +$3.8 TRILLION in 10 years.
Bond auction demand has weakened, rate cuts are being delayed, and deficit spending is rising.
Under the new tax bill, the US deficit is set to grow by +$3.8 TRILLION in 10 years.

The US is now seeing Debt-to-GDP levels that are ~10% ABOVE WW2 levels.
Such a rapid surge in Debt-to-GDP led to the Moody's downgrade of the US credit rating on May 17th.
However, this is still only HALF of what Japan is seeing.
Japan needs a major restructuring.
Such a rapid surge in Debt-to-GDP led to the Moody's downgrade of the US credit rating on May 17th.
However, this is still only HALF of what Japan is seeing.
Japan needs a major restructuring.

Finally, to make things even worse, real wages are declining SHARPLY in Japan.
Real wages fell -2.1% year-over-year last month, marking the largest drop in 2+ years.
So, as inflation rebounds, real wages are declining.
The BOJ can NOT hike rates into this environment.
Real wages fell -2.1% year-over-year last month, marking the largest drop in 2+ years.
So, as inflation rebounds, real wages are declining.
The BOJ can NOT hike rates into this environment.

The main problem with Japan's economy is the variety of conflicting drivers.
While inflation rises, real wages are falling, and while the government takes on more debt, demand is falling.
If yields continue to surge, the BOJ will need to intervene, but it won't be pretty.
While inflation rises, real wages are falling, and while the government takes on more debt, demand is falling.
If yields continue to surge, the BOJ will need to intervene, but it won't be pretty.
Unusual times lead to unusual swings in the market, and uncertainty is still very elevated.
Our subscribers are capitalizing on these swings.
Want to see how we are trading it?
Subscribe at the link below to access our latest analysis and alerts:
thekobeissiletter.com/subscribe
Our subscribers are capitalizing on these swings.
Want to see how we are trading it?
Subscribe at the link below to access our latest analysis and alerts:
thekobeissiletter.com/subscribe
The Yen Carry Trade collapse in August 2024 was a glimpse of how intertwined Japan is with global markets.
On August 5th, the Japanese stock market experienced its worst loss since 1987.
Keep watching Japan.
Follow us @KobeissiLetter for real time analysis as this develops.
On August 5th, the Japanese stock market experienced its worst loss since 1987.
Keep watching Japan.
Follow us @KobeissiLetter for real time analysis as this develops.

• • •
Missing some Tweet in this thread? You can try to
force a refresh