
Flexi Cap funds have a lot of freedom. But each has a distinct style.
@PPFAS Flexi Cap: Value-focused + bold cash calls
JM Flexi Cap: Aggressive, prefers mid & small caps
HDFC Flexi Cap: Steady performer + large-cap heavy
So, which one fits you the best? Let’s find out. A🧵
@PPFAS Flexi Cap: Value-focused + bold cash calls
JM Flexi Cap: Aggressive, prefers mid & small caps
HDFC Flexi Cap: Steady performer + large-cap heavy
So, which one fits you the best? Let’s find out. A🧵
We analysed every Flexi Cap fund in India across 5 key parameters:
-Allocation to Large Caps
-Exposure to Mid & Small Caps
-How frequently the fund buys and sells stocks
-Performance during good times
-Performance during tough times
Here’s what we found. 👇
-Allocation to Large Caps
-Exposure to Mid & Small Caps
-How frequently the fund buys and sells stocks
-Performance during good times
-Performance during tough times
Here’s what we found. 👇
1. Large Cap Allocation
Flexi Cap funds, on average, invest ~60% in large-cap stocks.
We used this as the benchmark to judge each fund’s style.
Let’s see which funds stick close to this 60% mark and which schemes go heavy.
Flexi Cap funds, on average, invest ~60% in large-cap stocks.
We used this as the benchmark to judge each fund’s style.
Let’s see which funds stick close to this 60% mark and which schemes go heavy.
Heavy tilt toward large caps
These are funds that behave more like large-cap schemes.
Example: @hdfcmf Flexi Cap Fund.
Its large cap allocation has never dipped below 70% since January 2018.
At one point, it was as high as 93%.
These are funds that behave more like large-cap schemes.
Example: @hdfcmf Flexi Cap Fund.
Its large cap allocation has never dipped below 70% since January 2018.
At one point, it was as high as 93%.

We also grouped funds based on how much their large-cap allocation fluctuates.
Some funds keep their large-cap allocation tightly within a band.
Example: UTI Flexi Cap
Others swing this allocation wildly based on their take on market conditions.
Example: Motilal Oswal Flexi Cap
Some funds keep their large-cap allocation tightly within a band.
Example: UTI Flexi Cap
Others swing this allocation wildly based on their take on market conditions.
Example: Motilal Oswal Flexi Cap

2. Allocation to Mid & Small Caps
Until mid-2023, Flexi Cap funds generally allocated 20–30% to mid & small caps.
But lately, that share has inched up to nearly 35-40% on average.
Some funds, though, are well above this average.
Until mid-2023, Flexi Cap funds generally allocated 20–30% to mid & small caps.
But lately, that share has inched up to nearly 35-40% on average.
Some funds, though, are well above this average.
Consider Bank of India Flexi Cap.
Its mid and small-cap allocation peaked at 59% in September 2021 and has averaged around 47% since inception.
Quant Flexi Cap has gone as high as 70%, averaging ~38%.
Its mid and small-cap allocation peaked at 59% in September 2021 and has averaged around 47% since inception.
Quant Flexi Cap has gone as high as 70%, averaging ~38%.

We also grouped funds based on how their allocation fluctuates.
Funds like Mirae Asset Flexi Cap and Nippon India Flexi Cap have a much more consistent allocation.
In contrast, @JMFSLtd Flexi Cap’s allocation has swung wildly, from as low as 1% to as high as 60% over the years.
Funds like Mirae Asset Flexi Cap and Nippon India Flexi Cap have a much more consistent allocation.
In contrast, @JMFSLtd Flexi Cap’s allocation has swung wildly, from as low as 1% to as high as 60% over the years.

3. Churning
We used the turnover ratio for this part. It indicates how frequently a fund manager buys and sells stocks within a year.
Schemes like Shriram Flexi Cap and TRUST MF Flexi Cap stand out, suggesting they might be following momentum strategies.
We used the turnover ratio for this part. It indicates how frequently a fund manager buys and sells stocks within a year.
Schemes like Shriram Flexi Cap and TRUST MF Flexi Cap stand out, suggesting they might be following momentum strategies.

On the other hand, most funds maintain a turnover of less than 40, suggesting a buy-and-hold approach.
This includes schemes from fund houses such as @NipponIndiaMF, @KotakMF, UTI, Franklin, Axis, PPFAS, and others.
This includes schemes from fund houses such as @NipponIndiaMF, @KotakMF, UTI, Franklin, Axis, PPFAS, and others.
4. Performance during good times
We used the upside capture ratio to evaluate the performance of all schemes during market rallies.
It shows how much the fund’s NAV rose when its benchmark went up by 100%. So, the higher the ratio, the better.
We used the upside capture ratio to evaluate the performance of all schemes during market rallies.
It shows how much the fund’s NAV rose when its benchmark went up by 100%. So, the higher the ratio, the better.
Examples of funds with high upside capture ratios: JM Flexi Cap, Bank of India Flexi Cap, @MotilalOswalAMC Flexi Cap
But shining in rallies tells only half of the story. So, we also checked how funds held up during tough times.
But shining in rallies tells only half of the story. So, we also checked how funds held up during tough times.

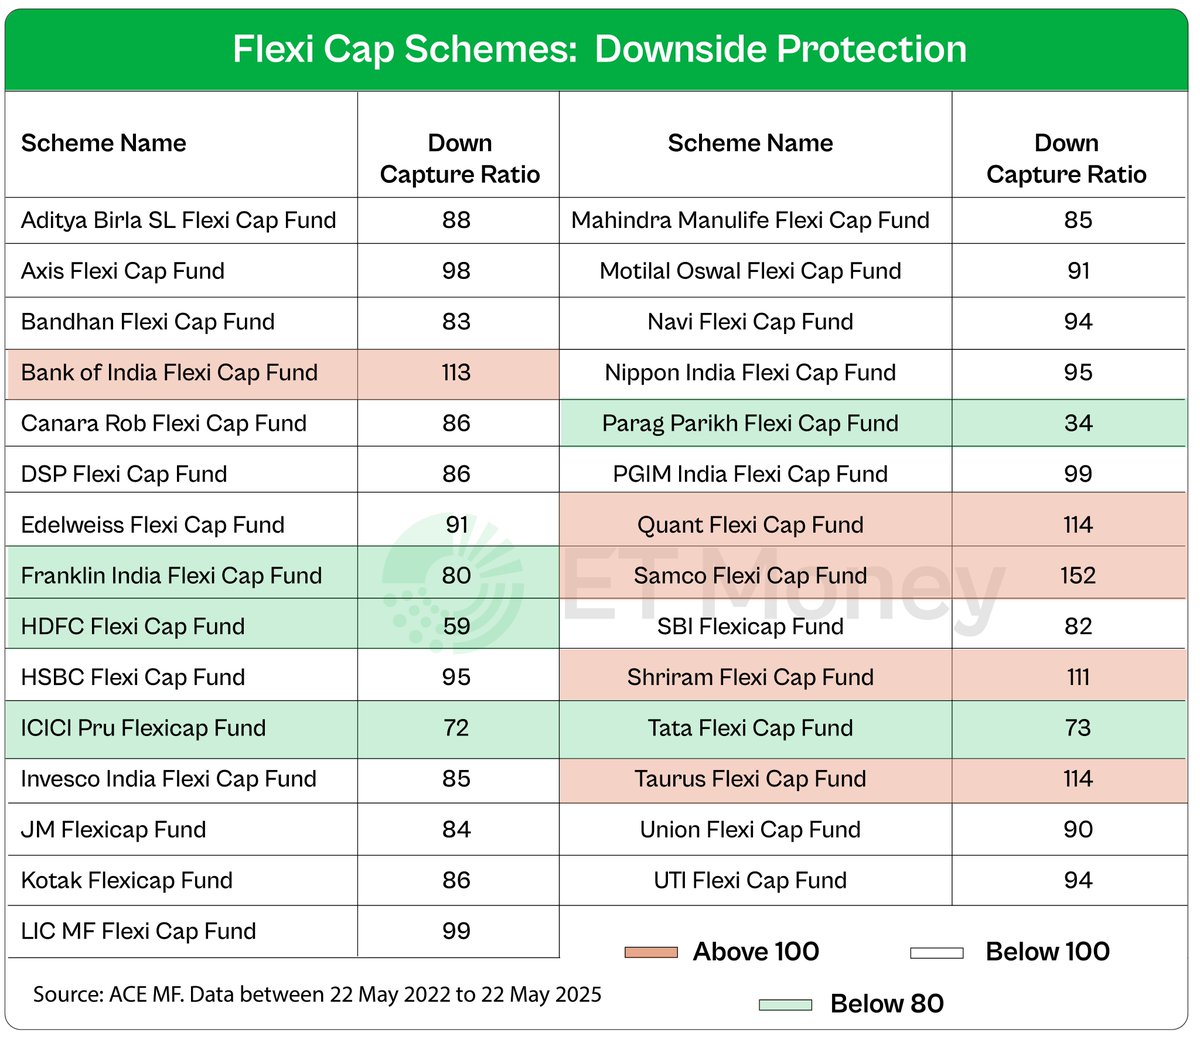
5. Performance during tough times
We used the downside capture ratio to assess how schemes performed during market declines.
It shows how much the fund’s NAV fell when its benchmark declined by 100%. So, the lower the ratio, the better a fund’s performance.
We used the downside capture ratio to assess how schemes performed during market declines.
It shows how much the fund’s NAV fell when its benchmark declined by 100%. So, the lower the ratio, the better a fund’s performance.
Schemes like Parag Parikh Flexi Cap, HDFC Flexi Cap, and @ICICIPruMF Flexi Cap stood out when it came to offering strong downside protection.
How to use these ratios?
Top-performing funds do a decent job of capturing the upside and limiting losses.
Examples: PPFAS and HDFC Flexi Cap.
Top-performing funds do a decent job of capturing the upside and limiting losses.
Examples: PPFAS and HDFC Flexi Cap.
You can use all the metrics in this analysis, not just the upside and downside ratio, to understand a fund’s investing style and characteristics.
This will help you look beyond a fund's returns and find the right fit for your portfolio.
Let’s understand with some examples.
This will help you look beyond a fund's returns and find the right fit for your portfolio.
Let’s understand with some examples.
If you are a cautious investor who values stability over surprises, pick funds with sizable large-cap allocation, low downside capture, and decent upside capture ratios.
If you want aggressive allocation to mid-cap and small-caps, you also have those kinds of options.
If you want aggressive allocation to mid-cap and small-caps, you also have those kinds of options.
Do you invest in any of these popular Flexi Cap schemes?
If you find this useful, show some love. ❤️
Please like, share, and retweet the first tweet.
Please like, share, and retweet the first tweet.
https://x.com/ETMONEY/status/1927744593954476216
• • •
Missing some Tweet in this thread? You can try to
force a refresh


