Mike Honey Profile picture
Jun 5 12 tweets 3 min read Read on X
I’ve added a couple of pages to my main SARS-CoV-2 variant analysis dataviz, digging into the data for International Travellers.

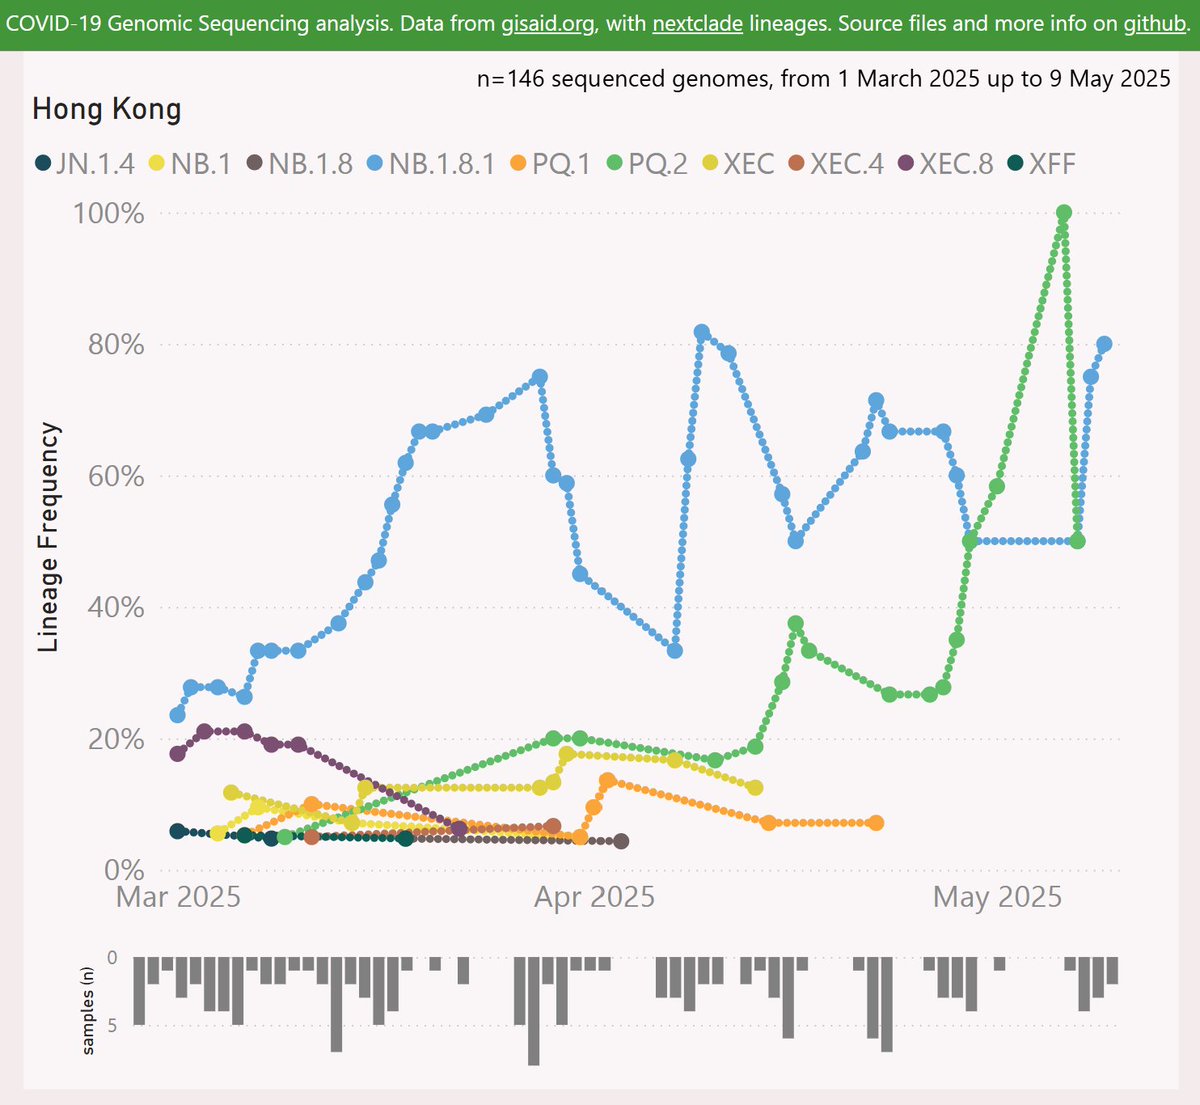
The first page shows the Lineage L2 trends across all the International Traveller samples.

#SARS_CoV_2 #International
🧵 Image
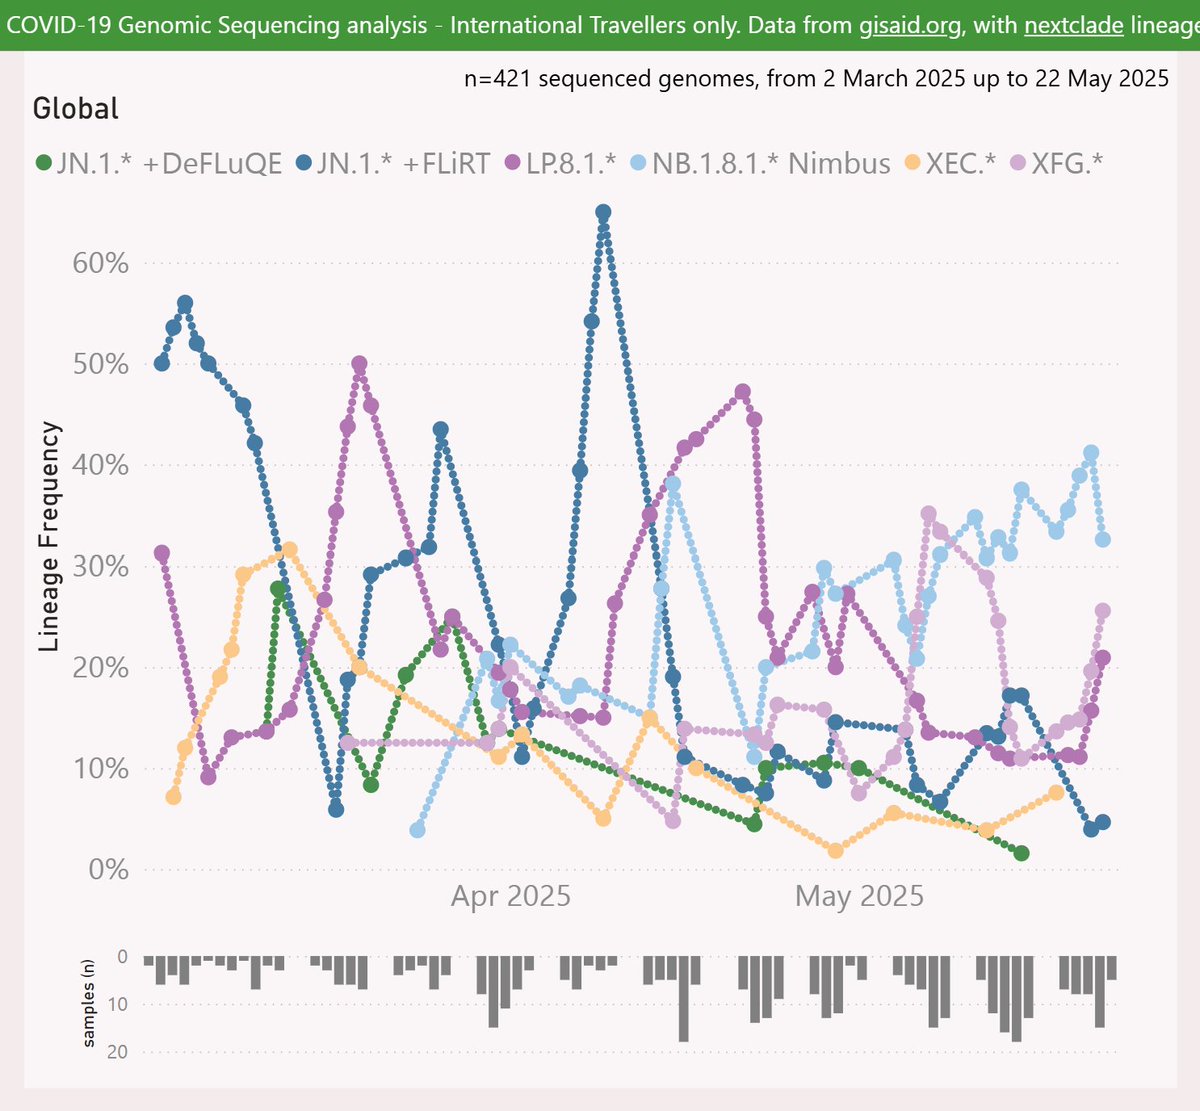
This is probably a more randomised sample than the "Global" aggregate of all samples submitted to GISAID, as those are dominated by the US and Canada
🧵
These samples are mainly collected from arrivals into the US and Japan, and while the data is unstructured, they often record the country of origin. This can give some insight into under-sampled countries.
🧵
The second page shows a matrix with the country of origin in the rows and the variant/Lineage in the columns. The view starts at the Lineage L2 group level, but the columns can be drilled down to individual Lineages.
🧵 Image
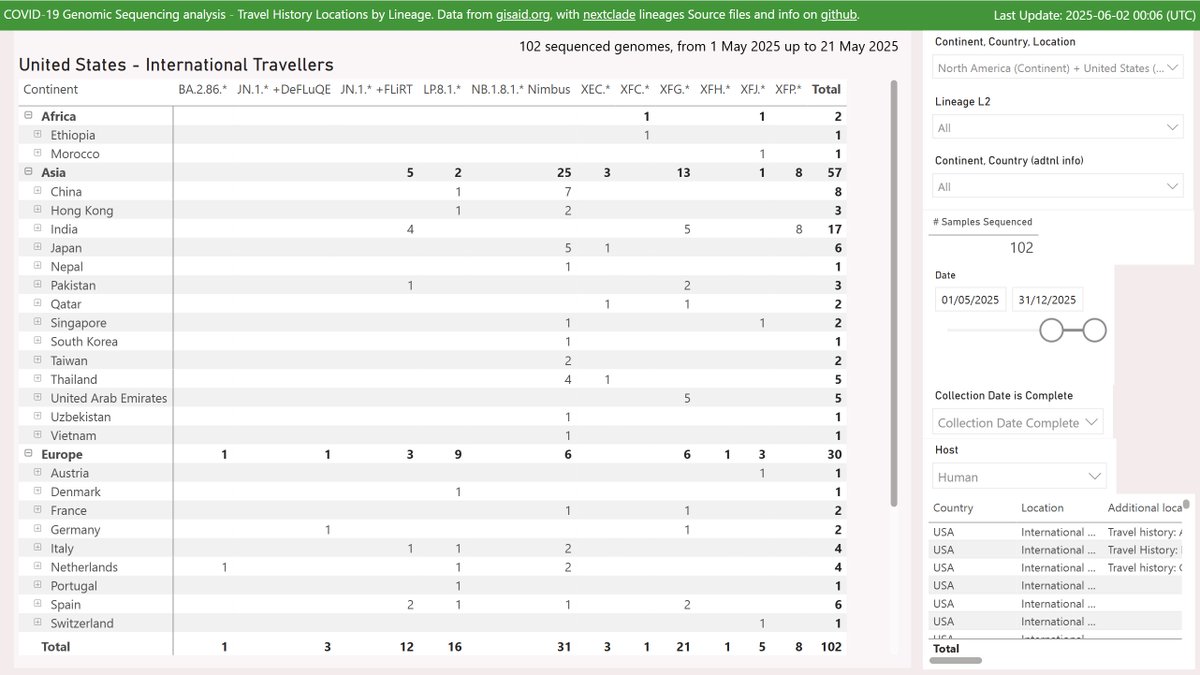
Using the slicer controls on the right side of the page, you can choose the submitting country (the data is mainly from the US and Japan) and date range, and optionally filter the country of origin too.
🧵
The third page is an alternate version of the first chart, but it can be filtered by the country of origin for International Traveller samples. As the data is so sparse, I’m using a stacked column chart and just counting the samples.
🧵 Image
I’m not doing anything too sophisticated to match the Country names in the unstructured data – just a case-insensitive search. I do try to clean up some messy data eg variations on South Korea.
🧵
The metadata columns I look in are [Additional location information] and [Additional host information].
🧵
Due to a quirk in GISAIDs metadata formats, [Additional location information] is available back to January 2024, but I’ve only loaded the data for [Additional host information] back to January 2025.
🧵
A few variant trackers have been maintaining manual lists of this data, by laboriously collecting and cleaning the data sample by sample. Hopefully this method can automate some of that work, and also open analysis to a broader audience.
🧵
If you live in or report on a country with low sample coverage, 5-10 minutes work each week using these pages could give you an up-to-date picture of what is developing there.
🧵
Interactive genomic sequencing dataviz, code, acknowledgements and more info here:

🧵 endsgithub.com/Mike-Honey/cov…

• • •

Missing some Tweet in this thread? You can try to force a refresh
 

Keep Current with Mike Honey

Mike Honey Profile picture

Stay in touch and get notified when new unrolls are available from this author!

Read all threads

This Thread may be Removed Anytime!

PDF

Twitter may remove this content at anytime! Save it as PDF for later use!

Try unrolling a thread yourself!

how to unroll video
  1. Follow @ThreadReaderApp to mention us!

  2. From a Twitter thread mention us with a keyword "unroll"
@threadreaderapp unroll

Practice here first or read more on our help page!

More from @Mike_Honey_

Jun 2
XFP is the latest recombinant variant to be classified and incredibly it is the third of a recent set of recombinants with identical spike mutations. The earlier ones were XFJ and XFM.

I think of them as the "Doppelgängers".

#COVID19 #XFJ #XFM #XFP #Doppelgängers
🧵 Image
Note "Doppelgänger" is not an agreed variant nickname, nor should it be. There doesn’t seem to be anything stopping other sets of variants or recombinants from ending up the same way, as multiple Doppelgänger packs.
🧵
Also note their non-Spike mutations do vary. But the Spike proteins of SARS-CoV-2 are the focus of much study and explain the success of most variants.
🧵
Read 12 tweets
Jun 1
Hong Kong was the first country to report a wave driven by the new NB.1.8.1.* "Nimbus" variant.

Including it’s sub-variants, Nimbus has made a clean sweep of the landscape there.
#COVID19 #HongKong #NB_1_8_1 #Nimbus
🧵 Image
Nimbus accounted for 100% of 50-odd recent samples collected since mid-April. I haven’t seen that happen anywhere since the JN.1 wave in late 2023.
🧵
Looking at the specific variants, the child variant PQ.2 has been making a significant contribution. PQ.2 added the ORF3a:W193R mutation.
🧵 Image
Read 4 tweets
Jun 1
Here's the latest variant picture for my new " Global - Other" report, to mid-May.

The NB.1.8.1 "Nimbus" variant is clearly dominant at 43%.

The XFG.* variant is another challenger, growing to 9%.

#COVID19 #GlobalOther #NB_1_8_1 #Nimbus #XFG
🧵 Image
This perspective excludes all the high-volume countries and regions that I routinely report on: Australia, NZ, Europe, Canada and the US. The remaining countries are aggregated into this report.
🧵
For the "Global - Other" countries, the XFG.* variant is showing a marginal growth advantage of 0.4% per day (3% per week) over the NB.1.8.1 "Nimbus" variant. Any crossover looks distant.
🧵 Image
Read 7 tweets
Jun 1
Here's the latest variant picture for the United States, to early May.

The LP.8.1.* variant continued to fall, down to 35%.

The next challenger is XFG.*, which grew strongly to 19%.

#COVID19 #USA #LP_8_1 #XFG #NB_1_8_1 #Nimbus
🧵 Image
For the US, the XFG.* variant shows a strong and accelerating growth advantage of 6.4% per day (45% per week) over LP.8.1.*, which now predicts a crossover in late-May (the data routinely lags).
🧵 Image
XFG.* had mainly been reported from New York state, rising to 27% frequency. It has also been very common among the International Traveller samples. It rose in Vermont to 20%.
🧵 Image
Read 7 tweets
May 31
Here's the latest variant picture with a global scope, to mid-May.

The NB.1.8.1 "Nimbus" variant has grown strongly to take over dominance at 27%.

The LP.8.1.* variant has fallen to around 27%.

The XFG.* variant grew to 12%.

#COVID19 #Global #NB_1_8_1 #Nimbus #LP_8_1 #XFG
🧵 Image
Following the declaration by the WHO of NB.1.8.1 as a Variant Under Monitoring and as Nextstrain Clade 25B, I have separated that variant and its descendants into a new “L2” group, shown in Sky Blue.
🧵
Globally, the NB.1.8.1 "Nimbus" variant is showing a strong growth advantage of 6.3% per day (44% per week) over the LP.8.1.* variant, with a crossover in mid- May.
🧵 Image
Read 7 tweets
May 29
Australian COVID-19 cases update:

Reported Cases have continued to rise sharply at the national level and in most states & territories, with the 7-day average doubling in the last 2 weeks.

#COVID19 #Australia
🧵 Image
The last time 800 cases/day were reported nationally was in late January, on the downslope of the XEC wave. The peak of this wave has not been reached.

As always, it is hard to be certain with this series; the data quality is very shoddy and the raw data is incredibly spiky.
🧵
Reported cases are continuing to grow strongly in NSW, with the Reff (case momentum) fairly steady between 1.2 and 1.3, so sustained exponential growth.

The prior wave (XEC in January) in NSW peaked at around 410/day, which looks within reach for this wave.
🧵 Image
Read 5 tweets

Did Thread Reader help you today?

Support us! We are indie developers!


This site is made by just two indie developers on a laptop doing marketing, support and development! Read more about the story.

Become a Premium Member ($3/month or $30/year) and get exclusive features!

Become Premium

Don't want to be a Premium member but still want to support us?

Make a small donation by buying us coffee ($5) or help with server cost ($10)

Donate via Paypal

Or Donate anonymously using crypto!

Ethereum

0xfe58350B80634f60Fa6Dc149a72b4DFbc17D341E copy

Bitcoin

3ATGMxNzCUFzxpMCHL5sWSt4DVtS8UqXpi copy

Thank you for your support!

Follow Us!

:(