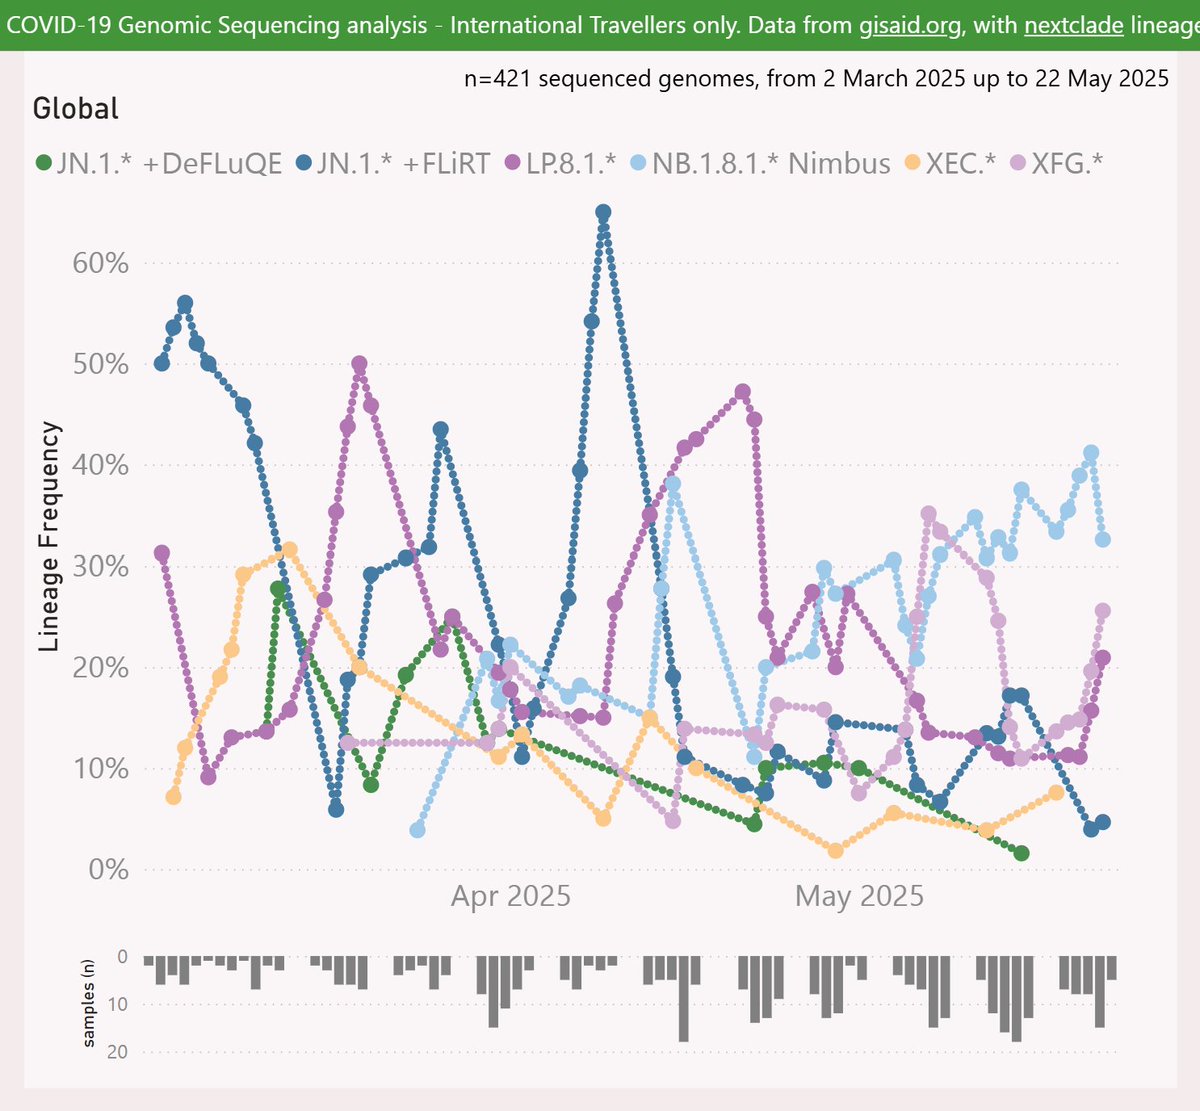
Here's the latest variant picture for the "Global - Other" countries, to mid-May.
The NB.1.8.1 "Nimbus" variant is clearly dominant at 46%.
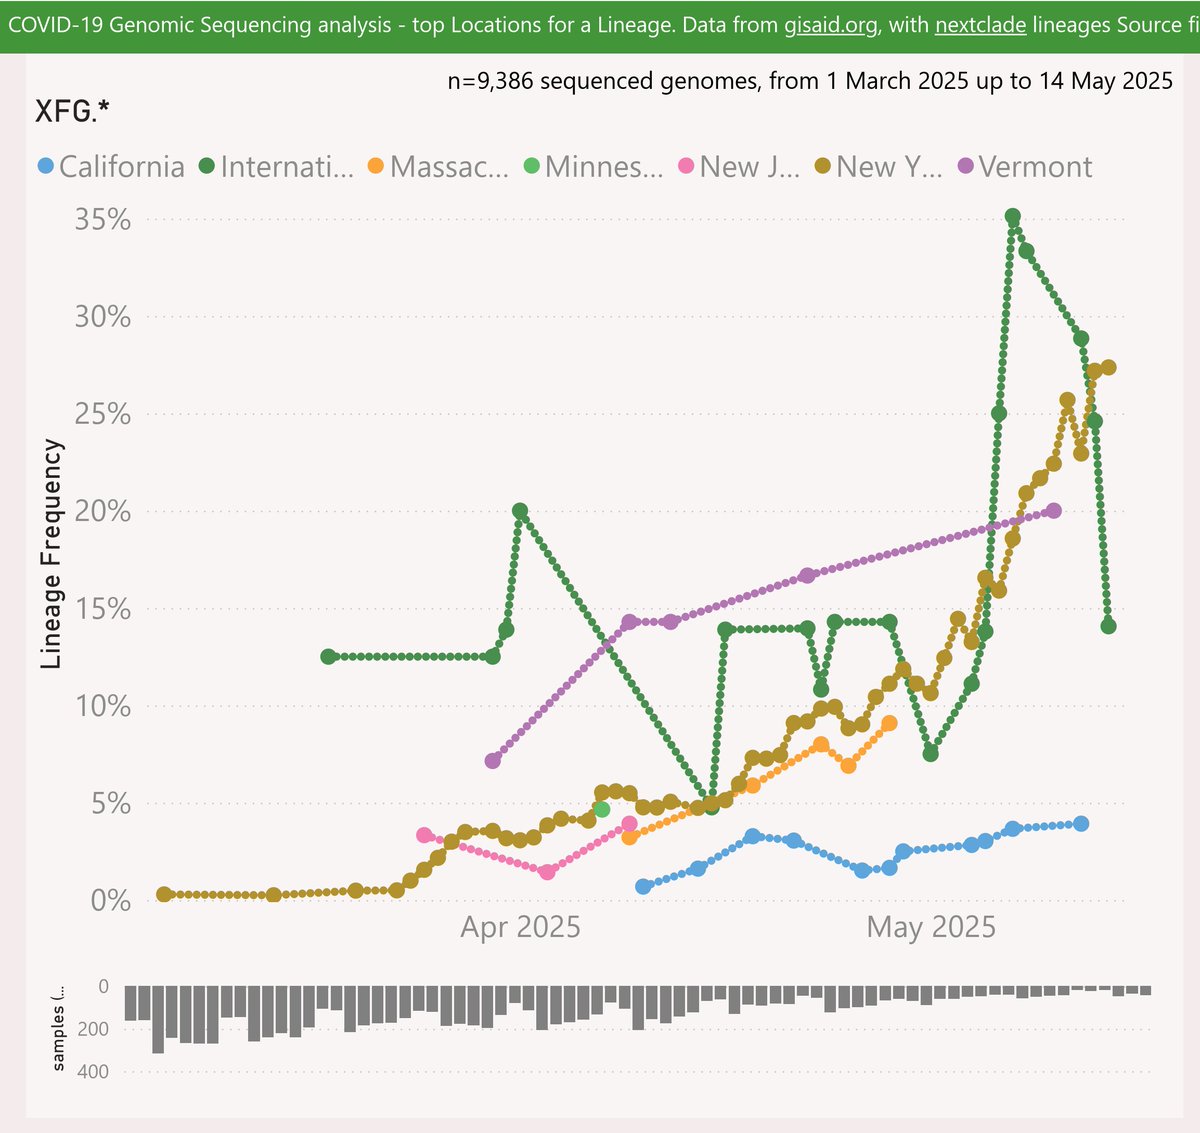
The XFG.* variant is another challenger, growing to 12%.
#COVID19 #GlobalOther #NB_1_8_1 #Nimbus #XFG
🧵
This perspective excludes all the high-volume countries and regions that I routinely report on: Australia, NZ, Europe, Canada and the US. The remaining countries are aggregated into this report.
🧵
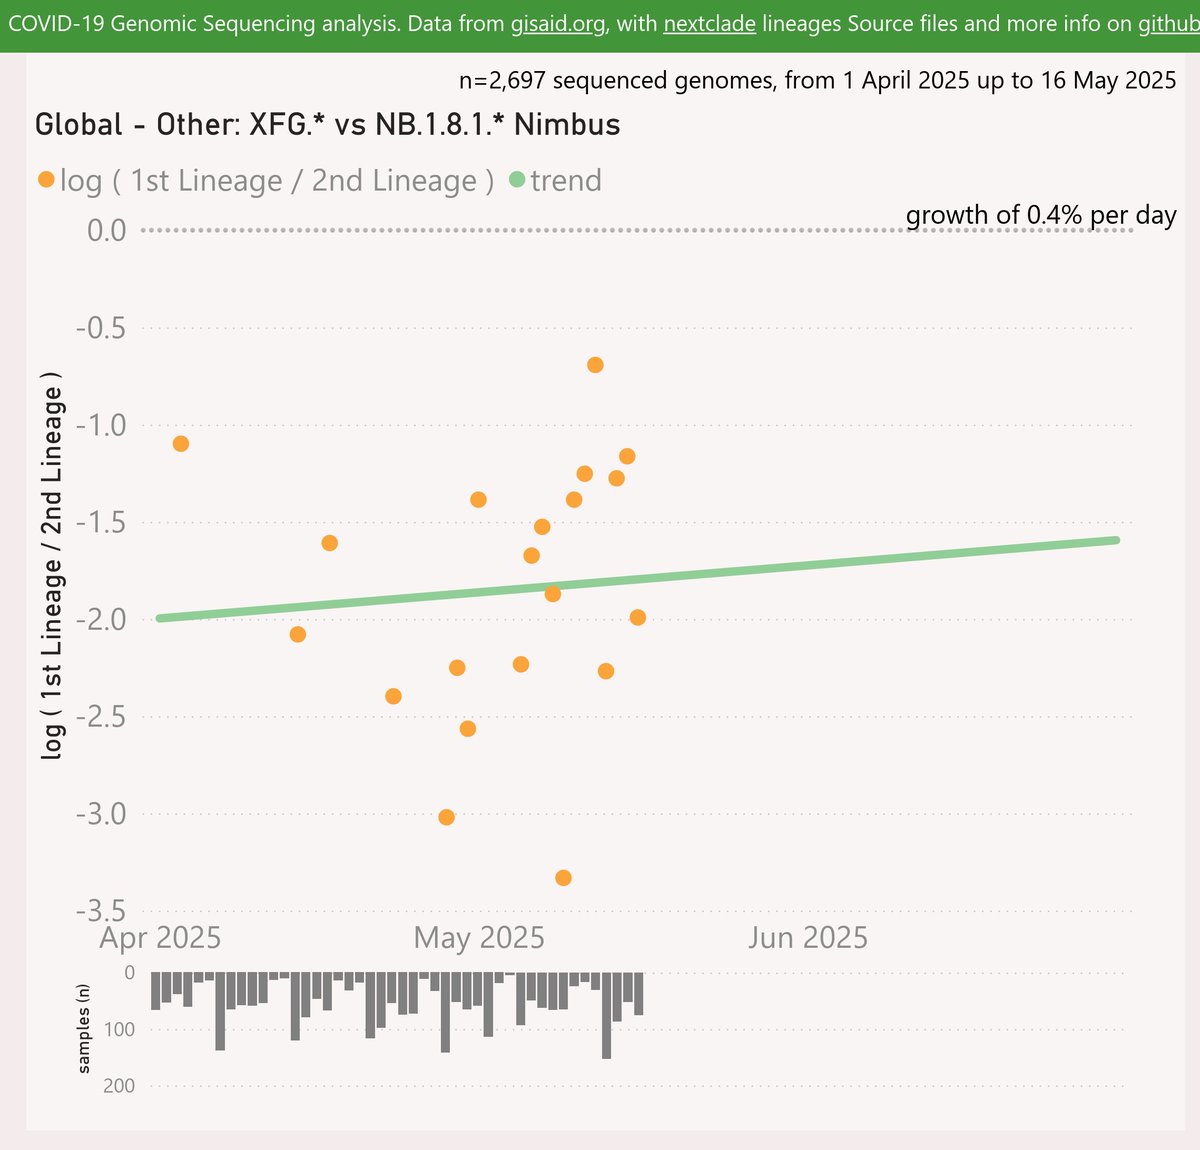
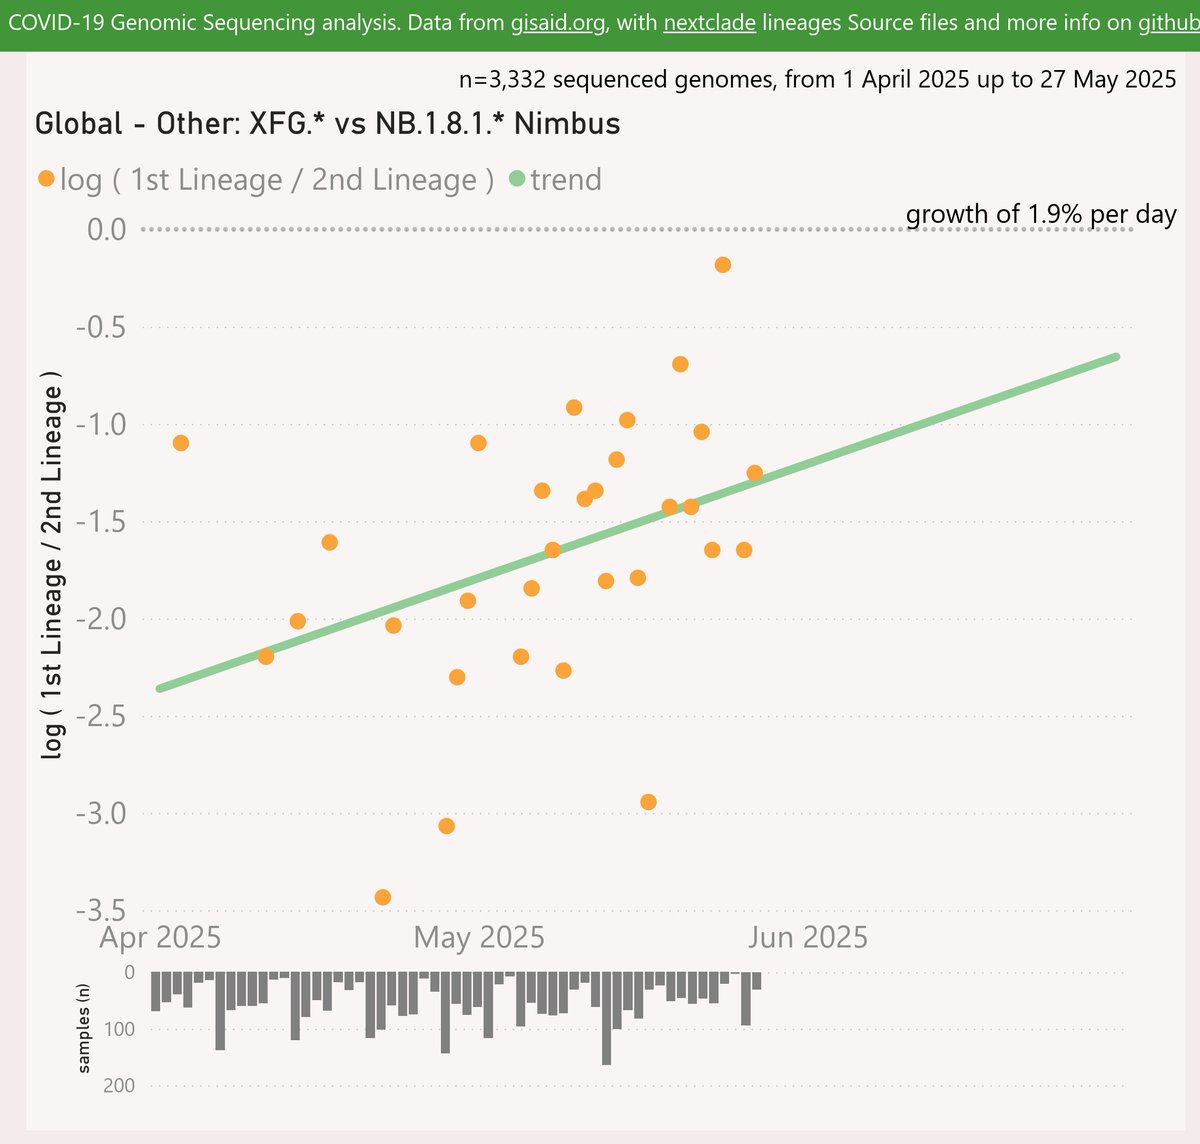
For the "Global - Other" countries, the XFG.* variant is showing a growth advantage of 1.9% per day (13% per week) over the NB.1.8.1 "Nimbus" variant. Any crossover looks distant.
🧵
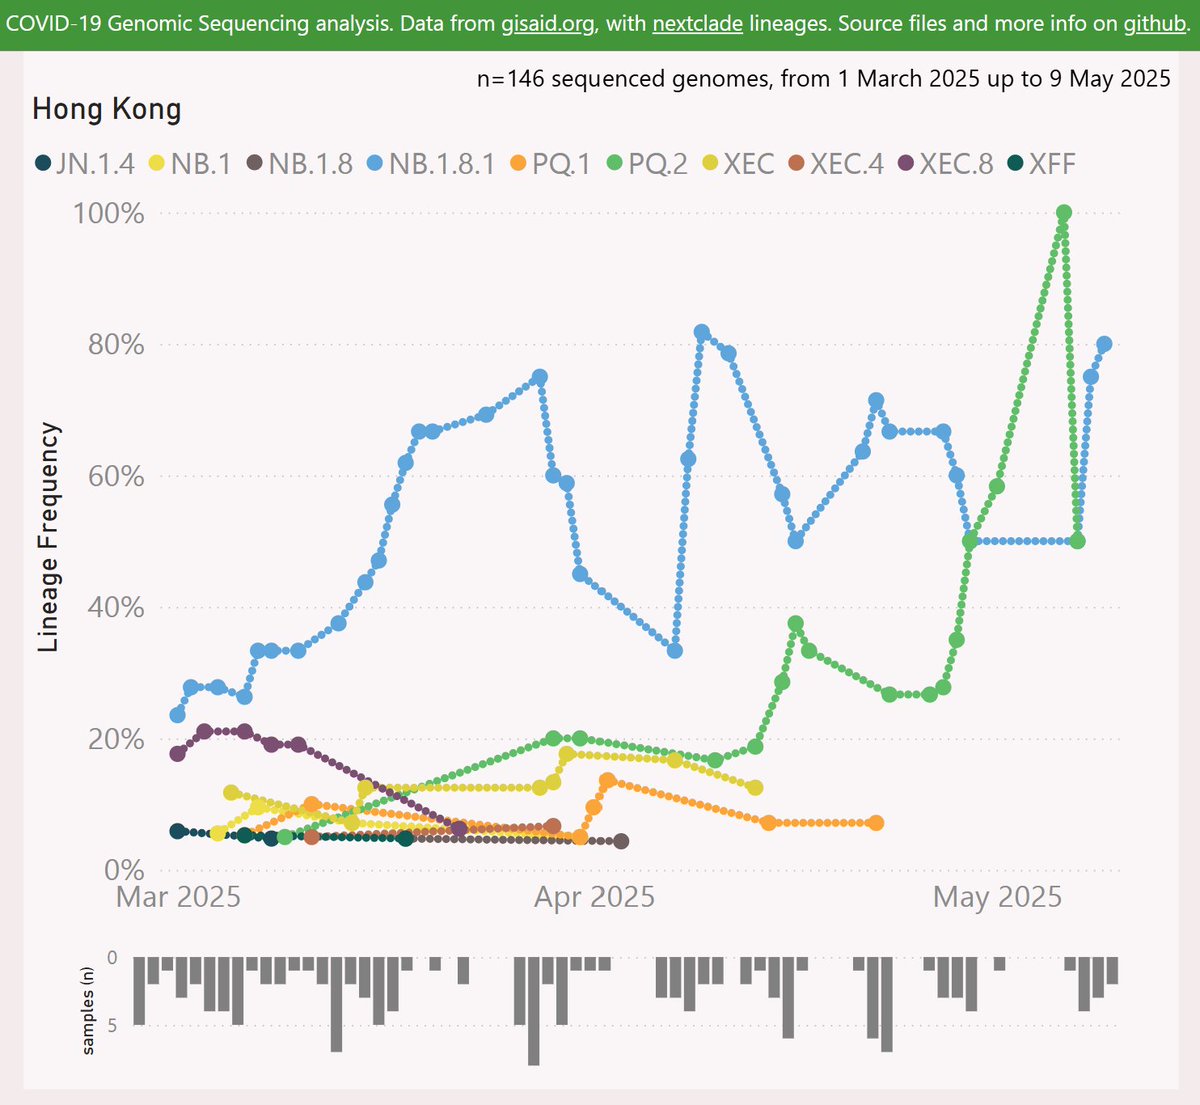
The first reported wave of NB.1.8.1 "Nimbus" was in Hong Kong, rising to 100% frequency. It has also shown sustained growth in other countries across the region.
🧵
XFG.* made up 100% of recent samples from Bangladesh. India is at 44%.
🧵
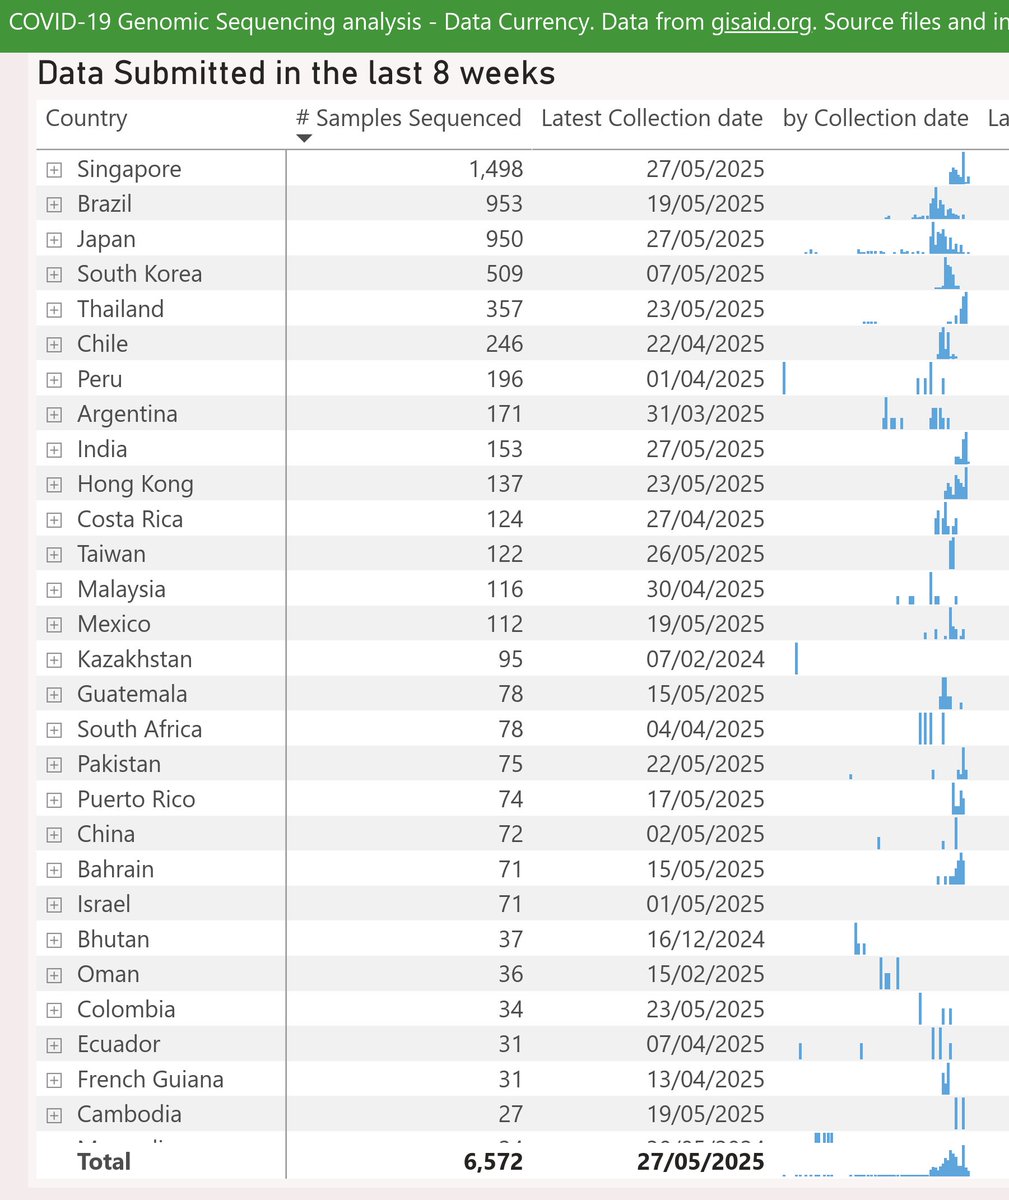
Singapore, Brazil and Japan have shared the most sample data recently. China is well down the list, especially considering its large size and relative wealth.
🧵
Here's the latest variant picture for the United States, to late May.
The LP.8.1.* variant was down to 37%.
The next challenger looks like XFG.*, which grew strongly to 24%.
The NB.1.8.1 "Nimbus" variant is also growing, up to 16%.
#COVID19 #USA #XFG #NB_1_8_1 #Nimbus
🧵
For the US, the XFG.* variant shows a strong growth advantage of 6.1% per day (43% per week) over LP.8.1.*, which predicts a crossover in late May (the data routinely lags).
🧵
XFG.* has mainly been reported from New York state, rising to 33% frequency. It has also been very common among the International Traveller samples. It rose in Vermont to 20%.
🧵
I’ve added a couple of pages to my main SARS-CoV-2 variant analysis dataviz, digging into the data for International Travellers.
The first page shows the Lineage L2 trends across all the International Traveller samples.
#SARS_CoV_2 #International
🧵
This is probably a more randomised sample than the "Global" aggregate of all samples submitted to GISAID, as those are dominated by the US and Canada
🧵
These samples are mainly collected from arrivals into the US and Japan, and while the data is unstructured, they often record the country of origin. This can give some insight into under-sampled countries.
🧵
XFP is the latest recombinant variant to be classified and incredibly it is the third of a recent set of recombinants with identical spike mutations. The earlier ones were XFJ and XFM.
I think of them as the "Doppelgängers".
#COVID19 #XFJ #XFM #XFP #Doppelgängers
🧵
Note "Doppelgänger" is not an agreed variant nickname, nor should it be. There doesn’t seem to be anything stopping other sets of variants or recombinants from ending up the same way, as multiple Doppelgänger packs.
🧵
Also note their non-Spike mutations do vary. But the Spike proteins of SARS-CoV-2 are the focus of much study and explain the success of most variants.
🧵
Here's the latest variant picture for my new " Global - Other" report, to mid-May.
The NB.1.8.1 "Nimbus" variant is clearly dominant at 43%.
The XFG.* variant is another challenger, growing to 9%.
#COVID19 #GlobalOther #NB_1_8_1 #Nimbus #XFG
🧵
This perspective excludes all the high-volume countries and regions that I routinely report on: Australia, NZ, Europe, Canada and the US. The remaining countries are aggregated into this report.
🧵
For the "Global - Other" countries, the XFG.* variant is showing a marginal growth advantage of 0.4% per day (3% per week) over the NB.1.8.1 "Nimbus" variant. Any crossover looks distant.
🧵
Here's the latest variant picture for the United States, to early May.
The LP.8.1.* variant continued to fall, down to 35%.
The next challenger is XFG.*, which grew strongly to 19%.
#COVID19 #USA #LP_8_1 #XFG #NB_1_8_1 #Nimbus
🧵
For the US, the XFG.* variant shows a strong and accelerating growth advantage of 6.4% per day (45% per week) over LP.8.1.*, which now predicts a crossover in late-May (the data routinely lags).
🧵
XFG.* had mainly been reported from New York state, rising to 27% frequency. It has also been very common among the International Traveller samples. It rose in Vermont to 20%.
🧵