MAJOR news from Iran:
Iran's parliament officially approves CLOSING the Strait of Hormuz for the first time since 1972.
If approved by Iran's top security body, shipments of 20+ MILLION barrels of oil PER DAY will be impacted.
What's next? Let us explain.
(a thread)
Iran's parliament officially approves CLOSING the Strait of Hormuz for the first time since 1972.
If approved by Iran's top security body, shipments of 20+ MILLION barrels of oil PER DAY will be impacted.
What's next? Let us explain.
(a thread)

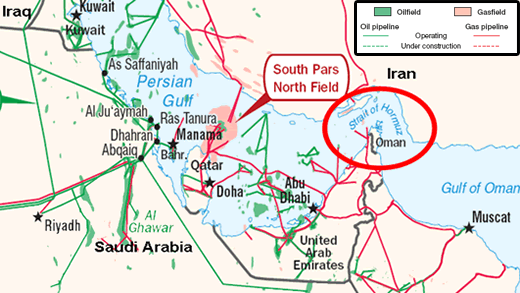
The Strait of Hormuz, between Oman and Iran, connects the Persian Gulf with the Gulf of Oman and the Arabian Sea.
This body of water controls ~20% of the world’s petroleum liquids consumption.
In other words, ONE FIFTH of global oil consumption flows through here EVERY DAY.
This body of water controls ~20% of the world’s petroleum liquids consumption.
In other words, ONE FIFTH of global oil consumption flows through here EVERY DAY.

After US strikes on Iran last night, 50+ large oil tankers were scrambling to leave the Strait of Hormuz.
Markets have been closed, but an immediate drop in supply is expected to send prices higher.
JP Morgan described this as their worst case scenario in the Israel-Iran war.
Markets have been closed, but an immediate drop in supply is expected to send prices higher.
JP Morgan described this as their worst case scenario in the Israel-Iran war.

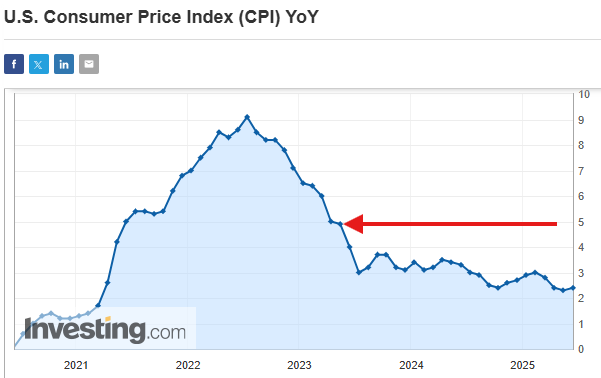
In fact, according to JP Morgan estimates, a closure of the Strait of Hormuz could send oil prices to $120-$130/barrel.
This would imply a spike in US CPI inflation to ~5%.
The last time we saw US inflation at 5% was in March 2023, when the Fed was aggressively hiking rates.
This would imply a spike in US CPI inflation to ~5%.
The last time we saw US inflation at 5% was in March 2023, when the Fed was aggressively hiking rates.
As we recently outlined in a thread, energy prices tie DIRECTLY into CPI inflation.
According to a Fed study, every $10 rally in oil prices has the ability to increase inflation by 20 bps.
Oil prices are already up ~$20 from their April lows, potentially adding ~40 bps to CPI.
According to a Fed study, every $10 rally in oil prices has the ability to increase inflation by 20 bps.
Oil prices are already up ~$20 from their April lows, potentially adding ~40 bps to CPI.

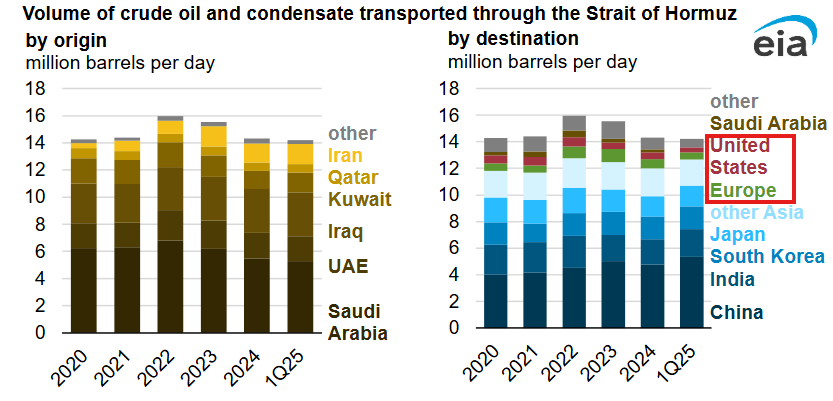
Below is a breakdown of the origin and destination of oil exports through the Strait of Hormuz.
In 2024, exports of crude and condensate from Saudi Arabia accounted for 38% of total Hormuz crude flows (5.5 million b/d).
Even the US and EU receive oil from this passage.
In 2024, exports of crude and condensate from Saudi Arabia accounted for 38% of total Hormuz crude flows (5.5 million b/d).
Even the US and EU receive oil from this passage.
The next question is, why not take a different route?
Hormuz is the only sea outlet for oil-producing countries like Kuwait, Qatar, Bahrain, and much of Saudi Arabia's production.
This means these countries have no OTHER direct path other than pipelines, which are limited.
Hormuz is the only sea outlet for oil-producing countries like Kuwait, Qatar, Bahrain, and much of Saudi Arabia's production.
This means these countries have no OTHER direct path other than pipelines, which are limited.
Estimates show that ~6.5-7.5 million barrels per day of production could be rerouted through pipelines.
But, this is still a ~65% drop in production, or ~13% of global supply.
Some estimates show oil prices rising as high as $150-$200/barrel if a prolonged closure occurs.
But, this is still a ~65% drop in production, or ~13% of global supply.
Some estimates show oil prices rising as high as $150-$200/barrel if a prolonged closure occurs.
And, oil markets have already been partially pricing this in.
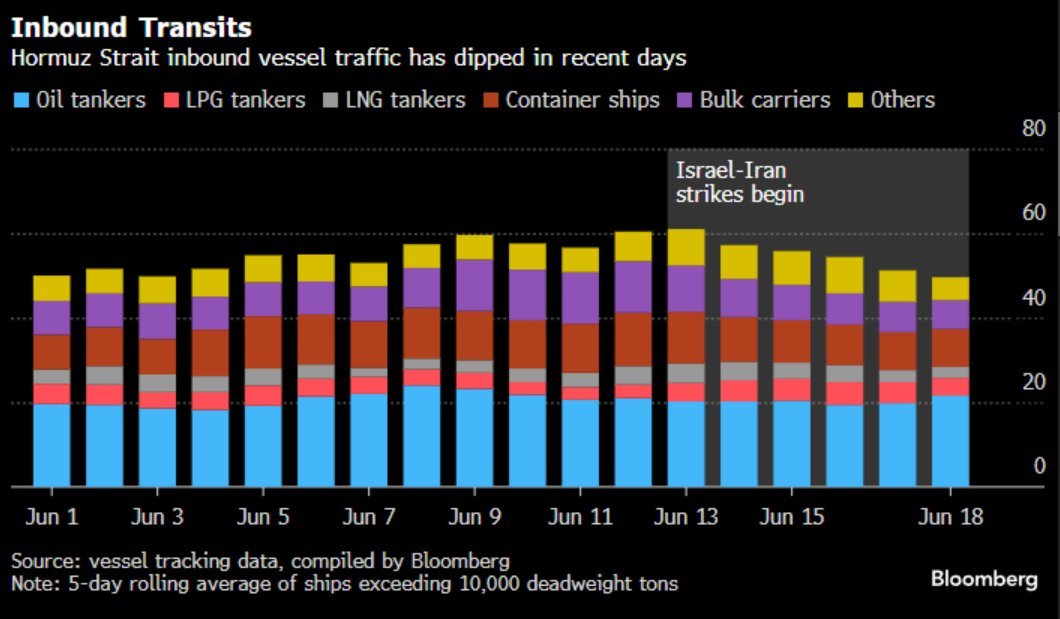
As seen below, shipments in the Hormuz Strait have been steadily declining since June 13th.
However, this is nowhere near a shutdown which is by far the worst case scenario.
Rate hikes could return if this happens.
As seen below, shipments in the Hormuz Strait have been steadily declining since June 13th.
However, this is nowhere near a shutdown which is by far the worst case scenario.
Rate hikes could return if this happens.
With that said, all eyes are now on Iran's top security council.
Even after their decision, final authority rests with Supreme Leader Khamenei, who must approve it.
If Iran formally votes to initiate the closure, then we will see the first legal closure in 50+ years.
Even after their decision, final authority rests with Supreme Leader Khamenei, who must approve it.
If Iran formally votes to initiate the closure, then we will see the first legal closure in 50+ years.
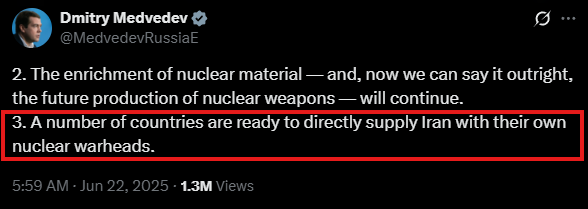
Furthermore, Russia is adding more fuel to the geopolitical fire.
Medvedev this morning says a number of countries are ready to supply Iran with nuclear warheads.
He also claims that future production of Iranian nuclear weapons will continue as a result of US strikes.
Medvedev this morning says a number of countries are ready to supply Iran with nuclear warheads.
He also claims that future production of Iranian nuclear weapons will continue as a result of US strikes.
This week, volatility in equities, commodities, and bonds will return.
Volatility in 2025 remains an exceptional opportunity for traders.
Want to see how we are trading it?
Subscribe to access our premium analysis and alerts at the link below:
thekobeissiletter.com/subscribe
Volatility in 2025 remains an exceptional opportunity for traders.
Want to see how we are trading it?
Subscribe to access our premium analysis and alerts at the link below:
thekobeissiletter.com/subscribe
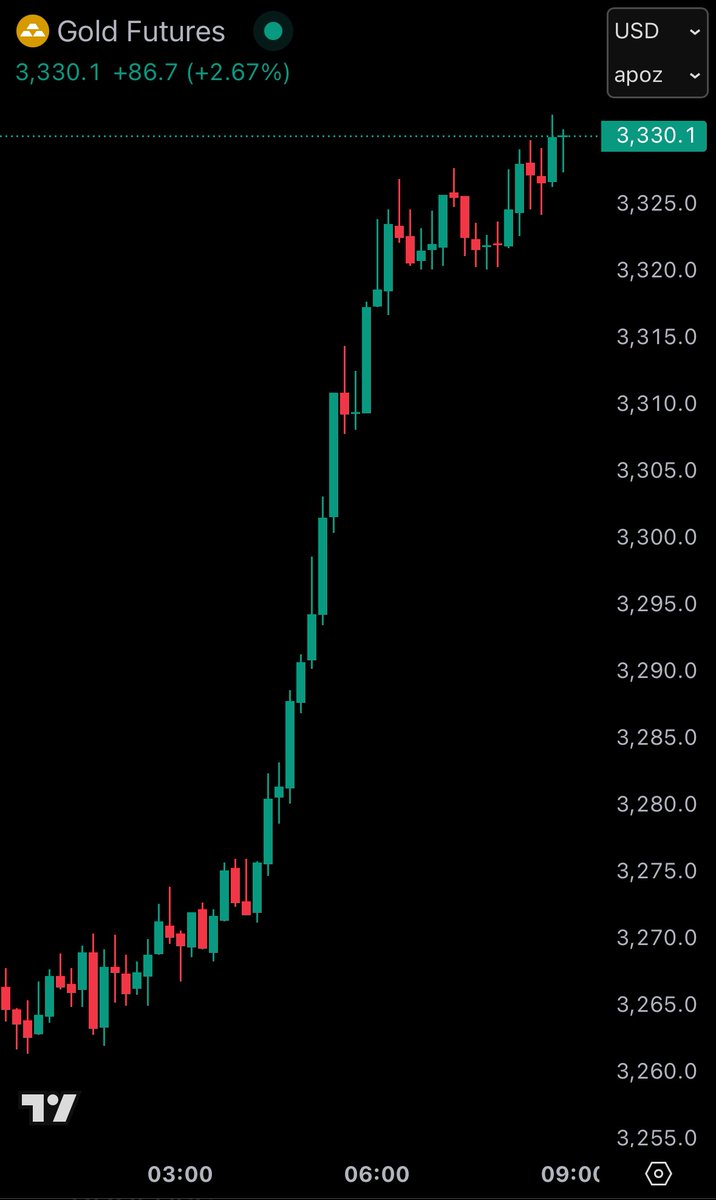
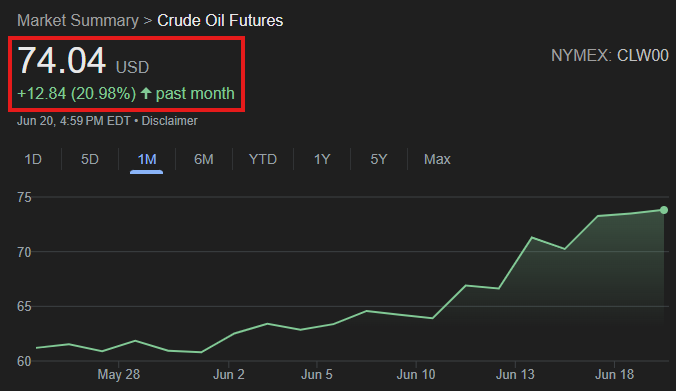
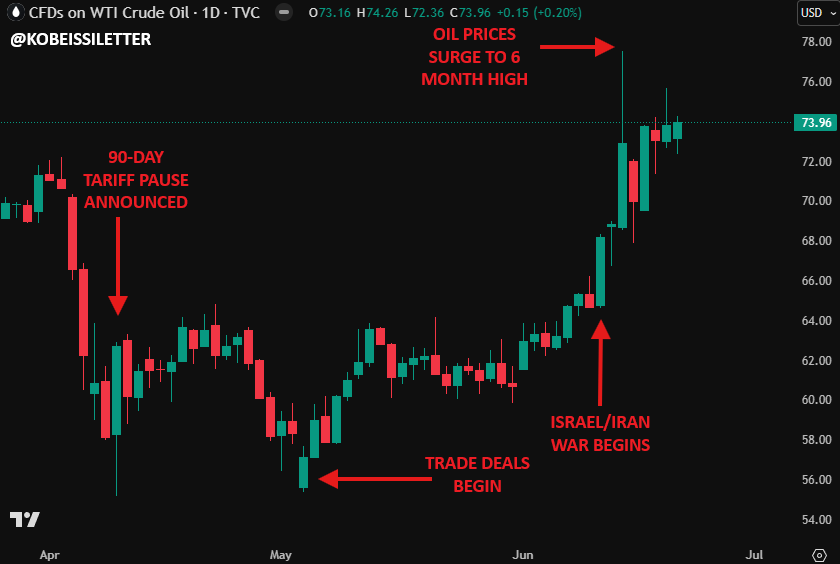
Since the April 9th low, oil prices are up a massive +35%.
This does not account for this weekend's events, as markets are closed.
Inflation and geopolitical tensions will now be the primary market drivers.
Follow us @KobeissiLetter for real time analysis as this develops.
This does not account for this weekend's events, as markets are closed.
Inflation and geopolitical tensions will now be the primary market drivers.
Follow us @KobeissiLetter for real time analysis as this develops.
• • •
Missing some Tweet in this thread? You can try to
force a refresh