A new preprint has posted online assessing potential safety signals for pregnancy loss after mRNA vaccination during pregnancy using Israeli electronic health records (EHR data), with first author @joshg99 and senior author @RetsefL (newly appointed member of CDC's ACIP).
Their primary conclusions were that pregnant women vaccinated for COVID in the second half of the first trimester (wk8-13) had greater observed pregnancy loss rates than expected from the pre-pandemic regression model computable from EHR.
They also found that pregnant women vaccinated for COVID in the second trimester (wk14-27) and pregnant women vaccinated for flu from wk8-13 or wk14-27 had significantly lower-than-expected observed pregnancy loss rates during the pandemic,
and that women vaccinated for COVID or flu before pregnancy had slightly lower-than-expected pregnancy loss rates. They attribute these results to residual confounding (i.e. healthy vaccinee effect HVE)
The paper is exceptionally well written and introduces a rigorous approach for identifying potential safety signals from EHR data, an active reporting approach that avoids the key limitations of passive reporting systems (like VAERs in USA, AEFI in Israel): (1) reporting bias and (2) the lack of control group.(poorly understood limitations of these systems that I have harped upon ad nauseum on social media)
However, the paper has some key omissions that limit the ability to carefully interpret the results, including:
1. Failure to investigate and fully account for pandemic-related calendar time varying confounders.
2. Lack of assessment of whether women remaining unvaccinated throughout pregnancy during the pandemic had higher- or lower-than expected pregnancy loss.
3. No assessment of whether COVID-19 infections later in pregnancy were factors in post-vaccination pregnancy losses, especially for the primary cohorts.
4. Incomplete summary of results of vaccination before pregnancy
5. Lack of assessment of whether women vaccinated before week 8 of their pregnancy had higher- or lower-than-expected pregnancy loss.
6. Lack of summary of which type of pregnancy loss outcomes (spontaneous abortion, induced abortion, stillbirth) dominated the events for each modeled cohort.
The authors’ observed-expected analysis approach could be readily applied to perform each of these suggested analyses.
Given that the primary vaccinated subgroups driving their conclusions are very small (e.g. 1st dose wk8-13 cohort being 1.9% of pregnancies and 1.8% of pregnancy losses) and with pregnancies during specific times during the pandemic (e.g. ~90% of 1st dose wk8-13 having last menstrual period (LMP) between 10/2020 and 1/2021), there is concern for remaining residual confounding in these cohorts, from pandemic-related or medically-related confounders, and these analyses could shed more light on whether this concern is significant or not.
The inclusion of these results would provide a more complete and transparent picture of potential COVID vaccine effects on pregnancy loss.
It is not valid to dismiss any results showing lower-than-expected pregnancy loss in vaccinated subgroups as driven by residual confounding (by claiming HVE) without acknowledging that the higher-than-expected pregnancy loss in one small vaccinated subgroup (covid vaccinated wk8-13) could similarly be driven by residual confounding.
This thread will walk through the key details of their study and results, and elaborate some on these concerns.

This paper (see link below) sets out to investigate whether there is a potential safety signal for pregnancy loss when vaccinated pregnant women for COVID-19 during the pandemic.
Their study is based on electronic health record (EHR) data from Maccabbi, one of four HMO’s in Israel, accounting for 26% of the Israeli population.
As mentioned above, this qualifies as an active reporting system study of vaccine safety that is much more rigorous than passive reporting systems (e.g. VAERs in USA or AEFI in Israel), since the EHR contains events for control groups and does not have the same highly variable reporting bias.
medrxiv.org/content/10.110…
Their endpoint of interest was pregnancy loss, which includes 3 outcomes:
1. Spontaneous abortion
2. Induced abortion (elective or medically-indicated)
3. Stillbirth.
All of their analysis were done on the pooled endpoint, not split out by each outcome.
They mentioned that the EHR lacked evidence for whether induced abortions were elective or medically indicated.
1. Spontaneous abortion
2. Induced abortion (elective or medically-indicated)
3. Stillbirth.
All of their analysis were done on the pooled endpoint, not split out by each outcome.
They mentioned that the EHR lacked evidence for whether induced abortions were elective or medically indicated.
Their primary analysis involved investigation of four vaccination cohorts based on two time periods (second half of first trimester, wk8-13; and second trimester, wk14-27) and 2 vaccination doses (1st dose, 3rd dose):
1. Given 1st dose COVID-19 vaccine during the pandemic while pregnant at gestational age wk8-13.
2. Given 1st dose COVID-19 vaccine during the pandemic while pregnant at gestational age wk14-27.
3. Given 3rd dose COVID-19 vaccine during the pandemic while pregnant at gestational age wk8-13.
4. Given 3rd dose COVID-19 vaccine during the pandemic while pregnant at gestational age wk14-27.
Their analysis considered all pregnancies documented in the EHR with last menstrual period (LMP) dates between March 1, 2020 and February 28, 2022.
Their primary comparison involved comparison of the observed event rates in these cohorts with expected event rates computed from a historical pre-pandemic cohort.
Specifically, they built a logistic regression model based on pregnancies in the EHR with LMPs between March 1, 2016 and February 28, 2018, to compute risk of pregnancy loss demographic and clinical factors available in the EHR including age, socioeconomic status, past flu vaccination, co-morbidities (0, 1-3, 4+), district of residency, and ethno-religious sector, and calendar month of last LMP.
Specifically, they built a logistic regression model based on pregnancies in the EHR with LMPs between March 1, 2016 and February 28, 2018, to compute risk of pregnancy loss demographic and clinical factors available in the EHR including age, socioeconomic status, past flu vaccination, co-morbidities (0, 1-3, 4+), district of residency, and ethno-religious sector, and calendar month of last LMP.

They also included gestation week in their model to account for the fact that probability of pregnancy loss is greatest at early gestational ages and decreases throughout the pregnancy, and this allows them to assess the probability of pregnancy loss as a function of current gestational time.
This is a critical and unique aspect of their modeling that gives their approach significant advantages over most other papers studying pregnancy loss.
This is a critical and unique aspect of their modeling that gives their approach significant advantages over most other papers studying pregnancy loss.

To compute the “expected” baseline number of pregnancy losses for a particular cohort of individuals, they simply compute the probability of pregnancy loss for each individual in the cohort based on their gestational age and covariates from the EHR, and sum over all individuals.
By comparing the observed number of pregnancy losses, with the expected, one can assess whether the observed pregnancy losses are greater or lower than expected, with significantly greater number indicating a potential safety signal.
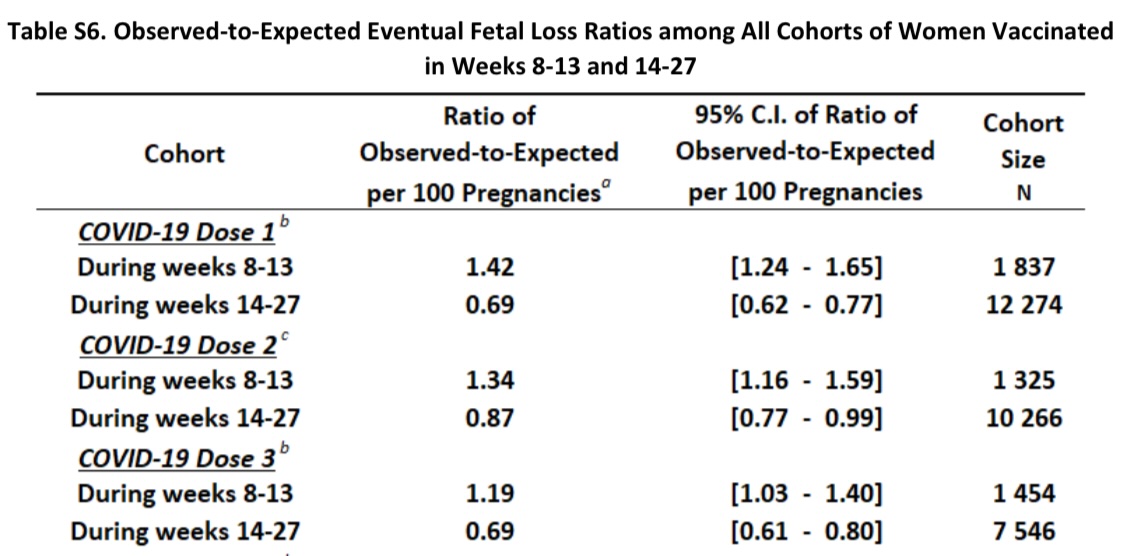
They present absolute differences of observed-expected in the main paper and present relative observed/expected ratios in the supplement (Table S6).
By comparing the observed number of pregnancy losses, with the expected, one can assess whether the observed pregnancy losses are greater or lower than expected, with significantly greater number indicating a potential safety signal.
They present absolute differences of observed-expected in the main paper and present relative observed/expected ratios in the supplement (Table S6).
Here are their primary results.
They found:
1. Women given 1st dose of COVID vaccine in 2nd half of 1sttrimester (wk8-13) had greater-than-expected pregnancy loss
2. Women given 3rd dose of COVID vaccine in 2nd half of 1st trimester (wk8-13) had greater-than expected pregnancy loss
3. Women given 1st dose of COVID vaccine in 2nd trimester (wk14-27) had lower-than-expected pregnancy loss
4. Women given 3rd dose of COVID vaccine in 2nd trimester (wk14-27) had lower-than-expected pregnancy loss.
They considered the wk8-13 results a potential safety signal, but dismissed the wk14-27 results as resulting from healthy vaccinee effect (HVE), a specific type of residual (unmeasured) confounding.

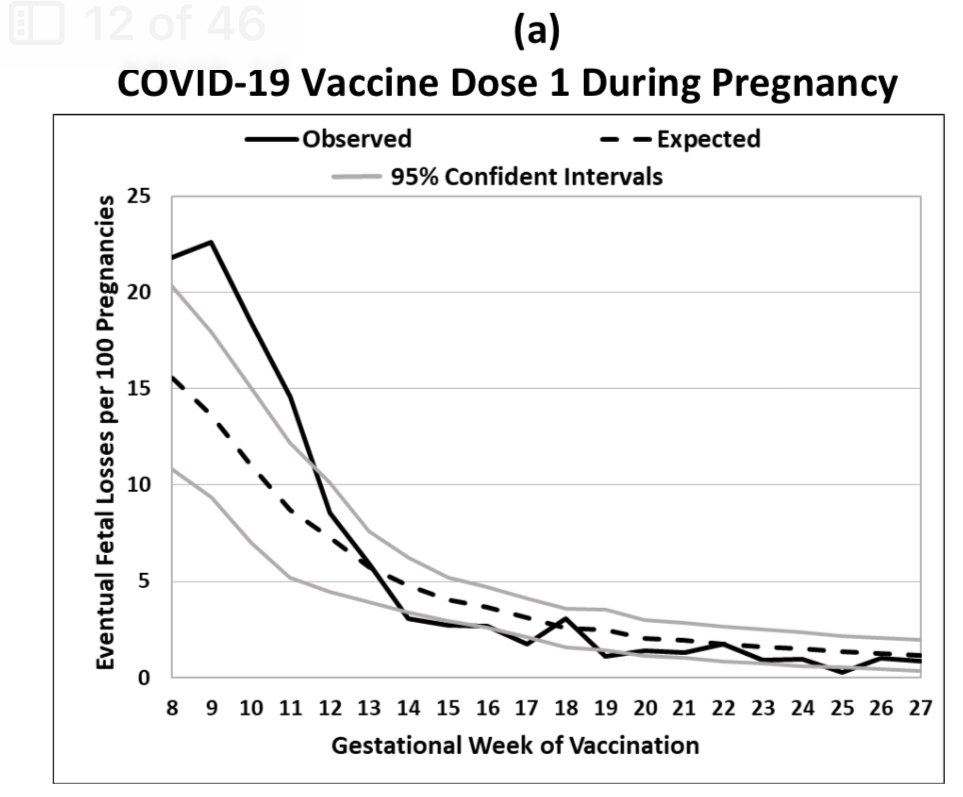
They also computed the observed and expected pregnancy losses by gestation week of vaccination between weeks 8 and 27.
Note that for the 1st COVID vaccinated, the observed is generally greater than expected for most weeks between wk8 and wk13, and at the lower end of expected or lower than expected for most weeks between wk14 and wk27.
Since there was no pre-specified protocol or analysis plan shared, it is not clear whether they prespecified the wk8-13 and wk14-27 cohorts or whether they grouped the weeks with similar effects in the same cohorts (which would raise some concerns about hidden multiplicities)
For the 3rd COVID vaccinated, they observed higher than expected observed pregnancy losses for weeks 9, 12, and 13, and at the lower end of expected or lower than expected for weeks 19, 20, and 22-24.

To assess whether the greater-than-expected pregnancy losses in the wk8-13 vaccinated groups were driven by earlier or later pregnancy losses, they separately computed the observed and expected pregnancy losses
1. After week 14
2. After week 20
3. After week 25.
They found that both early and later-pregnancy losses were evident in the analysis.
1. After week 14
2. After week 20
3. After week 25.
They found that both early and later-pregnancy losses were evident in the analysis.

The historical baseline model provides a confounder-adjusted control against which to compare the observed pregnancy losses for the vaccinated cohorts.
However, note that the “expected” baseline computed from pre-pandemic historical controls do not adjust for any pandemic-level confounders.
Thus, any pandemic factors potentially increasing risk of pregnancy loss, including COVID-19 infections, lockdowns, reduced activity levels, reduced healthcare access or utilization, or high stress, could also result in a greater-than-expected pregnancy loss, but are not accounted for in the modeling.
Additionally, the historical baseline risk model only incorporated limited medical variables on a coarse scale (e.g. 0, 1-3, 4+ comorbidities without distinguishing minor from major comorbidities), which further highlights another potential source of residual confounding.
As a result, the use of the historical control does not eliminate the risk of residual confounding, whether from pandemic-related or personal medical factors.
Residual confounding between vaccinated and unvaccinated groups is often referred to as “HVE”, but of course that is not the only source of residual confounding.
Thus, one should not automatically dismiss any lower-than-expected results in a vaccinated cohort as an artifact of HVE, while failing to acknowledge that any higher-than-expected result in a vaccinated cohort might also be driven by residual confounding.
For this reason, it is important to consider other control analyses to assess potential residual confounding, and carefully consider all of them when evaluating results.
One control group they included was flu-vaccinated women during the pandemic.
They constructed cohorts of women given influenza vaccine during the pandemic
1. Wk8-13 (2nd half of 1sttrimester)
2. Wk14-27 (2nd trimester).
They computed the same observed-expected analysis as for the primary cohorts, and presented the results.
They found lower-than-expected pregnancy loss for both the Wk8-13 and Wk14-27 cohorts, so did not see the higher-than-expected results that was obtained for the Wk8-13 COVID-19 cohorts.
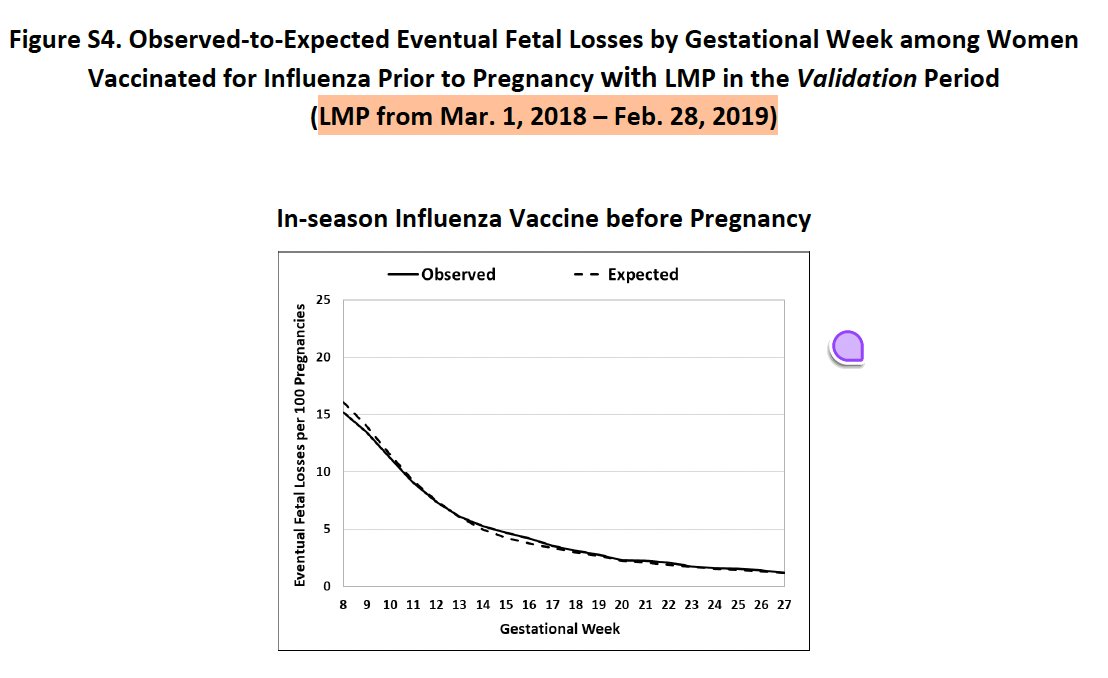
They repeated the analysis for flu-vaccinated at gestational age wk8-13 and wk14-27 in a pre-pandemic cohort (March 1, 2018-February 29, 2019), and similarly found lower-than-expected pregnancy loss in the flu-vaccinated cohorts.
They constructed cohorts of women given influenza vaccine during the pandemic
1. Wk8-13 (2nd half of 1sttrimester)
2. Wk14-27 (2nd trimester).
They computed the same observed-expected analysis as for the primary cohorts, and presented the results.
They found lower-than-expected pregnancy loss for both the Wk8-13 and Wk14-27 cohorts, so did not see the higher-than-expected results that was obtained for the Wk8-13 COVID-19 cohorts.
They repeated the analysis for flu-vaccinated at gestational age wk8-13 and wk14-27 in a pre-pandemic cohort (March 1, 2018-February 29, 2019), and similarly found lower-than-expected pregnancy loss in the flu-vaccinated cohorts.


They considered these results artifacts of HVE.
Since they were pregnant during the pandemic, this cohort shares some of the same pandemic-level factors as the covid-vaccinated cohorts, and thus provides some evidence the covid vaccinated results were not simply functions of broad pandemic-level confounding.
However, given the different timing of the covid and flu vaccinations during the pandemic, and the potentially different medical profiles of these cohorts, it is still possible that there are unmeasured confounders between the covid and flu vaccinated cohorts.
Consideration of other control groups to assess pandemic-related calendar time confounders, including unvaccinated controls during the pandemic, could have been done and provided a more complete picture of this concern.
1. Unmeasured pandemic-related calendar time confounders: Their use of pre-pandemic historical controls means that, in their observed-expected analysis, any pandemic-related factors potentially affecting pregnancy loss are confounded with vaccination status.
It is likely that these potential confounding factors, which could include factors such as lockdowns, inactivity, reduced health care access and utilization, stress, and covid exposures and infections, vary by calendar time in the pandemic, so could be manifest as a calendar-time bias.
Their inclusion of flu-vaccinated controls during the pandemic partially addresses this concern, but given the flu and covid vaccinations were done during different times of the pandemic, there could still be substantial residual confounding.
Given that the primary cohort driving the author's conclusions, women COVID vaccinated during gestational weeks 8-13, are such small cohorts, there is significant potential for unmeasured confounding to be a major factor.
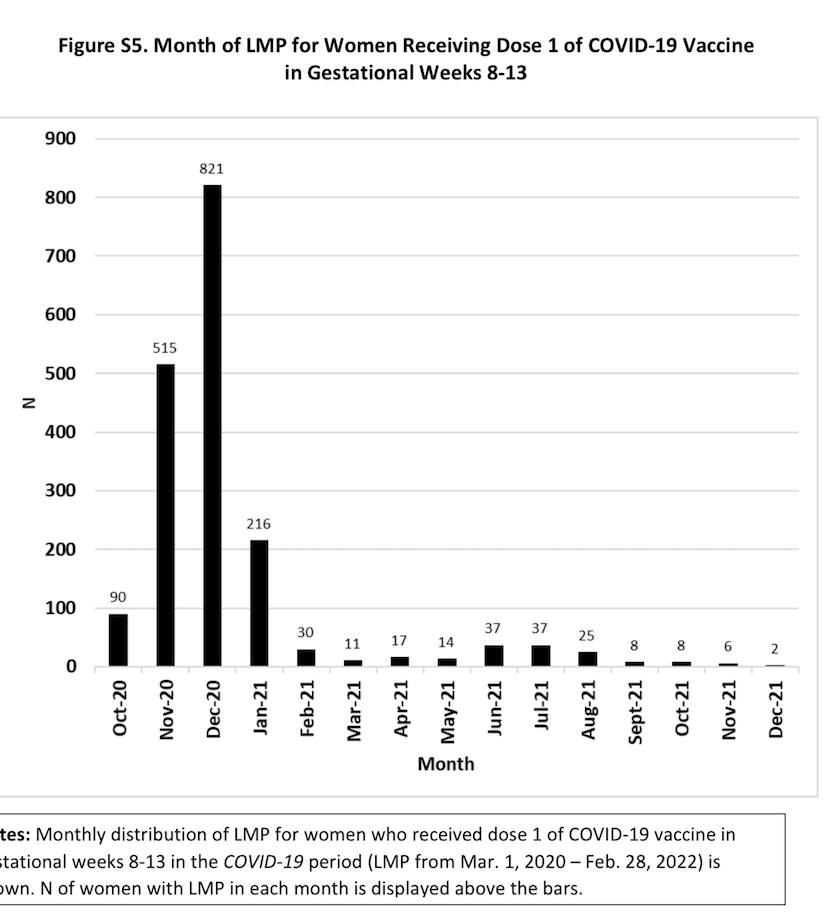
In particular, the cohort given 1st COVID dose wk8-13 included only 1837/94,351 = 1.9% of pregnancies, and 240/13,124 = 1.8% of pregnancy losses, and ~90% of these pregnancies had LMD between October 2020 and January 2021 (Figure S5), a specific time period with particular factors (lockdowns, Delta variant covid exposure late in pregnancy)
Further investigation of these pandemic-related calendar time effects is warranted, in the 1st dose covid-vaccinated, 3rd dose vaccinated, and flu-vaccinated cohorts (which had substantially different LMD calendar time distributions).
It is likely that these potential confounding factors, which could include factors such as lockdowns, inactivity, reduced health care access and utilization, stress, and covid exposures and infections, vary by calendar time in the pandemic, so could be manifest as a calendar-time bias.
Their inclusion of flu-vaccinated controls during the pandemic partially addresses this concern, but given the flu and covid vaccinations were done during different times of the pandemic, there could still be substantial residual confounding.
Given that the primary cohort driving the author's conclusions, women COVID vaccinated during gestational weeks 8-13, are such small cohorts, there is significant potential for unmeasured confounding to be a major factor.
In particular, the cohort given 1st COVID dose wk8-13 included only 1837/94,351 = 1.9% of pregnancies, and 240/13,124 = 1.8% of pregnancy losses, and ~90% of these pregnancies had LMD between October 2020 and January 2021 (Figure S5), a specific time period with particular factors (lockdowns, Delta variant covid exposure late in pregnancy)
Further investigation of these pandemic-related calendar time effects is warranted, in the 1st dose covid-vaccinated, 3rd dose vaccinated, and flu-vaccinated cohorts (which had substantially different LMD calendar time distributions).
2. No analysis of pregnancy loss for unvaccinated women during the pandemic: An assessment of whether pregnant women remaining unvaccinated throughout their pregnancy during the pandemic have higher- or lower-than-expected pregnancy loss would provide valuable information about these potential pandemic-related residual confounders.
The authors explain why they did not consider formal trial emulation design matching pregnant women in wk8-13 with women not vaccinated at that time and tracking the pairs over time for pregnancy loss events. While more rigorous in estimating potential causal effects of vaccination, they explained this would not be feasible, lacking the required sample size, especially to investigate their small, select wk8-13 vaccinated cohort.
However, they could easily repeat their observed-expected analysis on various unvaccinated cohorts to assess whether they have higher- or lower-than-expected pregnancy loss during the pandemic.
Repeating these analyses separately for cohorts of unvaccinated pregnant women, with LMPs matching their various vaccination cohorts determined by vaccination time (8-13wk, 14-27wk, pre-pregnancy) and dose (COVID 1st dose, COVID 3rd dose, flu) would provide a valuable control group with the same pandemic-related calendar time confounding as the various vaccination cohorts.
If the various unvaccinated cohorts had similar pregnancy loss relative to expected, then this would provide assurance that pandemic-related calendar time confounding is not a major issue, while if they were, then it would provide some context to consider when interpreting the primary analysis results.
3. No assessment of whether COVID-19 infections later in pregnancy were factors in post-vaccination pregnancy losses: The authors performed a useful analysis showing women with COVID-19 infections in wk8-13 or wk14-27, either vaccinated or unvaccinated, did not have higher-than-expected pregnancy loss.
However, they did not investigate the effect of COVID-19 infections later in pregnancy, nor did they summarize whether pregnancy losses in their primary analysis cohorts occurred more often in women who eventually became infected.
They could easily summarize number of COVID-19 infections in subsets of their vaccination cohorts with and without pregnancy losses, and if no association is evident this would provide more convincing evidence COVID-19 infection is not an unmeasured confounder affecting the results.
Note that the cohort of women receiving 1st dose at gestational age 8-13wk, vast majority of whom had LMP 10/20-1/21, would have experienced the Delta COVID-19 wave hitting Israel between 4/21 and 7/21 late in their pregnancies.
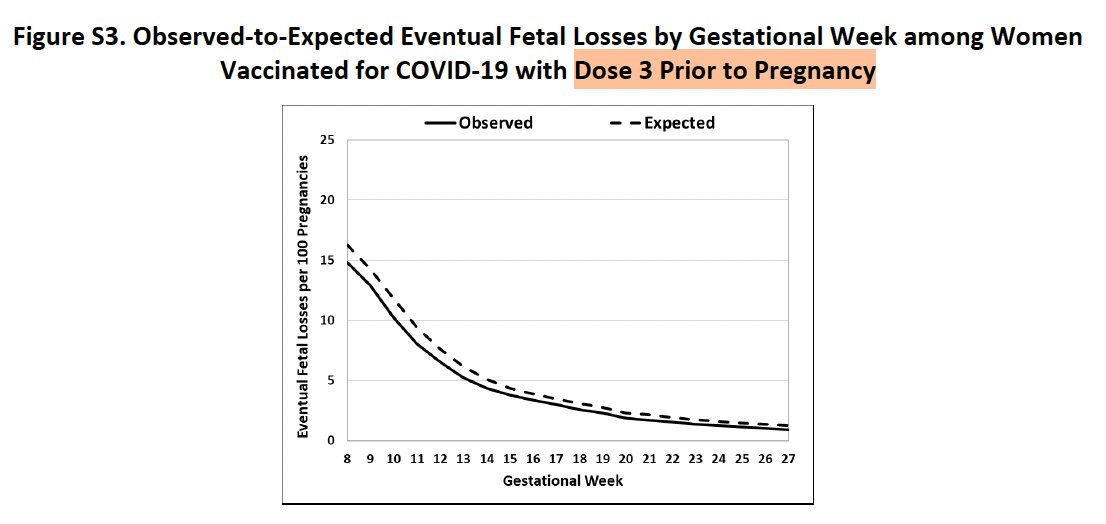
4. Incomplete summary of results of vaccination before pregnancy: Their paper provided a cursory look at observed and expected pregnancy loss rates for women vaccinated for COVID-19 or flu before pregnancy as a function of gestational week.
This suggested slightly lower-than-expected pregnancy loss rates in these subgroups, but the huge y-axis scale makes it difficult to see the magnitude of the difference or its potential significance.
They did not present tables aggregating observed and expected pregnancy loss after weeks 8, 14, 20, or 25, as was done for the vaccination cohorts.
They could easily provide such tables, which would add important contextual information to the paper.

5. Assess wk1-7: They did not assess whether pregnancy loss in those vaccinated in the first half of the first trimester (before wk8) was lower or greater than expected, which would provide a more complete assessment of potential risks of early-pregnancy COVID vaccination.
They mention that pregnancies in wk1-7 have more inconsistent identification and follow-up times, but this is true for all cohorts, vaccinated and unvaccinated cohorts during the pandemic as well as the pre-pandemic cohorts used to compute vaccination rate.
And although not able to accurately measure pregnancy loss from miscarriages in the first half of the first trimester, there is no reason why they could not perform a valid observed-expected analyses for the various vaccination cohorts for pregnancy loss at the time periods used in their primary and secondary analyses (after 8, 14, 20, or 25 weeks).
This is important to investigate, given the title of the paper says “during early pregnancy”, so will be interpreted by many as finding greater-than-expected risk for women vaccinated anytime early in pregnancy, including <8wk, as well.
6. Summarize pregnancy loss types: Their results are all based on the aggregated “pregnancy loss” outcome comprised of spontaneous abortions, induced abortions, and stillbirths.
While there is rationale for combining these events for formal analysis, they could easily include a table listing the number of pregnancy losses at the various time points (after week 8, 14, 20, 25) for the various cohorts split out by outcome, so one could see how many of the pregnancy losses were stillbirth, induced abortion, or spontaneous abortion events.
While there is rationale for combining these events for formal analysis, they could easily include a table listing the number of pregnancy losses at the various time points (after week 8, 14, 20, 25) for the various cohorts split out by outcome, so one could see how many of the pregnancy losses were stillbirth, induced abortion, or spontaneous abortion events.
Conclusion:
This paper provides a model for how to perform rigorous active reporting vaccine safety studies to identify potential safety signals from EHR data — the data and study are exceptionally done and paper clearly written.
Their primary conclusion is what those pregnant women Covid vaccinated at second half of first trimester (wk8-13) had observed pregnancy loss rates higher than expected rate computed from pre-pandemic regression model involving various factors computable from EHR, which they considered a potential safety signal for these vaccines.
They found no such increased risk in flu vaccinated during or prior to the pandemic, and found the greater-than-baseline risk in this cohort included both early and late pregnancy loss, which gave them greater confidence in their results.
Their analyses also found significantly lower-than-expected risk of pregnancy loss for women COVID vaccinated in the second trimester (wk14-27) and slightly lower-than-expected risk in women COVID vaccinated before pregnancy, but the authors dismissed these results as artifacts of residual confounding (HVE)
It is not valid to dismiss any results showing lower-than-expected pregnancy loss in vaccinated subgroups as driven by residual confounding (HVE), without acknowledging that the higher-than-expected pregnancy loss in one small vaccinated subgroup (covid vaccinated wk8-13) could similarly be driven by residual confounding.
The strength of their conclusions is limited by their failure to consider other types of controls that would more carefully investigate residual confounding from pandemic-related and other factors, including unvaccinated controls during the pandemic, as well as their failure to provide more details on the pregnancy loss outcomes for women vaccinated before pregnancy and those vaccinated in the first half of the first trimester (before week 8).
Inclusion of these results would provide a more complete and transparent picture of potential COVID vaccine effects on pregnancy loss.
Btw I was looking at the wrong plot when I discussed the 3rd dose wk8-13 cohort
It appears to be almost wholly driven by resulting week 11 with the other weeks between 8-13 having similar-to-baseline pregnancy loss risk.
So the evidence for safety signal in early pregnancy for 3rd dose is weak.
Thus, their key results are dependent on the single 1st dose wk8-13 cohort, for which >90% had LMP between October 2020 and January 2021 just before rollouts began.
• • •
Missing some Tweet in this thread? You can try to
force a refresh