1/ I'm on vacation through the 4th across the pond - I won't be able to resist labor market tweeting, but will be lighter than usual.
Benchmark for continuing claims on Thursday is 1.925M, but I'd bet it'll be north of 1.955M. Bad news!
2/ On initial claims, the benchmark is 244K. We've been hewing pretty closely to what I've expected on this front - i.e. not seeing clear deterioration on the layoff front in the same way as on the unemployment front.
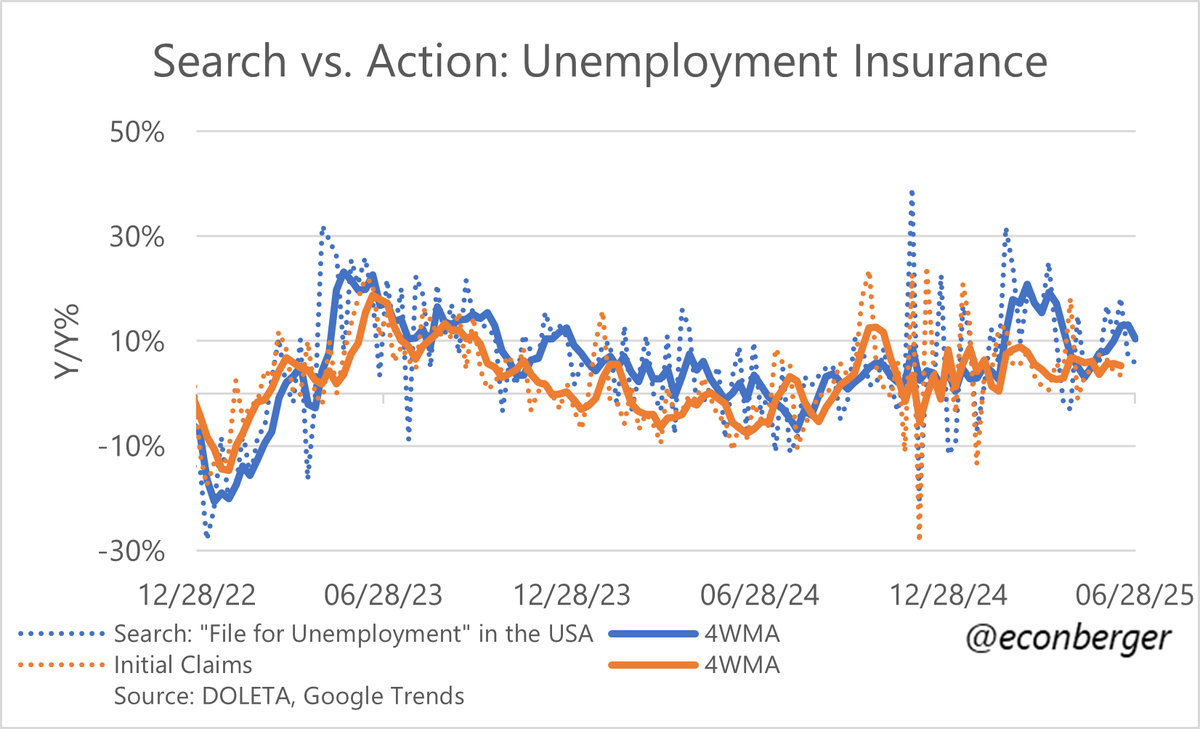
3/ Google Trends data suggest an acceleration in initial claims, and while this has historically functioned as a pretty good nowcast, it generates false positives fairly often for small swings.
• • •
Missing some Tweet in this thread? You can try to
force a refresh
Business Trends & Outlook Survey from the Census Bureau:
1/ Employers are becoming slightly less pessimistic, relative to a year earlier, about future headcount (probably reflecting less-high tariffs).
We haven't seen actual behavior (modestly contractionary) change much since
2/ The improvement in headcount plans (relative to a year ago) is coming from fewer firms planning to cut headcount, and more firms planning to expand it.
Again, they are more pessimistic than 5-6 months ago - but less pessimistic than 1-2 months ago.
3/ A slightly smaller share of employers are currently/recently expanding headcount, relative to a year ago. The share of employers cutting headcount is unchanged relative to a year ago.
1/ TL;DR: We are very likely going to get large negative downward revisions to the growth of non-farm employment in the year from March 2024 to March 2025.
2/ To recap: the QCEW is the source data for the annual benchmark revision to nonfarm payroll employment.
The next benchmark date is March 2025. We'll get a preliminary estimate in late summer. We'll get the final benchmark revision in early February 2026.
3/ As of this morning, we have 3 quarters of the QCEW data that will constitute the benchmark source data.
QCEW data are noisy. They're also, themselves, subject to revisions (more later). So this is speculative based on 3 rather than the full 4 quarters. Nevertheless...
1/ With the reduction in US tariffs on China (from astronomical to very high levels), business hiring plans have become a little less downbeat. (Still more glum than a year ago, but the deficit is smaller.)
2/ This modest improvement in plans is due to more firms planning to increase headcount, and fewer firms planning to cut back.
But it's still true that fewer firms plan to expand than a year ago, and more firms plan to cut back than a year ago.
3/ Firms' current actions aren't as downbeat as their plans. They're only modestly more contractionary than they were a year ago.
That small contraction is coming via a smaller share of firms planning to expand. The share of firms planning to cut back headcount is unchanged.
1/ US firms continue to be very pessimistic about their future headcount, but no change in that pessimism relative to 2 weeks ago.
We're not seeing any leakage, yet, from that pessimism into current action. (Soft data & hard data agree.)
2/ The deterioration in employer headcount expectations has come from both a falling share of firms planning to expand, and a rising share of firms planning to cut employment.
(But no additional worsening in the last 2 weeks.)
3/ Relative to a year ago, we see about the same share of firms currently reducing headcount (no surge in layoffs) but a slightly smaller share expanding headcount (lower hiring).
1/ Current conventional wisdom: the split between resilient “hard data” (e.g. government-published series on employment & activity) and weak “soft data” (sentiment surveys).
IMHO this CW is mostly wrong.
2/ Why wrong?
Survey/soft data that corresponds to concrete things people see at present are not that far from the hard data.
Questions about vague vibes, or about the future, look much worse.
Composite headline indices look bad because they mix "present" with vibes/future.
3/ An example of a "vibe" based soft data point is the general activity diffusion index that a lot of the manufacturing PMIs report. What's "general activity"? It's pretty vague. And it looks quite bad in these surveys.