Mastering Advanced MACD Strategies — The Ultimate Trading Thread 🧵
MACD is NOT just about the crossover.
It’s a complete trend + momentum system.
In this thread:
✅ Advanced MACD Strategies
✅ SL, Targets, Timeframes
✅ Indicator Combos
✅ Options & Intraday Setups
Let’s master the real power of MACD 👇
#StockMarketIndia
MACD is NOT just about the crossover.
It’s a complete trend + momentum system.
In this thread:
✅ Advanced MACD Strategies
✅ SL, Targets, Timeframes
✅ Indicator Combos
✅ Options & Intraday Setups
Let’s master the real power of MACD 👇
#StockMarketIndia
1) What Is MACD?
MACD = Trend + Momentum Indicator
💡 Built from EMAs.
Formula:
📌 MACD Line = EMA(12) – EMA(26)
📌 Signal Line = EMA(9) of MACD Line
📌 Histogram = MACD – Signal Line
✅ Cross above Signal Line → Bullish
✅ Cross below Signal Line → Bearish
But that’s just the beginning…
MACD = Trend + Momentum Indicator
💡 Built from EMAs.
Formula:
📌 MACD Line = EMA(12) – EMA(26)
📌 Signal Line = EMA(9) of MACD Line
📌 Histogram = MACD – Signal Line
✅ Cross above Signal Line → Bullish
✅ Cross below Signal Line → Bearish
But that’s just the beginning…

2) Best Timeframes to Use
📍 Intraday: 5 min, 15 min, 1 hour
📍 Swing: 1 hour, Daily
📍 Positional: Daily, Weekly
💡 Multi-timeframe analysis = More reliable
💡 Lower TFs = More noise → filter with volume
📍 Intraday: 5 min, 15 min, 1 hour
📍 Swing: 1 hour, Daily
📍 Positional: Daily, Weekly
💡 Multi-timeframe analysis = More reliable
💡 Lower TFs = More noise → filter with volume

3) Strategy A: MACD Zero Line Rejection
📌 Setup:
MACD pulls back to zero line (EMA 26 and EMA 12 meet)
Bounces off zero → Strong trend continuation
🎯 Entry: Bullish/bearish candle after bounce
❌ SL: Below/Above zero line pullback
🎯 Target: 1.5x–2x risk or next major pivot
💥 Works best in strong trending stocks like HDFCBANK, TCS, NIFTY
📌 Setup:
MACD pulls back to zero line (EMA 26 and EMA 12 meet)
Bounces off zero → Strong trend continuation
🎯 Entry: Bullish/bearish candle after bounce
❌ SL: Below/Above zero line pullback
🎯 Target: 1.5x–2x risk or next major pivot
💥 Works best in strong trending stocks like HDFCBANK, TCS, NIFTY

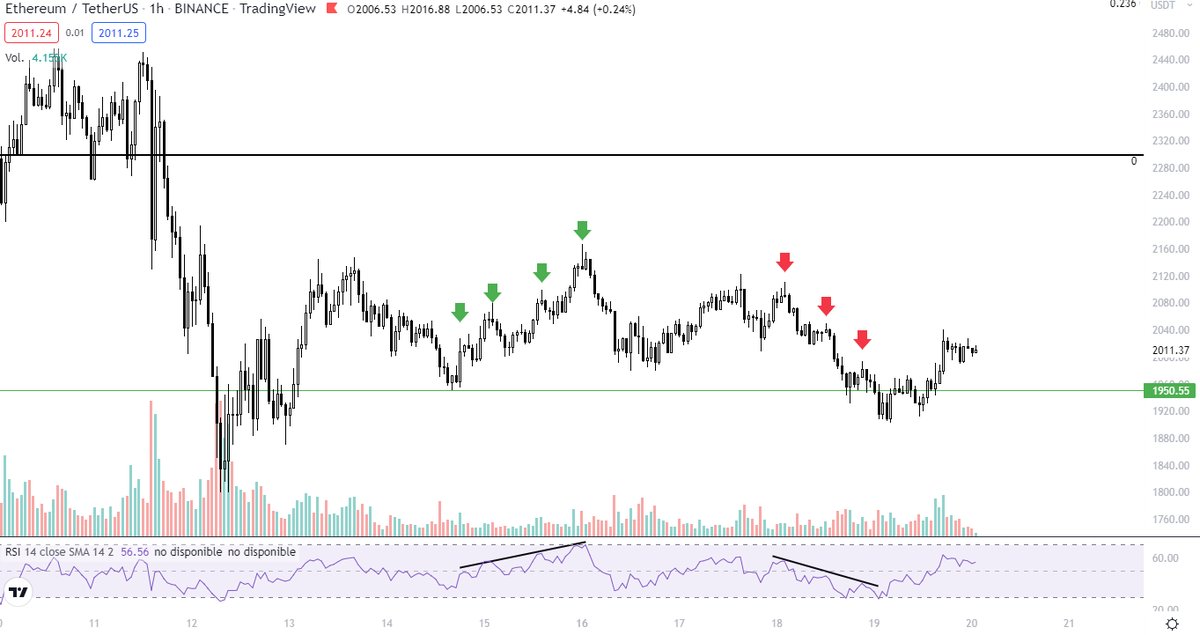
4) Strategy B: MACD Histogram Divergence
📌 Setup:
Price makes new high
MACD Histogram shows lower high → Bearish divergence
Volume starts to fade
🎯 Entry: On breakdown of swing low
❌ SL: Above divergence high
🎯 Target: Midline or Fib retracement
✅ Combine with Bollinger Bands for faster confirmation
📌 Setup:
Price makes new high
MACD Histogram shows lower high → Bearish divergence
Volume starts to fade
🎯 Entry: On breakdown of swing low
❌ SL: Above divergence high
🎯 Target: Midline or Fib retracement
✅ Combine with Bollinger Bands for faster confirmation

5) Strategy C: Multi-Timeframe MACD Alignment
📌 Setup:
MACD cross bullish on Daily + bullish on 1H
Look for 5min/15min pullback entry
🎯 Entry: Lower TF pullback + bullish candle
❌ SL: Below pullback low
🎯 Target: R:R 1:2 or next key resistance
💡 This gives explosive low-risk trades with high probability.
📌 Setup:
MACD cross bullish on Daily + bullish on 1H
Look for 5min/15min pullback entry
🎯 Entry: Lower TF pullback + bullish candle
❌ SL: Below pullback low
🎯 Target: R:R 1:2 or next key resistance
💡 This gives explosive low-risk trades with high probability.

6) Strategy D: MACD False Cross Trap (Reversal)
📌 Setup:
MACD crosses bullish but price rejects near resistance
Immediate cross back below = trap
🎯 Entry: Breakdown of retest candle
❌ SL: Above trap candle high
🎯 Target: 1.5x–2x risk
📈 Best for intraday fades near CPR or key levels
📌 Setup:
MACD crosses bullish but price rejects near resistance
Immediate cross back below = trap
🎯 Entry: Breakdown of retest candle
❌ SL: Above trap candle high
🎯 Target: 1.5x–2x risk
📈 Best for intraday fades near CPR or key levels

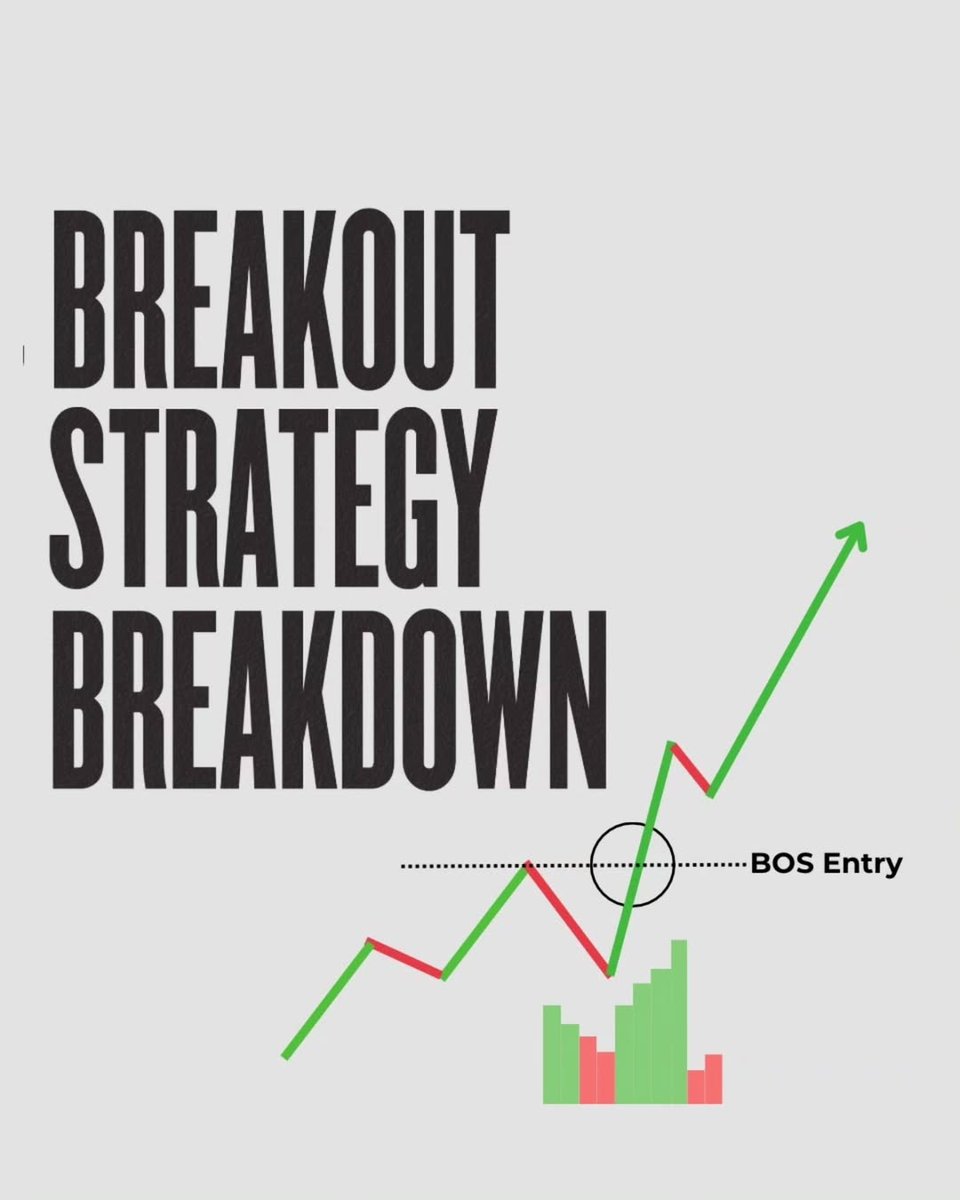
7) Strategy E: MACD Squeeze Breakout
📌 Setup:
MACD lines squeeze tightly near zero
Volume builds → sharp breakout expected
🎯 Entry: Breakout candle with volume spike
❌ SL: Inside squeeze base
🎯 Target: 1.5x–2x width of squeeze
💥 Combine with Bollinger Band squeeze for accuracy
📌 Setup:
MACD lines squeeze tightly near zero
Volume builds → sharp breakout expected
🎯 Entry: Breakout candle with volume spike
❌ SL: Inside squeeze base
🎯 Target: 1.5x–2x width of squeeze
💥 Combine with Bollinger Band squeeze for accuracy

8) MACD + Indicator Combos (Pro Setups)
✅ MACD + VWAP:
– VWAP reclaim + MACD cross = strong intraday signal
✅ MACD + Bollinger Bands:
– BB squeeze + MACD bullish cross = fast breakout
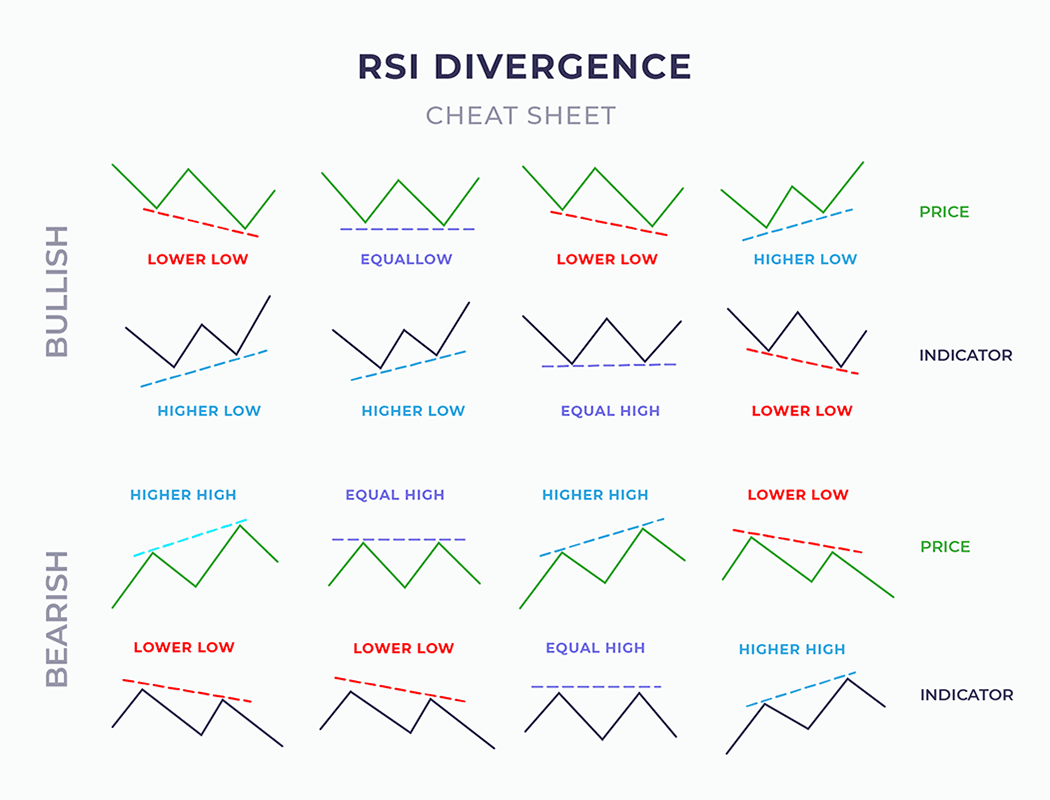
✅ MACD + RSI Divergence:
– RSI confirms divergence → adds reversal power
✅ MACD + EMA 20/50:
– MACD bullish cross near EMA support → trend continuation
✅ MACD + CPR:
– MACD cross + CPR breakout → high conviction trade
✅ MACD + VWAP:
– VWAP reclaim + MACD cross = strong intraday signal
✅ MACD + Bollinger Bands:
– BB squeeze + MACD bullish cross = fast breakout
✅ MACD + RSI Divergence:
– RSI confirms divergence → adds reversal power
✅ MACD + EMA 20/50:
– MACD bullish cross near EMA support → trend continuation
✅ MACD + CPR:
– MACD cross + CPR breakout → high conviction trade
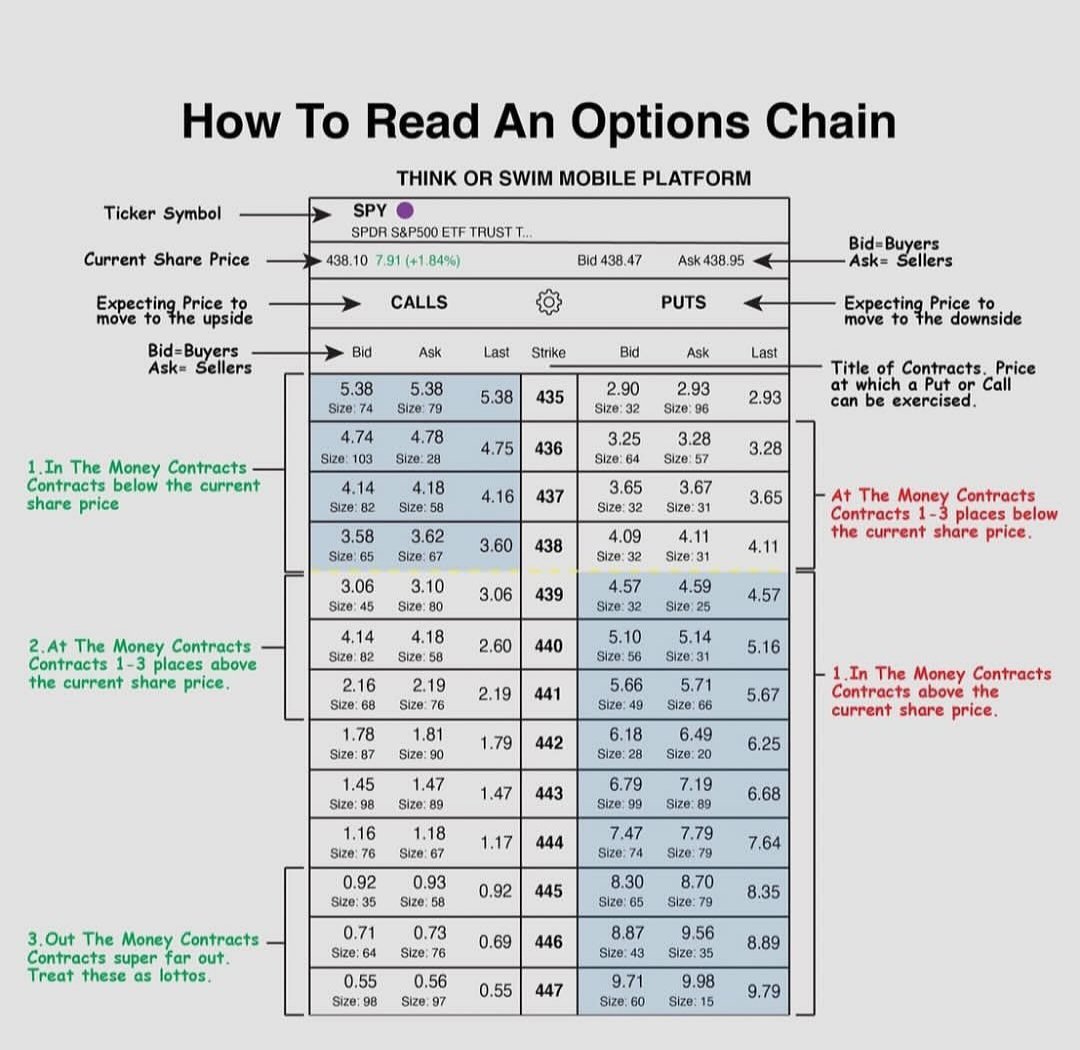
9) Options Trading with MACD
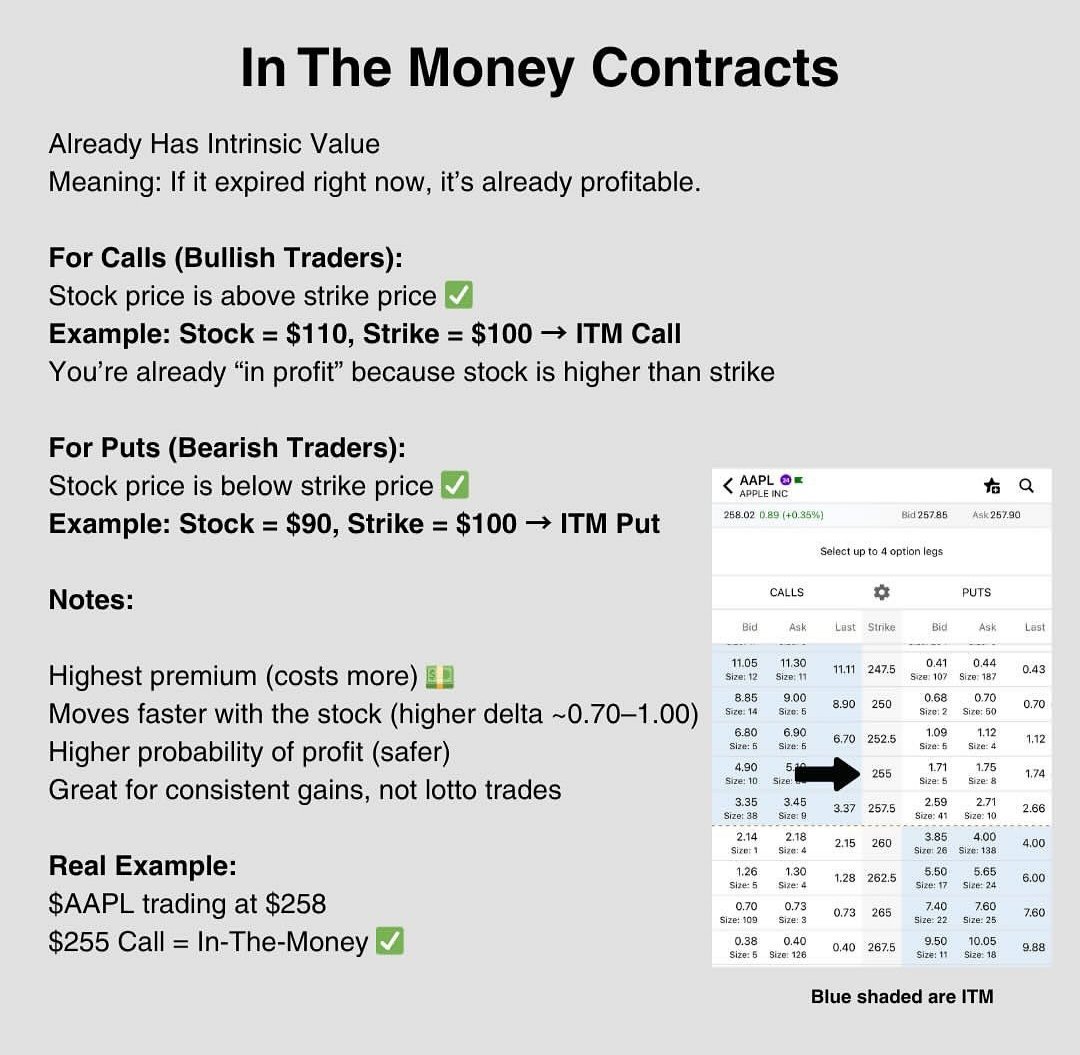
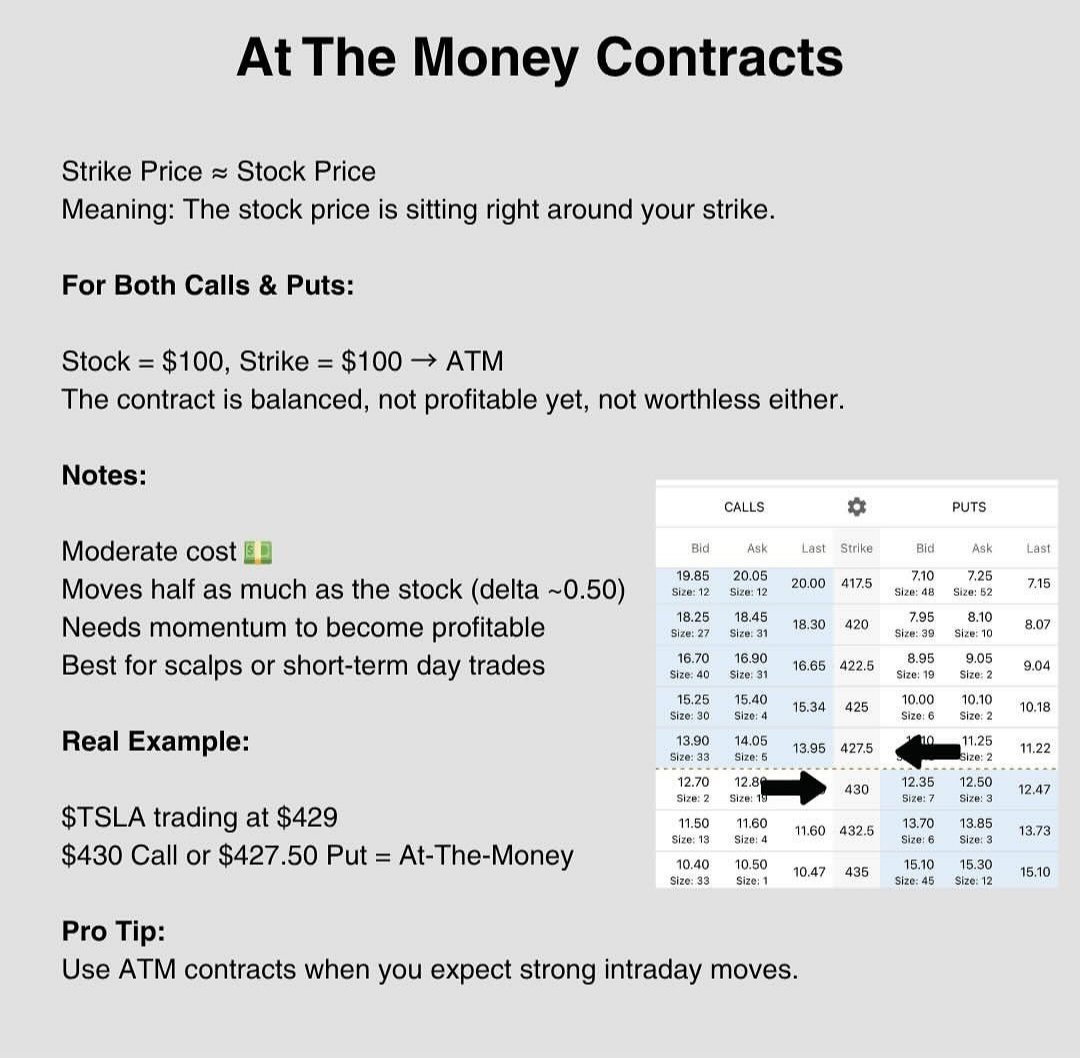
📌 MACD cross bullish → Buy CE near ATM
📌 MACD cross bearish → Buy PE near ATM
✅ SL: 30–35% premium OR below pullback low
✅ Target: 60–100% premium move or next resistance
💡 Avoid options near expiry on slow MACD setups
💡 MACD + VWAP is excellent for BankNifty intraday
📌 MACD cross bullish → Buy CE near ATM
📌 MACD cross bearish → Buy PE near ATM
✅ SL: 30–35% premium OR below pullback low
✅ Target: 60–100% premium move or next resistance
💡 Avoid options near expiry on slow MACD setups
💡 MACD + VWAP is excellent for BankNifty intraday
10) SL, Target, and SL Trailing Plan
✅ Stop Loss Options:
Fixed % of premium (30–35%)
Chart-based → Below pullback low
✅ Target Options:
Next swing high/low
Pivot Points
Fibonacci extensions (127%, 161.8%)
Option price 50–100% move
✅ SL Trailing:
EMA 9 trailing on price
MACD histogram weakening = exit
✅ Stop Loss Options:
Fixed % of premium (30–35%)
Chart-based → Below pullback low
✅ Target Options:
Next swing high/low
Pivot Points
Fibonacci extensions (127%, 161.8%)
Option price 50–100% move
✅ SL Trailing:
EMA 9 trailing on price
MACD histogram weakening = exit
• • •
Missing some Tweet in this thread? You can try to
force a refresh