
Nearly any combination of charts and studies can be combined to create the ideal workspace for trading in Sierra Chart. Some people use 1 chart, some use 20.
In this thread, I'm going step by step build a prop style workspace with a DOM, footprint, depth chart, and more.
🧵
In this thread, I'm going step by step build a prop style workspace with a DOM, footprint, depth chart, and more.
🧵

Firstly, I can't deep dive into all settings. This is a general guide. I do however have more in-depth guides for charts found in this example in my master thread, where I have poured hours and hours into free material:
https://x.com/ZigsOnTheBid/status/1633853380656533504
Let's build: Footprint with delta table, TPO with volume profile, DOM with volume profile, candlestick with key levels, market depth chart, time and sales.
You will need Service Package 5 or higher available from the Sierra Chart website.
You will need Service Package 5 or higher available from the Sierra Chart website.
Let's start with a simple candlestick chart with some key levels in our right margin. This will be our template for other charts when it comes to visual styling.
SC Menu: File > New/Open Intraday Chart. Pick a symbol, press OK.
SC Menu: File > New/Open Intraday Chart. Pick a symbol, press OK.
Go through the Chart > Chart Settings and configure your preferences here. If wanting to have all charts linked so when you change a symbol they all change, set it up in the Linking menu.
In the Bar Period menu of the Chart Settings, I'll change Graph Draw Type to Candlestick Bars.
In the Bar Period menu of the Chart Settings, I'll change Graph Draw Type to Candlestick Bars.
Click Chart > Graphics Settings - Chart > uncheck Use Global Graphics Settings Instead….
Set your background, time and sales colors, candlestick colors, and other settings. In the Fonts menu of that window, I'll change the font to Consolas. Click OK.
Set your background, time and sales colors, candlestick colors, and other settings. In the Fonts menu of that window, I'll change the font to Consolas. Click OK.
Hit F6 or SC Menu: Analysis > Studies. I'll Add Period OHLC-Variable Period study from the list. Open the settings, and set Time Period Length to Weeks, with a Time Period Length of 1.
Switch to the Subgraphs menu of the study settings window. For each visible subgraph, I'll change the Draw Style to Line at Last Bar to Edge, then pick my colors. OK.
Switch to the Subgraphs menu of the study settings window. For each visible subgraph, I'll change the Draw Style to Line at Last Bar to Edge, then pick my colors. OK.


Now, I'll click to select the chart, SC Menu: Chart > Open Time and Sales Window.
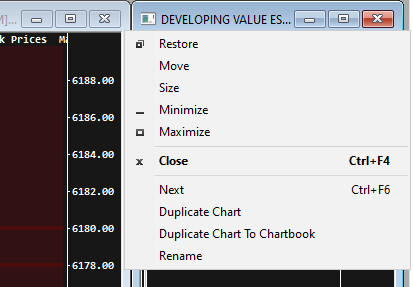
Now, at the top left hand side of the chart we just created, click the icon then click Duplicate Chart, note this down, since we'll be duplicating it multiple times to avoid excessive tuning settings.
Now, at the top left hand side of the chart we just created, click the icon then click Duplicate Chart, note this down, since we'll be duplicating it multiple times to avoid excessive tuning settings.
On the new chart, add the study Numbers Bars (footprint). I'll have Column 1 Bid Vol x Ask Volume, with the background coloring method set to Based on Dominant Ask Vol Bid Vol - Actual.
I'll set Column 2 to Ask Vol Bid Vol Difference with the background type as Volume Profile, with the coloring method set to Based on Dominant Ask Vol Bid Vol …. Press OK.
I'll set Column 2 to Ask Vol Bid Vol Difference with the background type as Volume Profile, with the coloring method set to Based on Dominant Ask Vol Bid Vol …. Press OK.

I'll add the study Ask/Bid Volume Difference Bars study, for a volume delta candlestick, the chart region is 2.
Now I'll add the study Numbers Bars Calculated Values, open the settings for it, I'll pick some colors for Range 0-3 Up/Down colors. Blue and Red is nice. Switch to Subgraphs menu, and only display the subgraphs I want to see, including Ask Volume Bid Volume Difference, and others. Rest set to Ignore. Press OK
Now I'll add the study Numbers Bars Calculated Values, open the settings for it, I'll pick some colors for Range 0-3 Up/Down colors. Blue and Red is nice. Switch to Subgraphs menu, and only display the subgraphs I want to see, including Ask Volume Bid Volume Difference, and others. Rest set to Ignore. Press OK

Once again, Duplicate the 1st chart created. Open Chart Settings for it, and in the Bar Period menu switch Graph Draw Type to Blank, press OK.
Now add Market Depth Historical Graph. I'll pick some colors for range 0-3 and use my preferences for the coloring settings. Press OK.
Now add Market Depth Historical Graph. I'll pick some colors for range 0-3 and use my preferences for the coloring settings. Press OK.

I'll add the study Bid & Ask Prices, open the settings for it, switch to the Subgraphs menu and change the Draw Style for both subgraphs to Stair Step. Press OK.
Now, duplicate our original chart once again. Just like last time, in the Chart Settings > Bar Period, set the Graph Draw Type to Blank.
Add the study TPO Profile Chart. Set up the TPO settings, I'll go with Letter/Block Increments of 4 ticks per block, with Number of TPO Profile Periods to Multiple Profiles Based on Fixed Time, set to 30 minutes. Shade TPO Letters/Blocks Based on Time set to Yes.
Add the study TPO Profile Chart. Set up the TPO settings, I'll go with Letter/Block Increments of 4 ticks per block, with Number of TPO Profile Periods to Multiple Profiles Based on Fixed Time, set to 30 minutes. Shade TPO Letters/Blocks Based on Time set to Yes.
In the subgraphs menu of the study settings, I'll pick my colors for the blocks, value area lines, and POC. Press OK.
I'll add the study Volume By Price and pick a composite of my preference. In settings, Right Align Volume Bars set to Yes, Align to Far Right set to: Yes.
I'll add the study Volume By Price and pick a composite of my preference. In settings, Right Align Volume Bars set to Yes, Align to Far Right set to: Yes.

Still with me? SC Menu > File > Open Trading DOM > pick symbol, press Open Trading DOM. Then with the DOM selected hit Analysis > Studies > pick Volume By Price from the list of studies and hit Add. OK.
SC Menu > Chart > Graphics Settings Chart. Go through all the settings for Trade DOM, and pick your coloring scheme. I went with Blue for Bid and Red for Asks. I have 2 threads outlining DOM setup.
SC Menu > Chart > Graphics Settings Chart. Go through all the settings for Trade DOM, and pick your coloring scheme. I went with Blue for Bid and Red for Asks. I have 2 threads outlining DOM setup.
With the DOM selected, hit SC Menu: Trade > Attatch Trade Window to Chart. Click the M button to open settings. Go through each one, I like to enable Scale In/Out. I'll click Customize Trade DOM Columns, and I'll add Bid Size/Buy Column, Price, Ask Size/Sell Column, General Purpose 1.
I'll set Show Volume Bars to my preference. Press OK.
I'll set Show Volume Bars to my preference. Press OK.

Now, on the SC Menu: Window > Tile Vertically. Look at that! A legit prop-style workspace.
Go ahead and fine tune things, but this should be a solid foundation to get you started, depending on what charts you use.
Go ahead and fine tune things, but this should be a solid foundation to get you started, depending on what charts you use.
If you found this remotely useful, please consider showing some love to the first post of this thread.
It can be helpful to see examples already built, and this same workspace is available here:
ziiiggy.gumroad.com/l/sierra-chart…
Video Tutorial for beginners here:
ziiiggy.gumroad.com/l/sierra-chart…
It can be helpful to see examples already built, and this same workspace is available here:
ziiiggy.gumroad.com/l/sierra-chart…
Video Tutorial for beginners here:
ziiiggy.gumroad.com/l/sierra-chart…

• • •
Missing some Tweet in this thread? You can try to
force a refresh


