David Turver Profile picture
Jun 29 18 tweets 4 min read Read on X
UK’s energy policy is failing: high costs, low reliability & environmental harm. A physics-first approach - focusing on EROEI, reliability, environmental footprint, security & cost—can save us. Why we need to ditch renewables ideology & embrace nuclear, gas, and hydro. (1/17) Image
Ed Miliband’s Clean Power 2030 plan relies on wind and solar, cutting gas to 5% and virtually ignoring nuclear. Result? UK has the highest industrial electricity prices in the developed world. Net Zero’s low-energy future risks economic stagnation. (2/17) UK has the highest industrial electricity prices in Europe and the developed world.
A physics-first energy policy prioritizes:
- High Energy Return on Energy Invested (EROEI)
- Reliability and flexibility
- Small environmental footprint
- Energy security
- Low total system cost

Let’s break it down. (3/17)
EROEI measures energy output vs. input. Low EROEI (like wind/solar) means society spends more effort gathering energy, leaving less for growth. The Net Energy Cliff shows low EROEI risks societal collapse (4/17) The Net Energy Cliff
Weissbach’s study shows nuclear and gas have high EROEI, while solar, wind, and biomass are low. Biomass EROEI is ~2, and with carbon capture, it’s <1 - a net energy sink! Physics-first excludes low-EROEI sources. (5/17) EROEI of different energy sources, per Weissbach
Modern economies need reliable, flexible power. Nuclear is steady but inflexible. Gas and hydro can adjust to demand. Wind and solar depend on weather, uncorrelated with need. Physics-first demands reliable sources. (6/17)
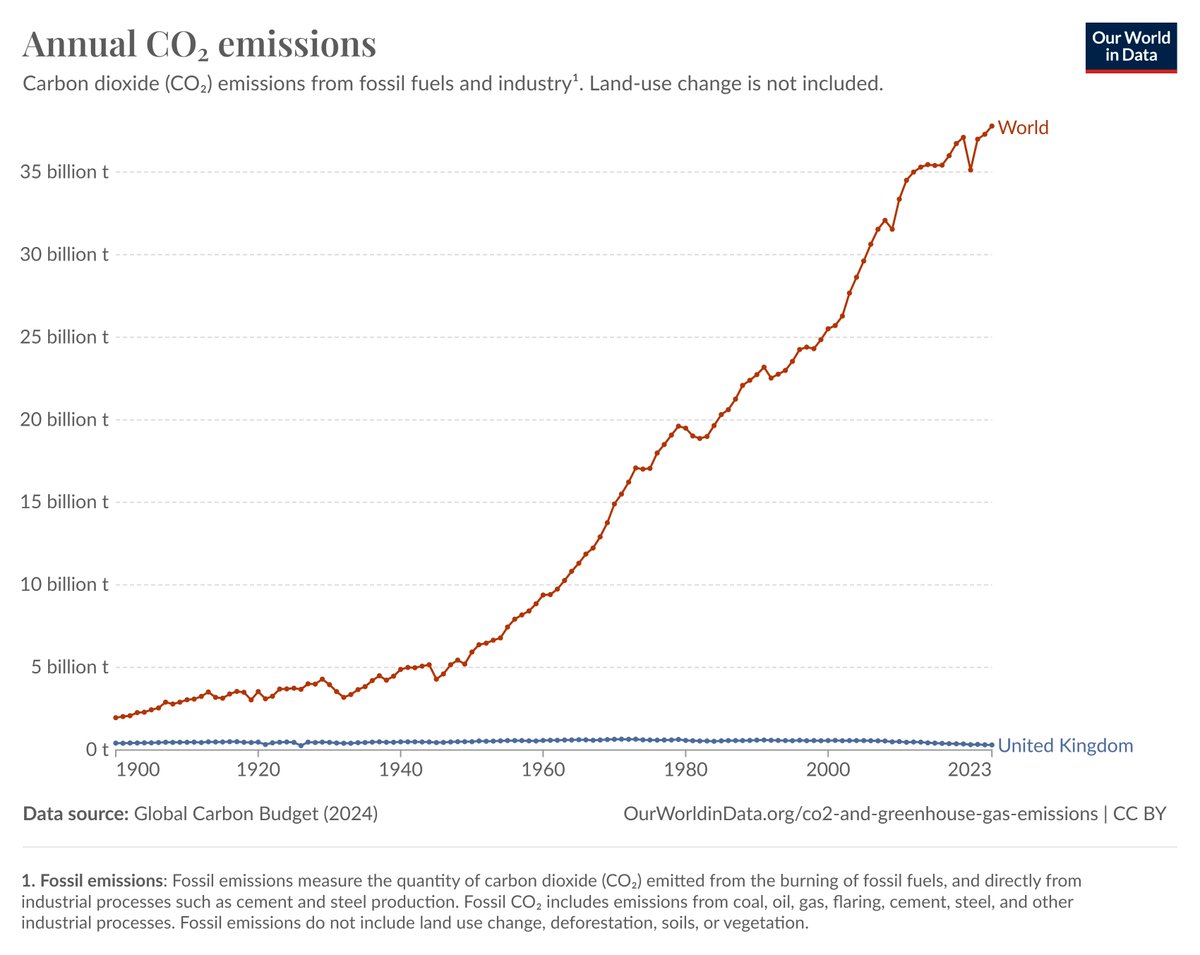
CO2 isn’t the only metric. Wind and solar need vast land, minerals, and new transmission lines. Mining for cobalt (wind) and solar panel production often harm the environment. Physics-first considers the full footprint. (7/17)
Geopolitics matters. BRICS nations control much of global oil/gas. Relying on interconnectors or North African solar is risky. UK must maximize domestic gas and oil to avoid dependence on hostile regimes. (8/17)
Cheap energy drives prosperity. Renewables’ “low cost” ignores subsidies, grid balancing, and new infrastructure. Even Hinkley Point C nuclear is cheaper than new wind/solar in AR6. Orsted’s Hornsea 4 cancellation proves wind’s true cost. (9/17) Comparison of the system cost of different sources of electricity
Going through the options:
Burning trees at Drax has an EROEI of ~2, emits particulates, and needs vast land. It’s only “green” because we ignore CO2, assuming trees regrow in decades. Keep Drax running for now, but replace it with better options. (10/17)
Solar PV has low EROEI, needs lots of land, and produces least when demand is highest (winter evenings). UK ranks 2nd worst globally for solar. Chinese-made panels often use coal and slave labour. End subsidies for grid-scale solar! (11/17)
Offshore wind is intermittent & costly with low EROEI. It relies on cobalt (child labour in Congo) and Chinese rare earths. Buffering with batteries or hydrogen worsens EROEI. Wind has no place in a physics-first policy. (12/17)
UK’s 4.7GW of hydro (including 2.8GW pumped storage) has high EROEI and reliability. Pumped storage balances the grid. Expansion is limited by geography, but it’s a keeper for physics-first. (13/17)
Gas has high EROEI, low emissions vs. coal, and UK has offshore NOrth Sea & onshore shale resources. Coal’s high EROEI and UK’s 77m tonnes of reserves make it viable with modern scrubbing tech. Both likely needed until nuclear scales up. (14/17)
Nuclear offers zero emissions, high EROEI, low mineral use, and reliable power for decades. Five-eyes allies ensure fuel security. Overregulation must be fixed to cut costs and build times. Nuclear + gas + hydro = physics-first. (15/17) Image
UK’s focus on wind and solar is a dead end: low EROEI, unreliable, and unsustainable. A physics-first policy needs nuclear, gas, and hydro to deliver cheap, secure, reliable energy. Reform nuclear regs and boost domestic hydrocarbons to avoid economic ruin. (16/17)
If you enjoyed this thread, please like and share. You can sign up for free to read the full article on the link below. (17/17).
open.substack.com/pub/davidturve…Image
Hi @threadreaderapp unroll please.

• • •

Missing some Tweet in this thread? You can try to force a refresh
 

Keep Current with David Turver

David Turver Profile picture

Stay in touch and get notified when new unrolls are available from this author!

Read all threads

This Thread may be Removed Anytime!

PDF

Twitter may remove this content at anytime! Save it as PDF for later use!

Try unrolling a thread yourself!

how to unroll video
  1. Follow @ThreadReaderApp to mention us!

  2. From a Twitter thread mention us with a keyword "unroll"
@threadreaderapp unroll

Practice here first or read more on our help page!

More from @7Kiwi

Jun 22
A friend told me I needed to simplify my articles and produce a Net Zero for Dummies. Well, here goes, the folly of Net Zero in eight charts (1/12) Ed Miliband Net Zero for Dummies
Net Zero is sold as a climate fix, but it’s ineffective. UK’s 0.8% of global emissions means our cuts barely dent the climate (2/12) Image
CO2 isn’t the only climate driver—ice cores show temp swings with stable CO2. Net Zero is a futile gesture (3/12) Image
Read 13 tweets
Jun 15
Net Zero is a far-left tyrannical Death Star, cloaking state control as climate action. It crushes free markets with subsidies & bans. Time to fight for freedom! #NetZeroTyranny (1/11) Image
On the Political Compass, Net Zero is far-left: massive subsidies for renewables, bans on oil/gas, & Soviet-style plans like Miliband’s Clean Power 2030. No free market here! #NetZero (2/11) Image
Net Zero is peak authoritarianism. The Climate Change Committee (CCC) overrides Parliament, mandating how we heat homes, drive, & eat. Tyranny, not progress! #FreedomVsNetZero (3/11) Net Zero is a far-left tyrannical death star
Read 12 tweets
Jun 8
Late last month, the CCC released their Methodology Report that gave a little more insight into their thinking, or lack thereof, when they produced the 7th Carbon Budget. How did they get it so wrong. A thread 🧵(1/n) The Climate Change Committee have revealed how they made their errors in the 7th Carbon Budget.
First up, they assume even lower costs for fixed-bottom offshore wind than the Government's woeful Generation Cost report from 2023. The CCC's assumed costs for 2030 are less than half the value of contract awards in last year's AR6 auction. (2/n) Image
Floating offshore wind is even more expensive and being offered £245/MWh in AR7, some six times more than the CCC's estimate for 2030 delivery. Worse, the CCC shows a declining cost trend, whereas recent auctions have shown an upward trend in prices (3/n)
Read 14 tweets
Jun 1
Last week, the Government released new data about energy costs in the UK & EU, and by extension the developed world. The bad news is that the UK still has the highest industrial electricity prices in Europe. But what else is going on in the data? A thread 🧵(1/n) UK has the highest industrial electricity prices in Europe, about double the EU median
The chart above is for medium consumers, where UK prices are 89% higher than EU14 median. Large & v. large UK user prices are 132% & 113% respectively higher than the EU14 median. Very large UK users pay 22.32p/kWh compared to the lowest Finland with just 4.19p/kWh (2/n) UK large industrial electricity prices are well above those of France, Germany and the EU14 median
But it can't be gas driving these eyewatering electricity costs because UK industrial gas prices are below the EU14 median (3/n) Image
Read 10 tweets
May 28
The data is in for CfD subsidies in April 2025. Overall subsidies are down from April last year, but subsidies per MWH are up. What is going on? A thread 🧵(1/n) Market Price and Subsidy per MWH for offshore wind, onshore wind and solar in April 2025.
Overall subsidies for April 2025 came in at £155m across all technologies. This is slightly up on March 2025 (£152m) but much lower than April 2024 (£270m) (2/n) Image
Sounds like a move in the right direction until you look at generation. The fall in subsidies was mostly driven by a big drop in offshore wind generation. April 2025 delivered 1,263GWh, down form 2,237GWh in 2024 and lower than April 2023's 1,287GWh (3/n) Image
Read 13 tweets
May 25
Ofgem just cut the price cap for Jul-Sep 2025. What's been driving our electricity bills since the price cap came into force? Mostly Net Zero stuff. A thread 🧵(1/n) Net Zero related charges have done most to increase our electricity bills since the price cap came into force.
Overall bills (including VAT) including both gas and electricity have fallen by £129 or 7%. Interestingly, those on prepayment meters pay less than those on direct debit (2/n) Image
However, gas-bills fell by 9.3%, or £81 which is more than the average cut for the whole bill. Of the ex-VAT total of £797, about £408 is the price of gas with most of the rest being gas network costs, supplier operating costs & profit (3/n)
Read 13 tweets

Did Thread Reader help you today?

Support us! We are indie developers!


This site is made by just two indie developers on a laptop doing marketing, support and development! Read more about the story.

Become a Premium Member ($3/month or $30/year) and get exclusive features!

Become Premium

Don't want to be a Premium member but still want to support us?

Make a small donation by buying us coffee ($5) or help with server cost ($10)

Donate via Paypal

Or Donate anonymously using crypto!

Ethereum

0xfe58350B80634f60Fa6Dc149a72b4DFbc17D341E copy

Bitcoin

3ATGMxNzCUFzxpMCHL5sWSt4DVtS8UqXpi copy

Thank you for your support!

Follow Us!

:(