In this THREAD I will explain “Pullbacks”
1. What is a Pullback?
2. What is a Reversal?
3. Trading Indicators
🧵(1/15)
1. What is a Pullback?
2. What is a Reversal?
3. Trading Indicators
🧵(1/15)

1. What is a Pullback?
A pullback is a temporary reversal in the price movement of an asset, usually after an uptrend or downtrend
Pullbacks are temporary corrections within the context of the prevailing trend.
A pullback is a temporary reversal in the price movement of an asset, usually after an uptrend or downtrend
Pullbacks are temporary corrections within the context of the prevailing trend.

1.1 What is a Pullback?
A pullback refers to a temporary dip or pause in the price movement of an asset, occurring within an established trend.
It's a short-term price correction that moves against the prevailing trend before the trend resumes.
A pullback refers to a temporary dip or pause in the price movement of an asset, occurring within an established trend.
It's a short-term price correction that moves against the prevailing trend before the trend resumes.

1.2 What is a Pullback?
Pullbacks can offer traders opportunities to enter or re-enter a position at a potentially more favorable price.
A retracement or pullback is a temporary price movement against the overall trend.
Pullbacks can offer traders opportunities to enter or re-enter a position at a potentially more favorable price.
A retracement or pullback is a temporary price movement against the overall trend.

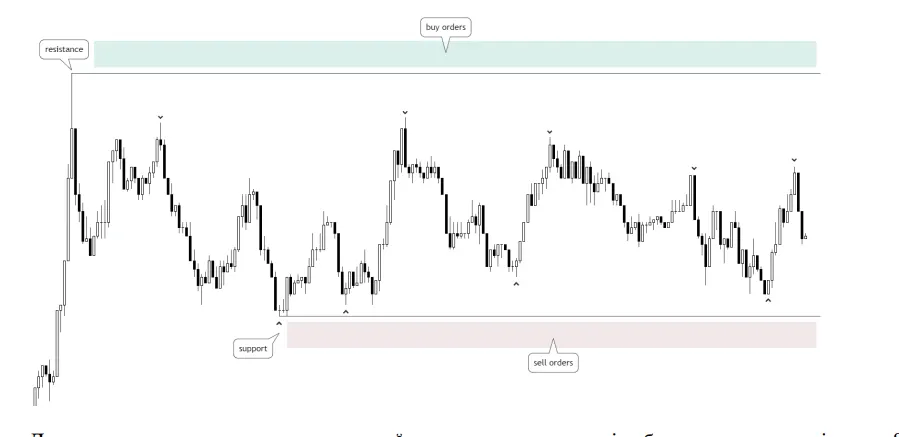
1.3 What is a Pullback?
You'll find these pullbacks when the market is breaking out of a consolidation
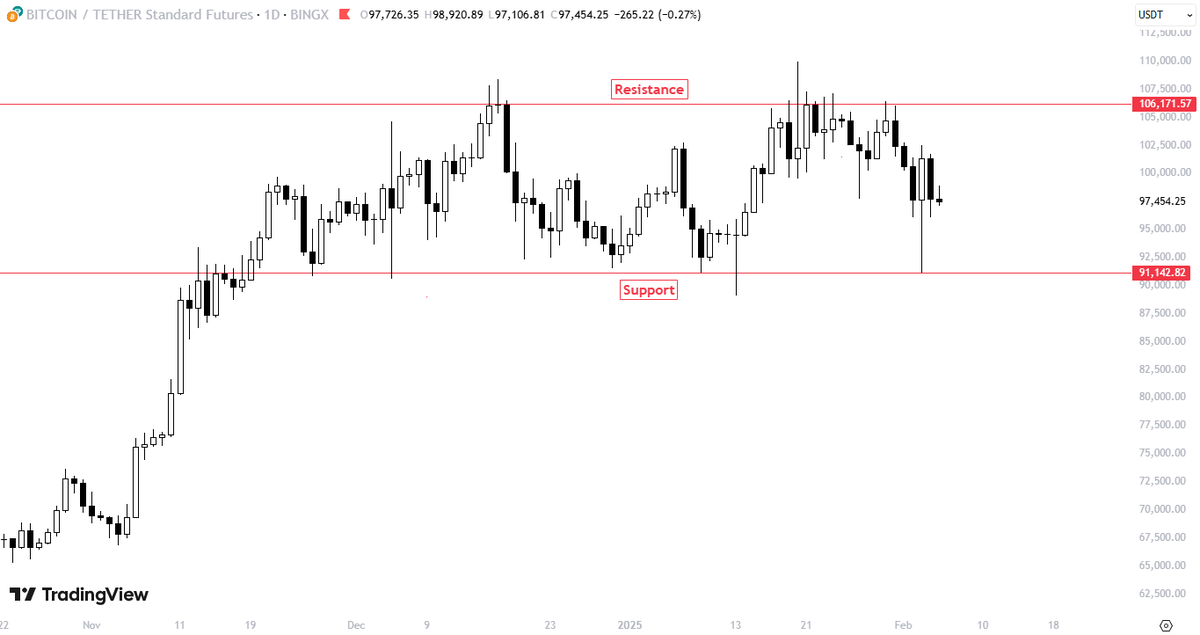
When the price breaks out of resistance, returns to the previous resistance (which now becomes support)
You'll find these pullbacks when the market is breaking out of a consolidation
When the price breaks out of resistance, returns to the previous resistance (which now becomes support)

1.4 What is a Pullback?
A trendline forms when a price touches a line three or more times.
Each time the price touches that trend line, the price pullbacks.
This trendlines act as a resistance for the price.
A trendline forms when a price touches a line three or more times.
Each time the price touches that trend line, the price pullbacks.
This trendlines act as a resistance for the price.

1.5 What is a Pullback?
Indicators are also useful methods for detecting pullbacks.
Some indicators will tell you in advance whether it's a pullback or a reversal.
My favorites for identifying pullbacks are EMAs and Bollinger Bands.
Indicators are also useful methods for detecting pullbacks.
Some indicators will tell you in advance whether it's a pullback or a reversal.
My favorites for identifying pullbacks are EMAs and Bollinger Bands.

1.6 What is a Pullback?
The Fibonacci retracement tool is one of the most useful tools for identifying a pullback.
Fibonacci has levels where the price completes pullbacks.
This tool we help you to trade pullbacks, and identify if its a reversal.
The Fibonacci retracement tool is one of the most useful tools for identifying a pullback.
Fibonacci has levels where the price completes pullbacks.
This tool we help you to trade pullbacks, and identify if its a reversal.

2. What is a reversal?
A reversal is when the overall trend of the market changes direction.
Reversals are viewed as much more significant, longer term changes in direction of a market.
A reversal is when the overall trend of the market changes direction.
Reversals are viewed as much more significant, longer term changes in direction of a market.

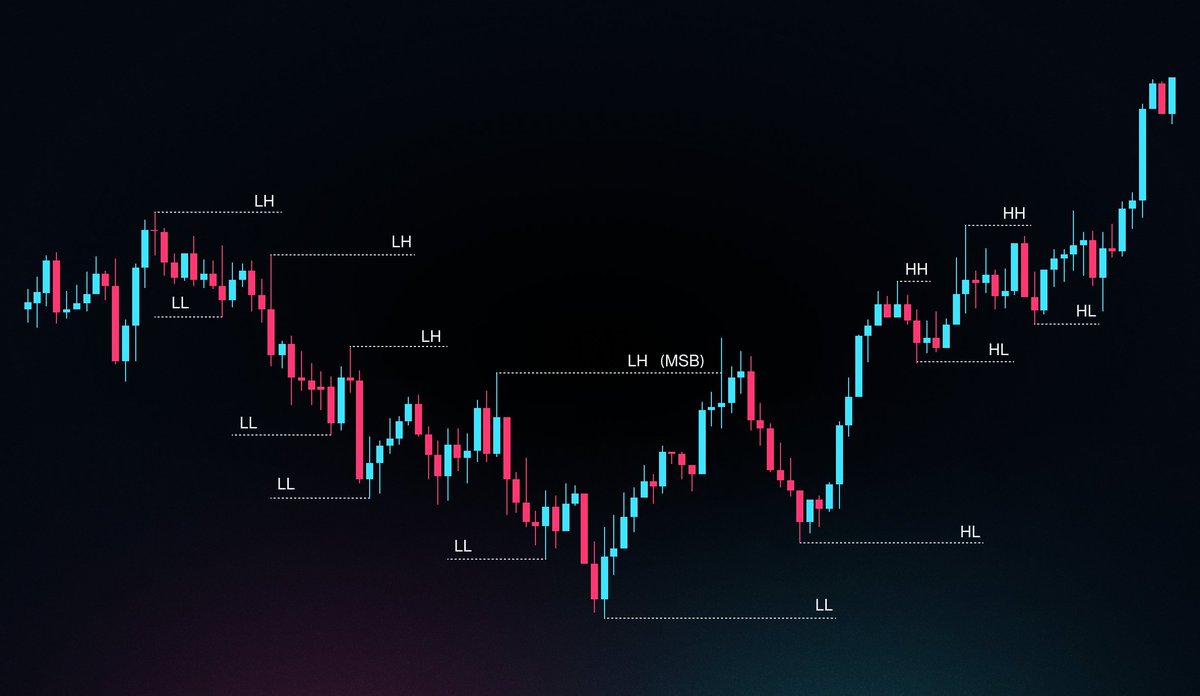
2.1 What is a Reversal?
When you identify the prevailing trend, you will know if there are retracements/pullbacks or reversals.
Use trendlines or indicators to help you out to identify if its a pullback or a reversal
When you identify the prevailing trend, you will know if there are retracements/pullbacks or reversals.
Use trendlines or indicators to help you out to identify if its a pullback or a reversal

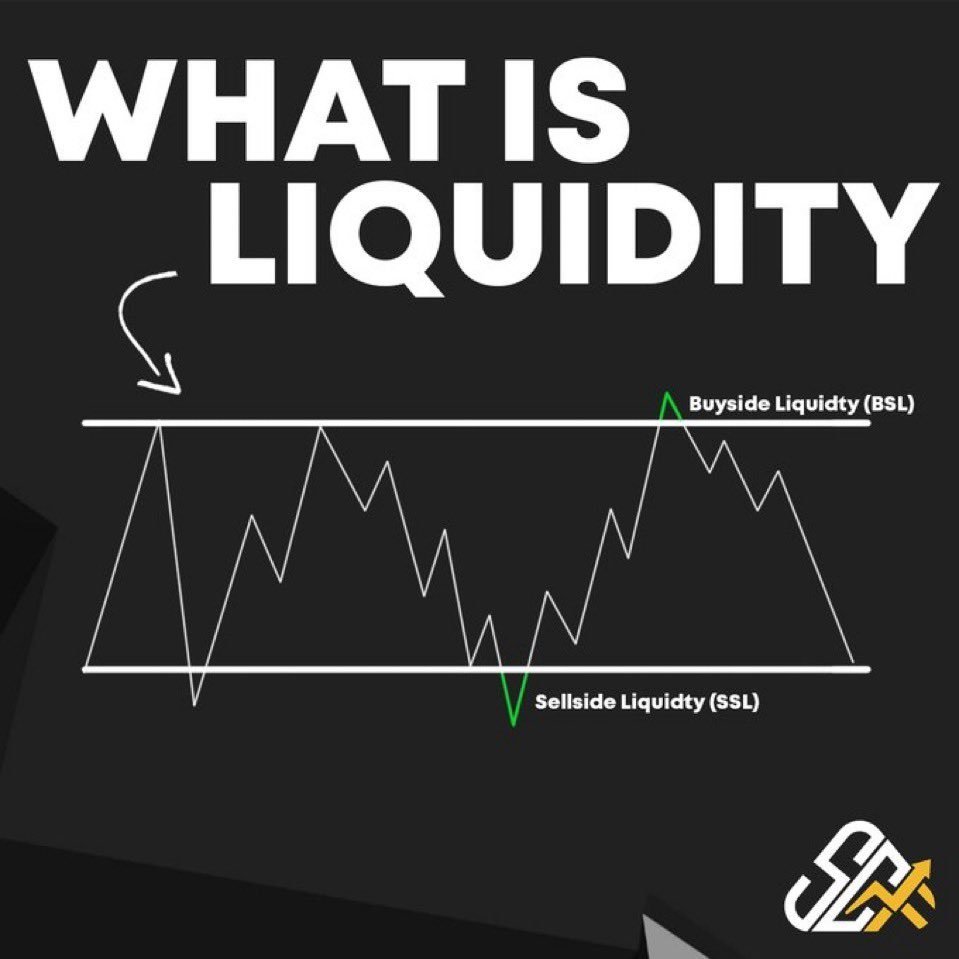
2.2 What is a Reversal?
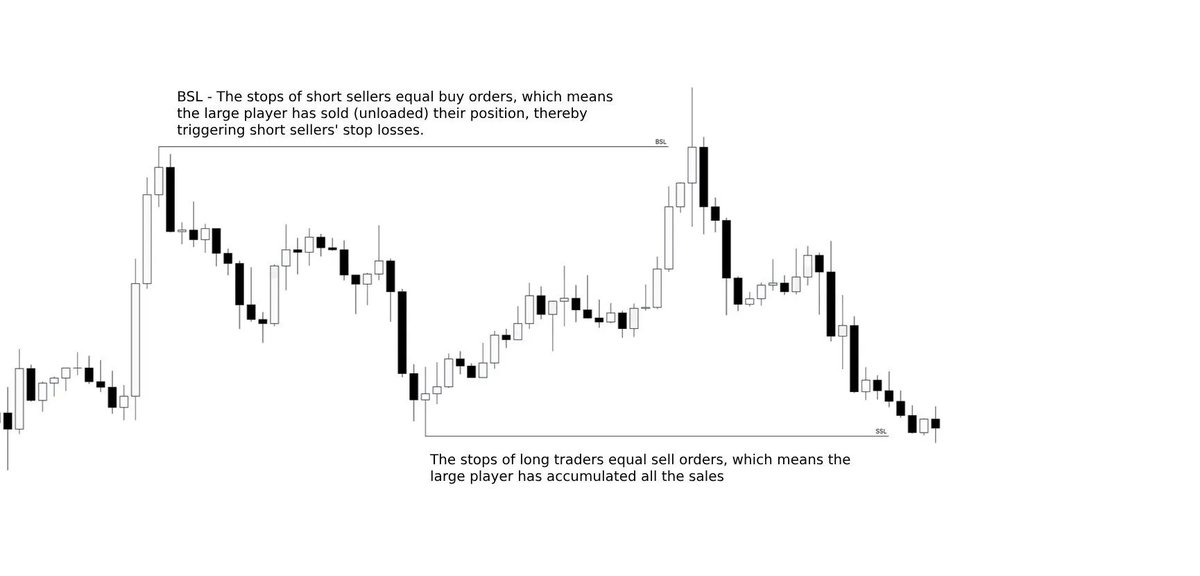
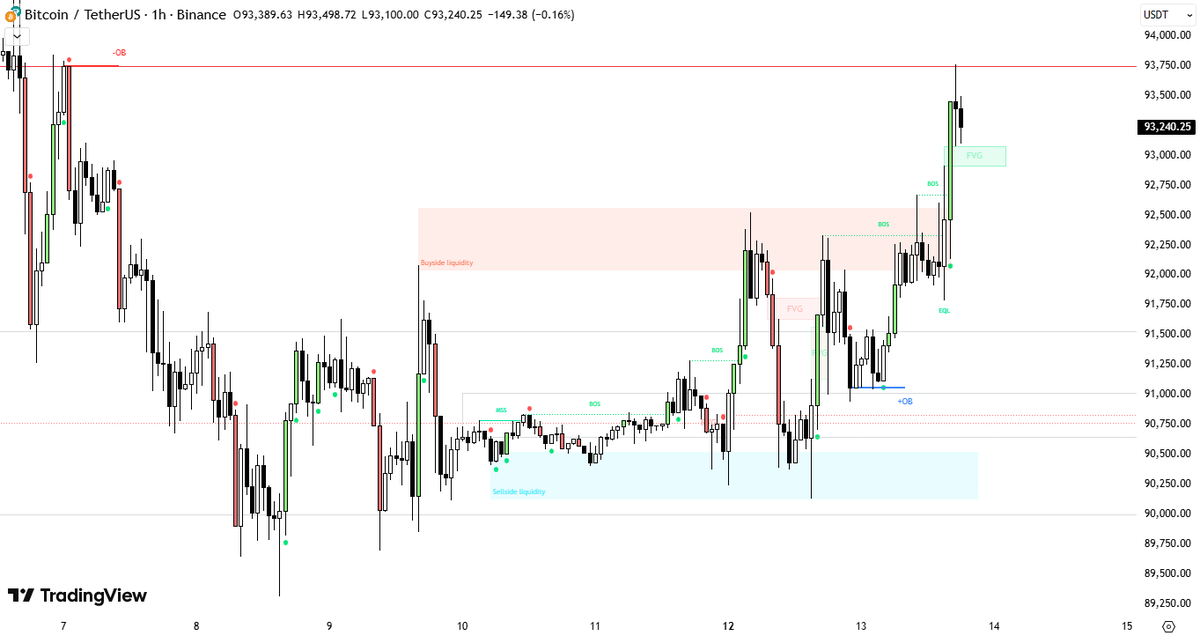
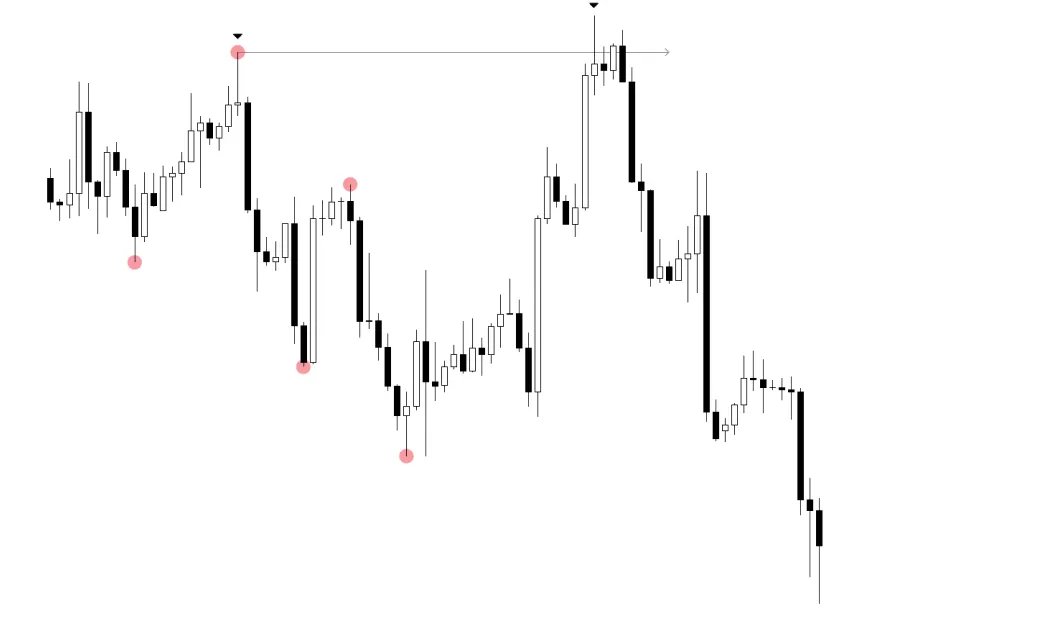
In this $BTC chart I illustrated the reversals in 4H TF.
Normally reversal in HTF, always have a reason for which to reverse the current trend.
For example: Local tops and lows, Liquidity Sweeps, Deviations...
In this $BTC chart I illustrated the reversals in 4H TF.
Normally reversal in HTF, always have a reason for which to reverse the current trend.
For example: Local tops and lows, Liquidity Sweeps, Deviations...

2.3 What is a Reversal?
This are some of the best indicators to identify a Reversal
- Bollinger Bands
- Fibonacci
- RSI
- Moving Averages
- Donchian Channel
This are some of the best indicators to identify a Reversal
- Bollinger Bands
- Fibonacci
- RSI
- Moving Averages
- Donchian Channel

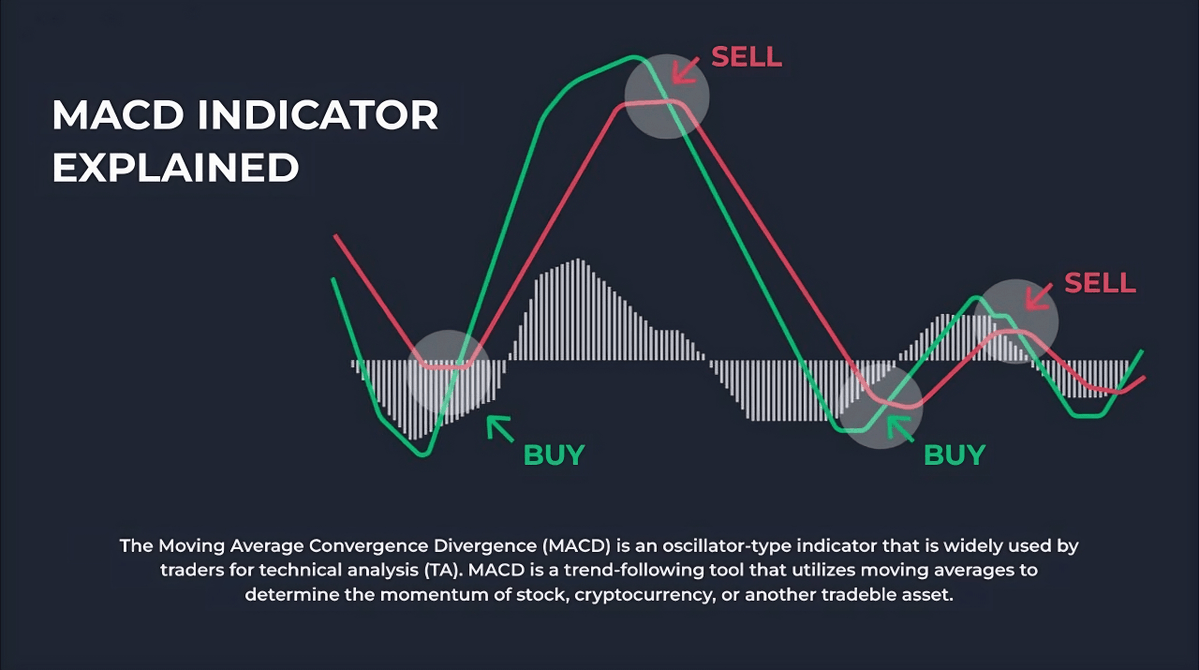
3. Trading Indicators
Bollinger Bands is a great indicator to identify trends, reversals and pullbacks.
In a downtrend, a pullback approaching the middle band without surpassing it = Selling opportunity
And the contrary in a uptrend.
Bollinger Bands is a great indicator to identify trends, reversals and pullbacks.
In a downtrend, a pullback approaching the middle band without surpassing it = Selling opportunity
And the contrary in a uptrend.


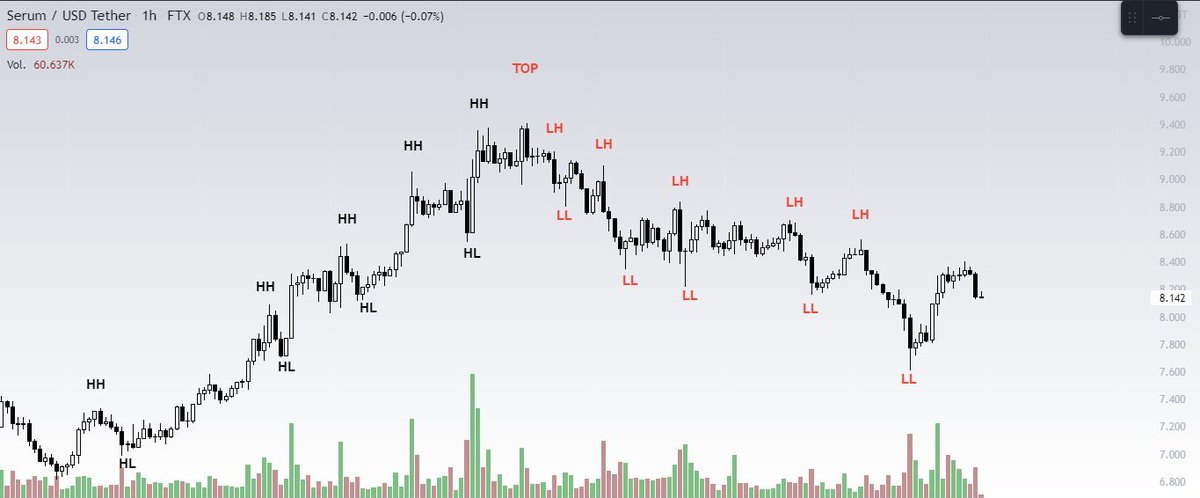
3.1 Trading Indicators
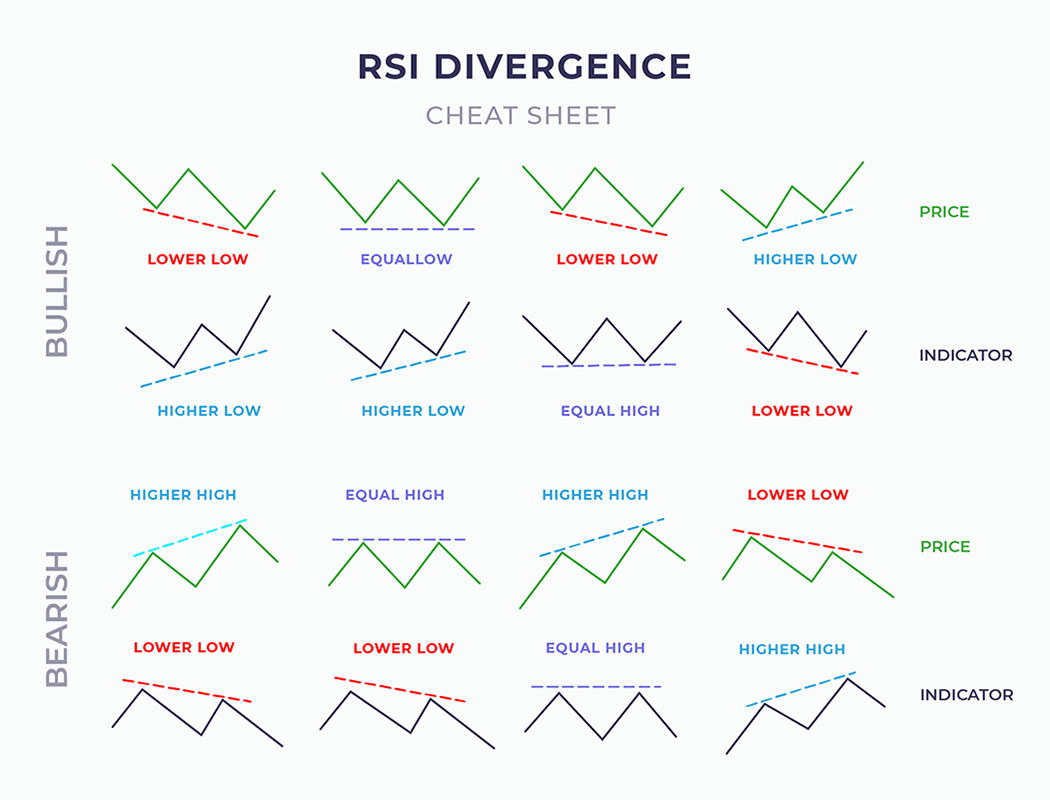
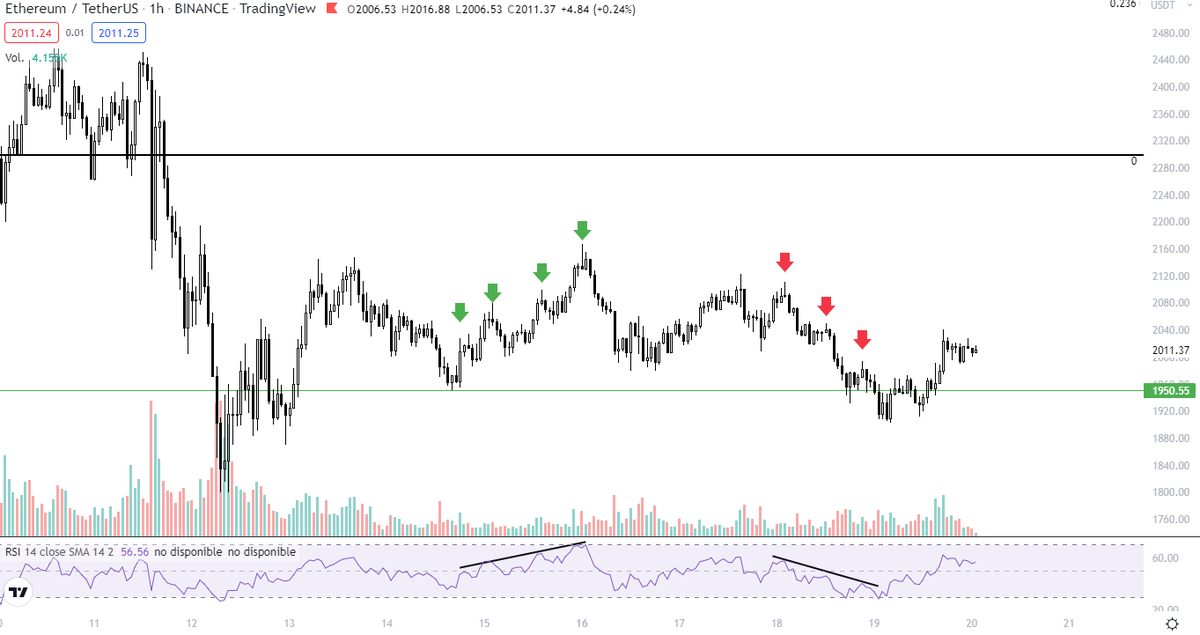
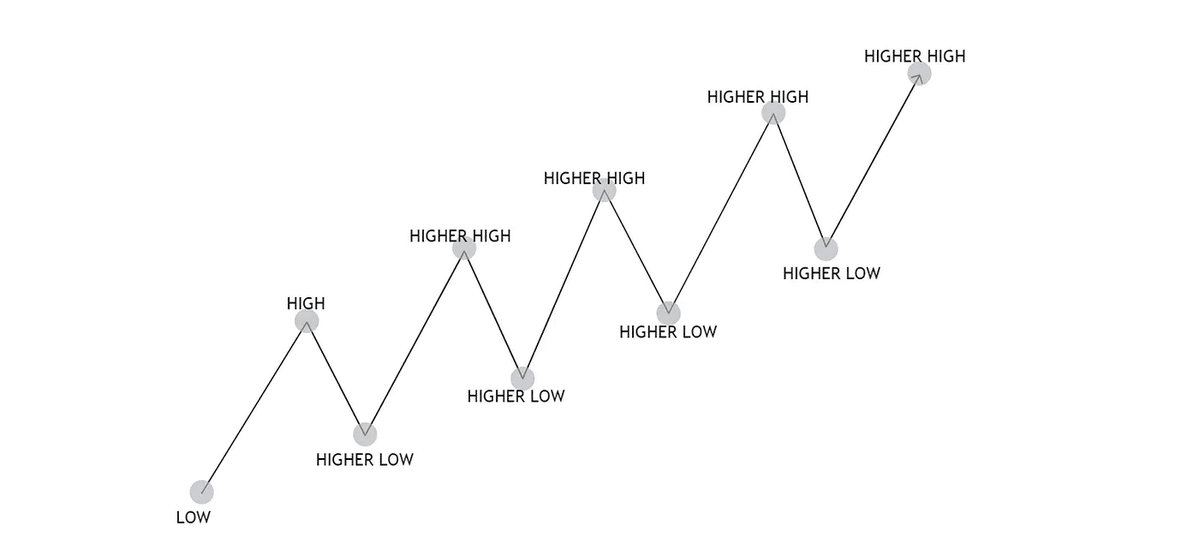
Through the RSI you can identify HIGHS and LOWS of the current trend.
RSI will help you identify the HIGH and the LOW of this Pullbacks.
And also provide information about the price, if its overbought or oversold.
Through the RSI you can identify HIGHS and LOWS of the current trend.
RSI will help you identify the HIGH and the LOW of this Pullbacks.
And also provide information about the price, if its overbought or oversold.


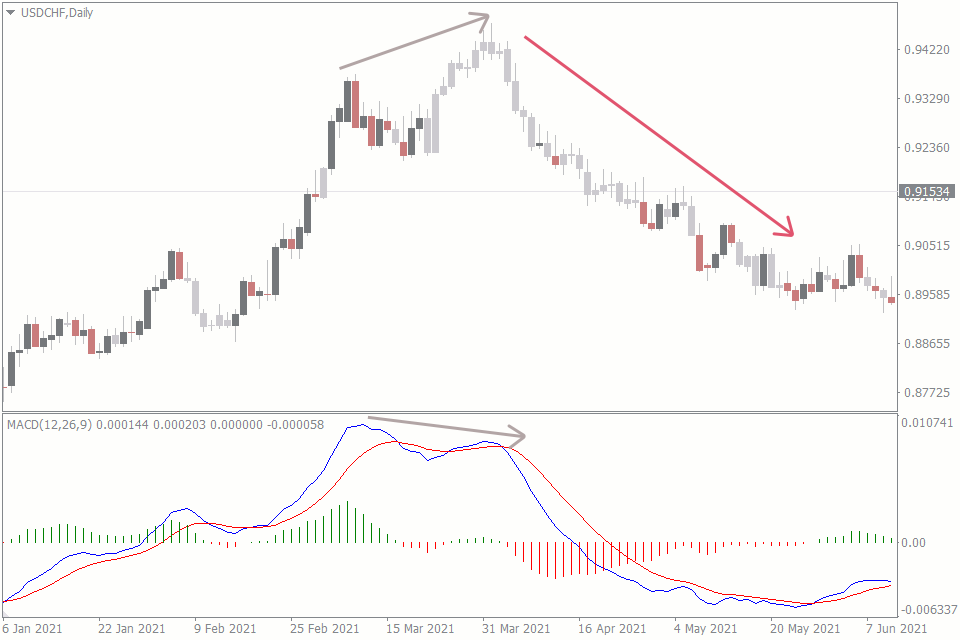
3.2 Trading Indicators
There are some trading indicators that are useful to identify Pullbacks and Reversals.
In this Moving Average examples we can identify Pullbacks and Reversals.
Use the Moving Average also as Support and Resistance
There are some trading indicators that are useful to identify Pullbacks and Reversals.
In this Moving Average examples we can identify Pullbacks and Reversals.
Use the Moving Average also as Support and Resistance


• • •
Missing some Tweet in this thread? You can try to
force a refresh