The Most Important Silver Charts Right Now
A Holiday 🧵
Let's Gooo!
A Holiday 🧵
Let's Gooo!
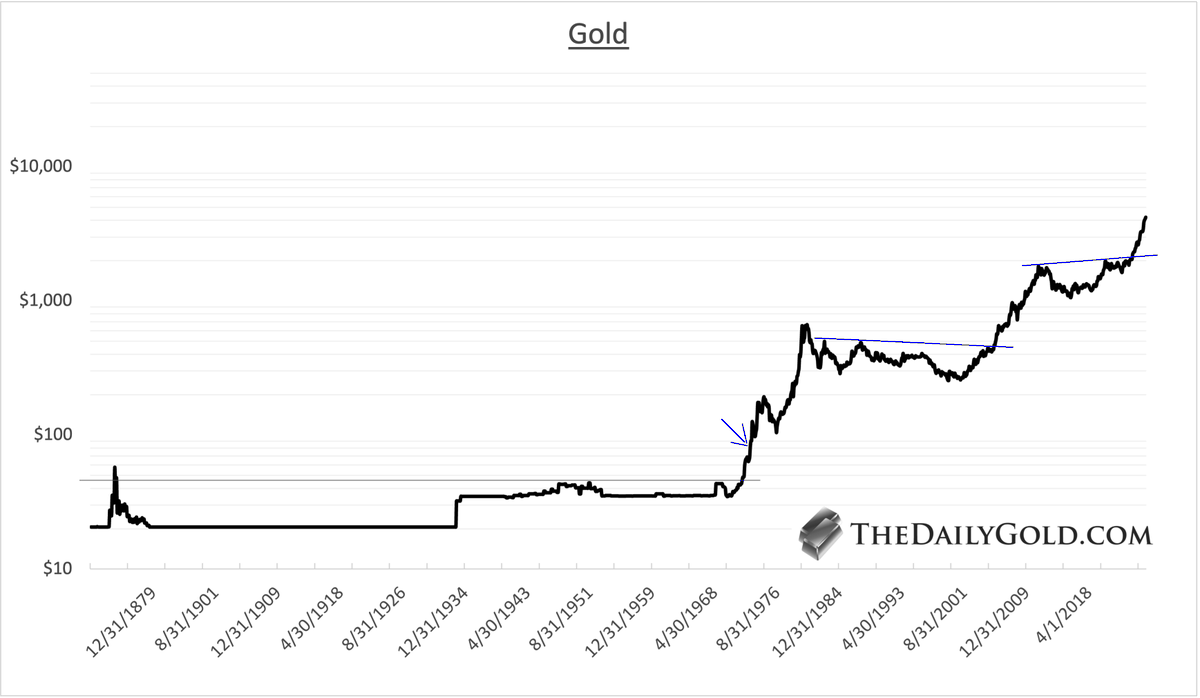
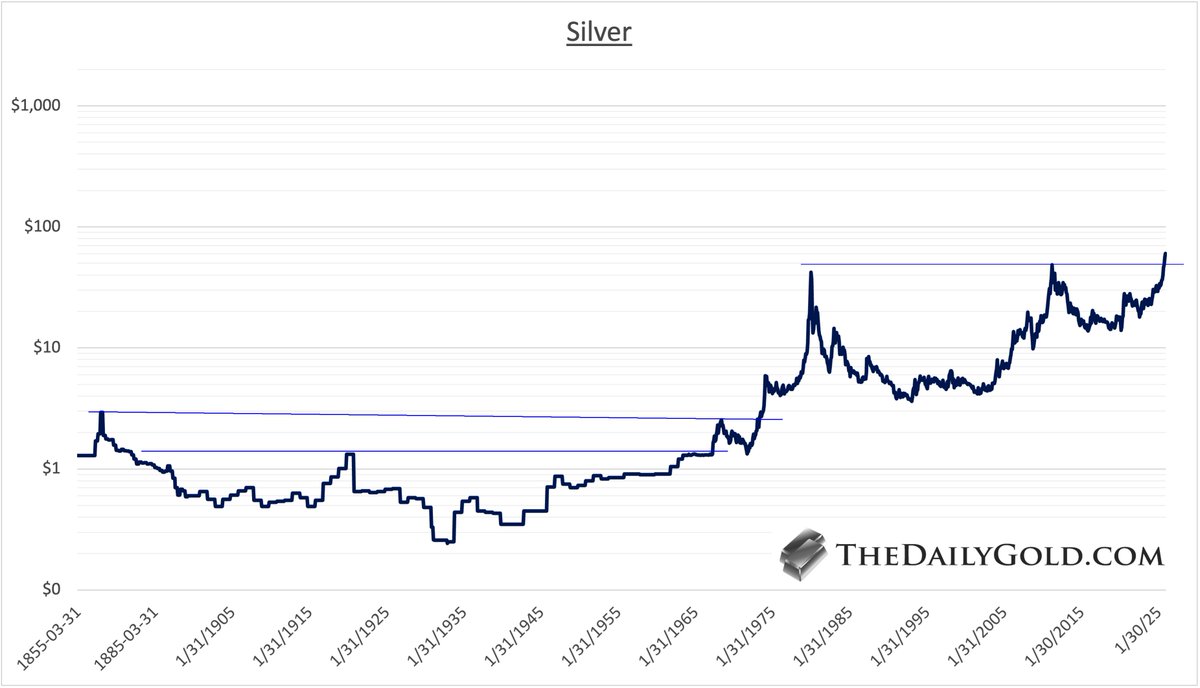
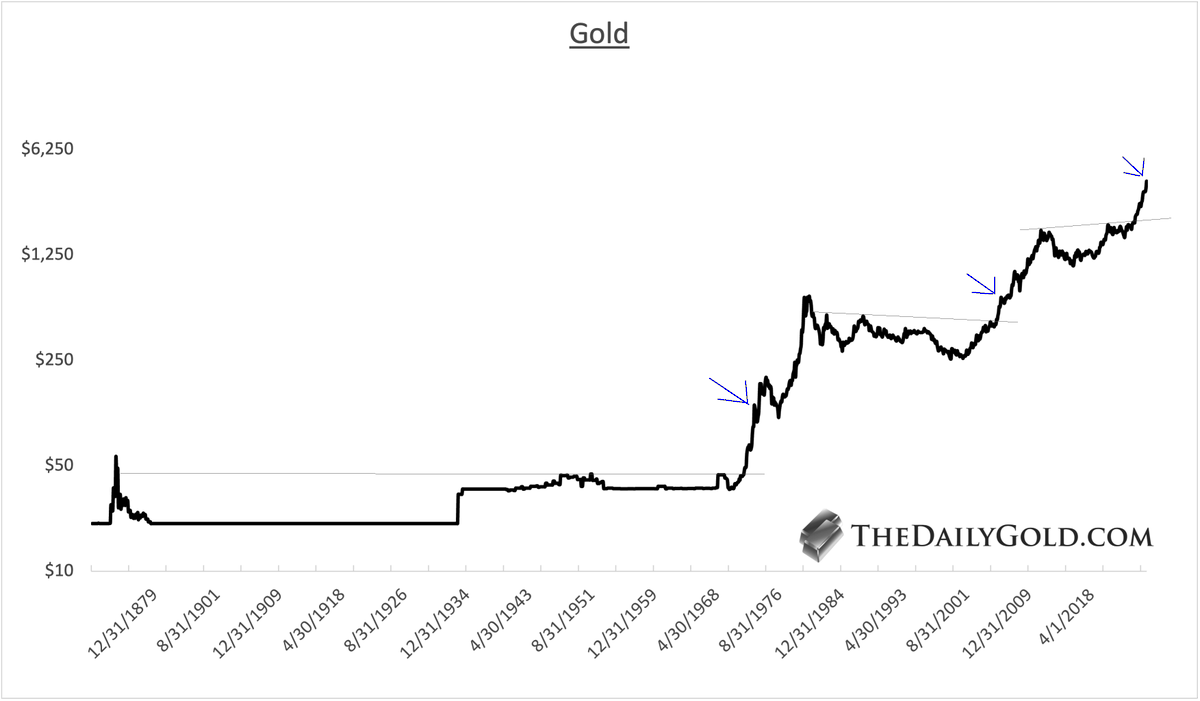
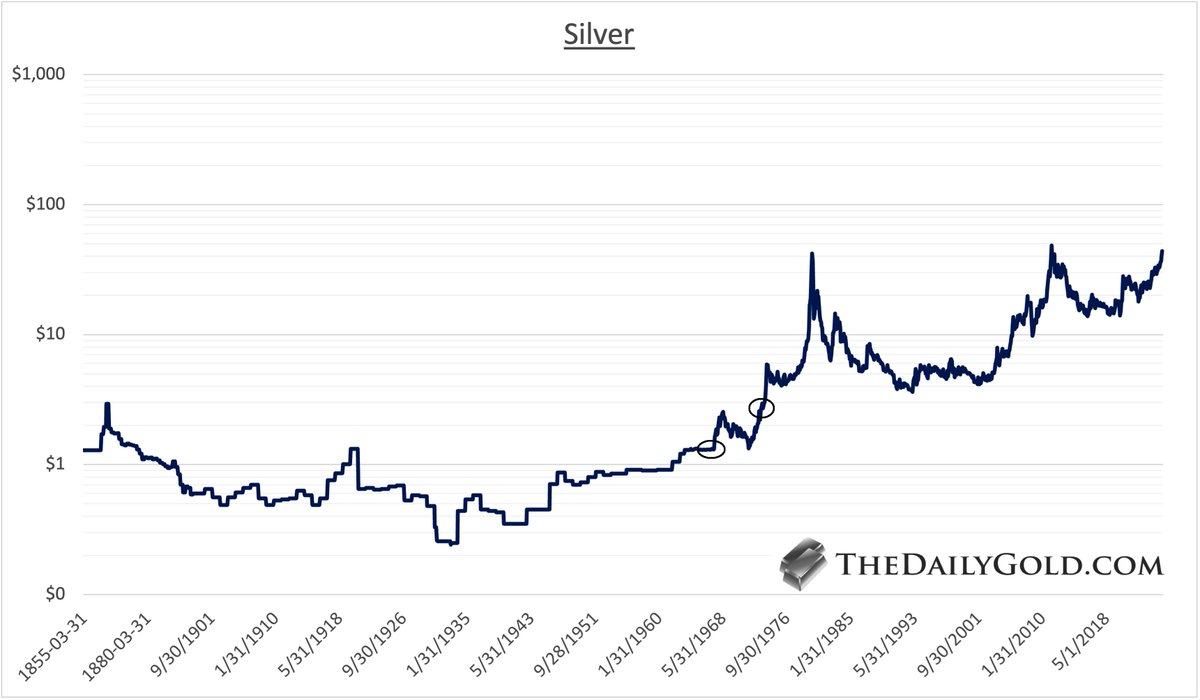
1) Silver Historical Chart
Simplicity is beauty.
Silver is setting up for the greatest breakout in the history of capital markets since 1972, when Gold broke out from an over 100-year-long base.
Silver itself broke to new all-time highs in 1973 (circle).
The historical chart dates back 170 years.
Breaking $50/oz is going to be extremely significant and lead to spectacular moves and volatility.

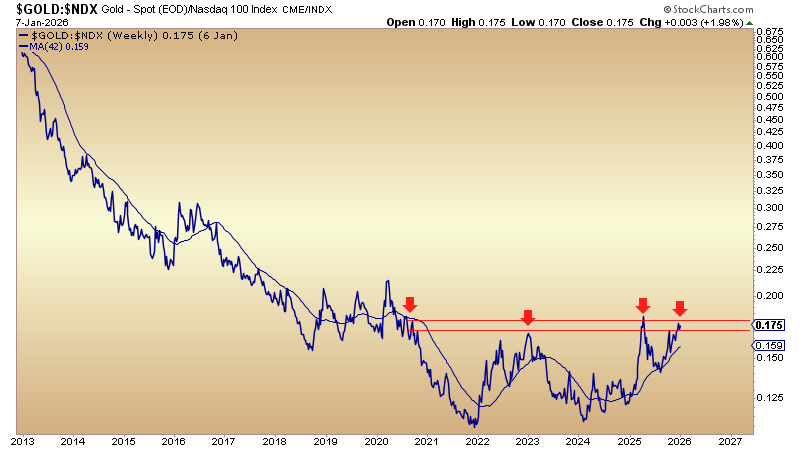
2) Silver vs. Foreign Currencies
This plots the price of Silver against the inverse of the US$ index. Monthly data.
Another way to look at it is Silver X US$.
As we've said for years, Gold/FC has led the Gold price and so the same is true for Silver/FC.
Much of the most recent move in Silver has been US$ weakness. It does need to strengthen against the other currencies.
When it does....it's going to make a new all-time high before Silver does in $ terms.

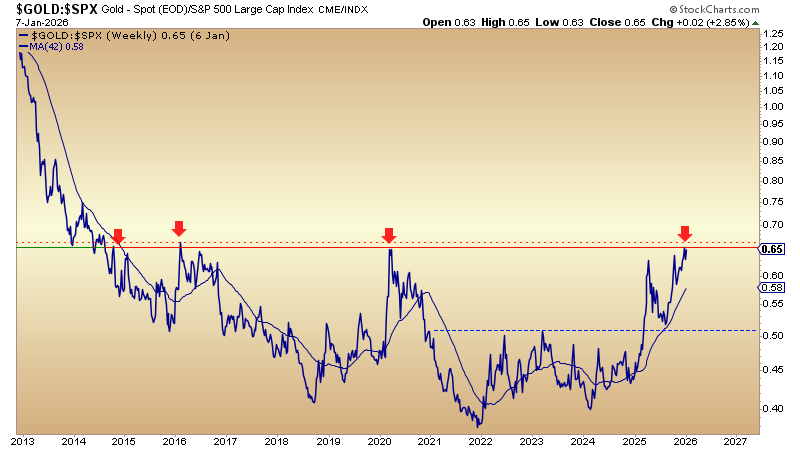
3) Silver vs. 60/40 Portfolio
This is a look at Silver against the conventional investment portfolio.
This ratio is trading around a 5-year high but we cannot deem it a breakout until it tests the 2020 peak.
The moving averages are aligned and sloping higher gently, mirroring the gentle rise in the ratio.
The 2016 and 2020 peaks are very close. So there is a 11-year-long base of resistance.
If and when the ratio surpasses that red line and 11-year-long resistance, it signals, Silver is ready to challenge and break resistance at $50.

4) Inflation-Adjusted Price of Silver (Silver/CPI)
In past tweets and threads, I have shown how and why the inflation-adjusted price of Gold is a fundamental indicator for Gold Miners.
The gold stock indices tend to follow Gold/CPI over the long-term.
The same is also true for Silver/CPI and silver stocks.
We can see it in the chart. Silver/CPI is the top and the SIL ETF is the bottom.
Silver/CPI will not update until we get the June CPI data.
But we will see the inflation-adjusted price of Silver breaking out of a 12-year-long base.
This bodes extremely well for Silver stocks. They should outperform if Silver moves to $40 over the medium term.

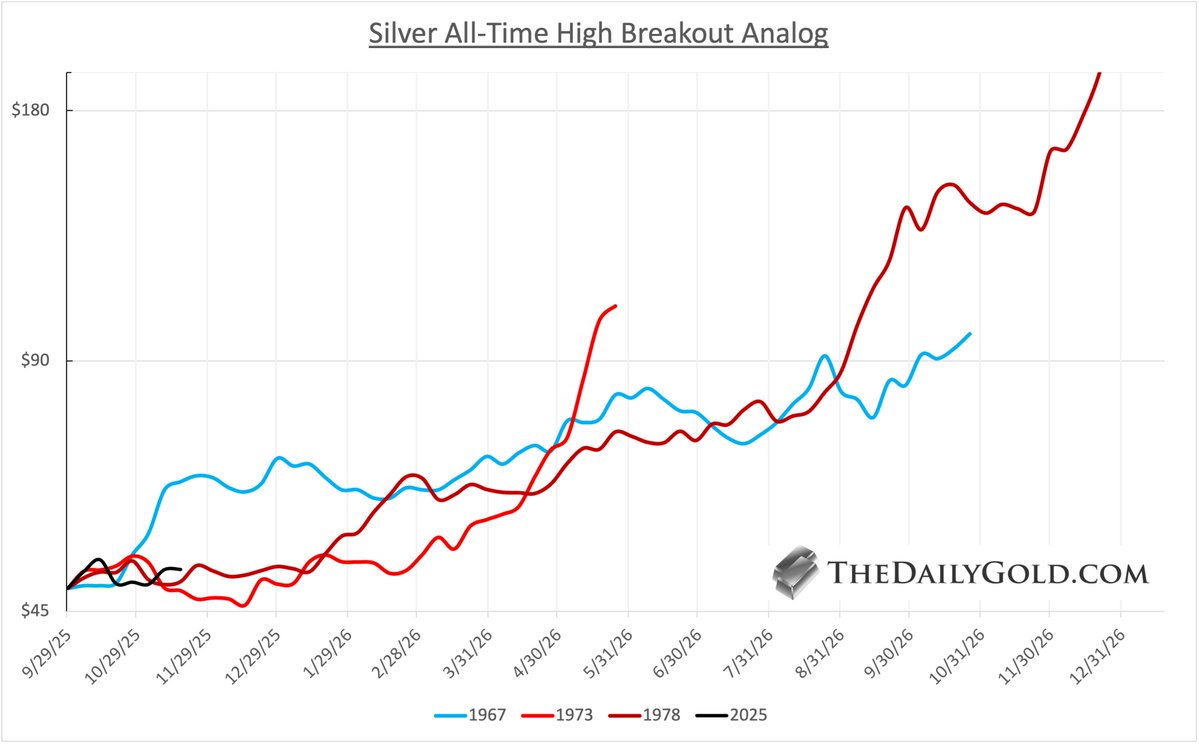
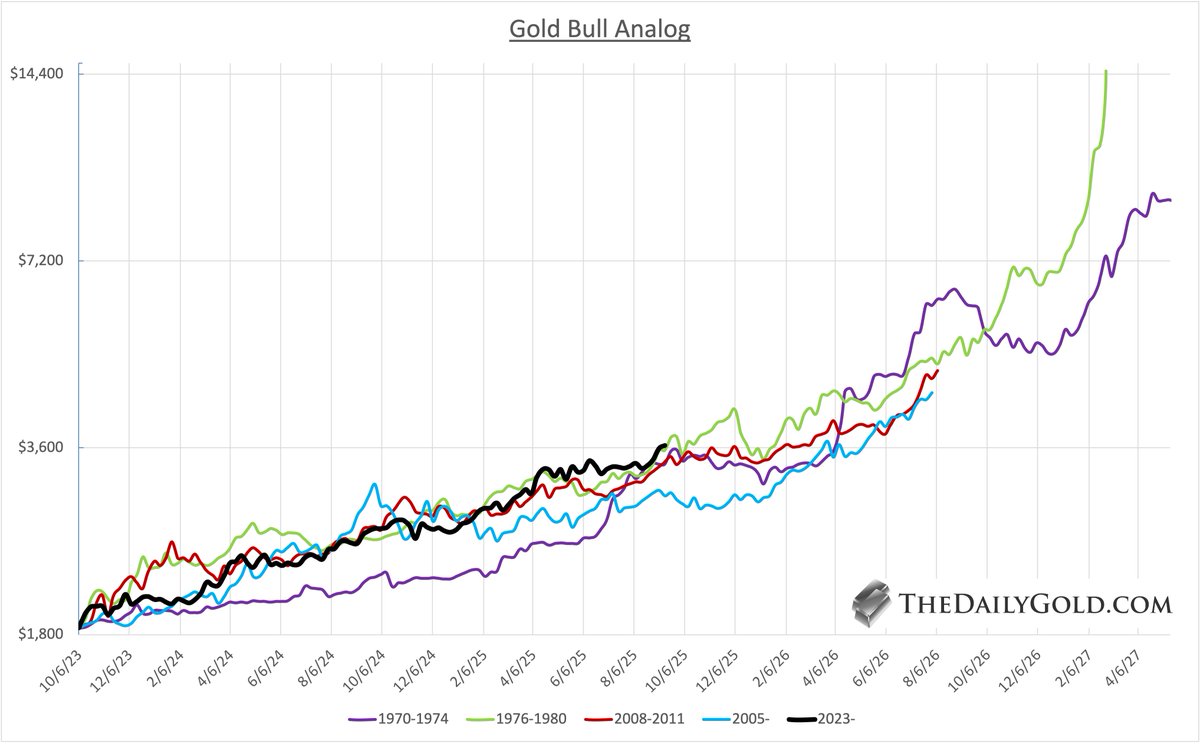
5) Silver Performance Following Gold Breakouts to All-Time Highs
We plot Silver's performance following Gold's 3 other sustained moves to new all-time highs.
We include an average of the 3 as well as an average of the weaker 2.
Silver's performance remains on the low end, but it is starting to perk up.
We plot Silver's performance following Gold's 3 other sustained moves to new all-time highs.
We include an average of the 3 as well as an average of the weaker 2.
Silver's performance remains on the low end, but it is starting to perk up.

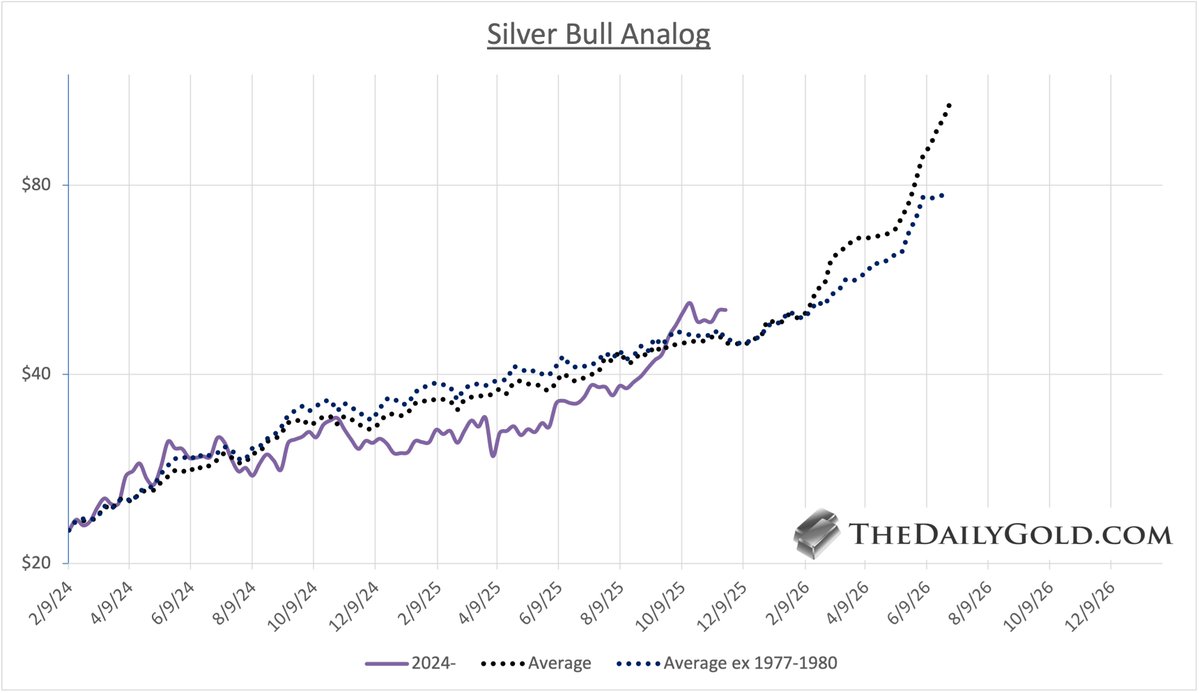
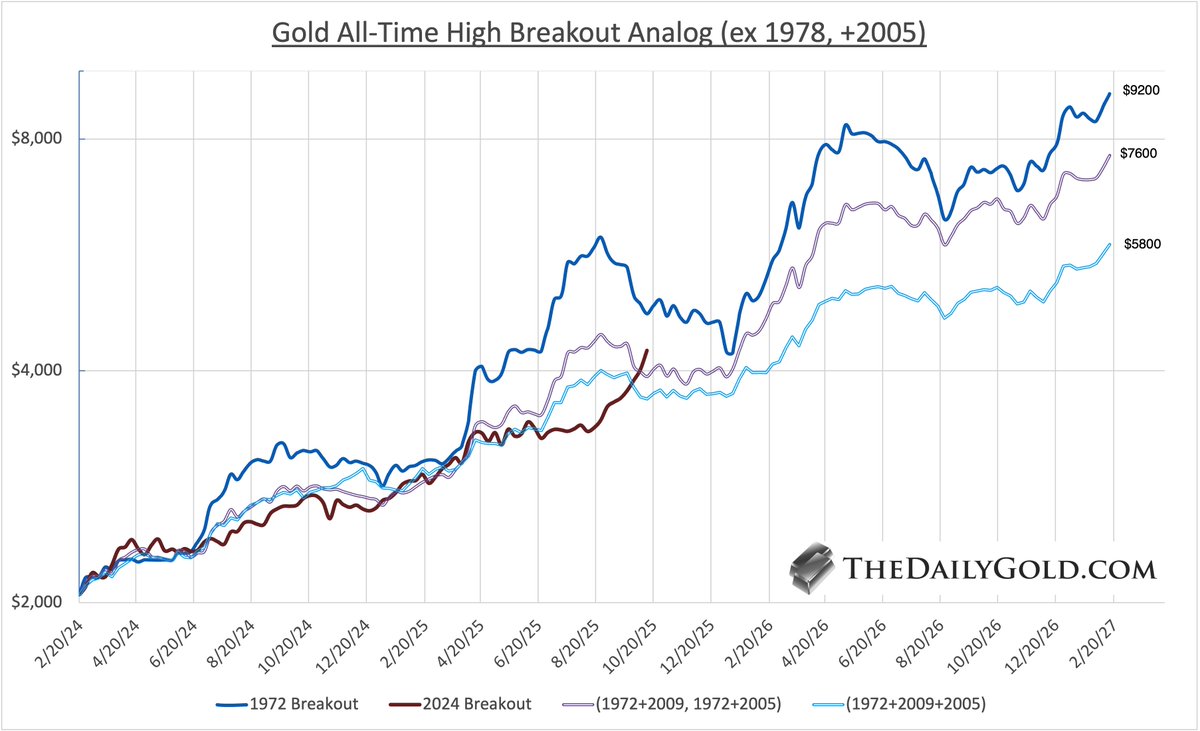
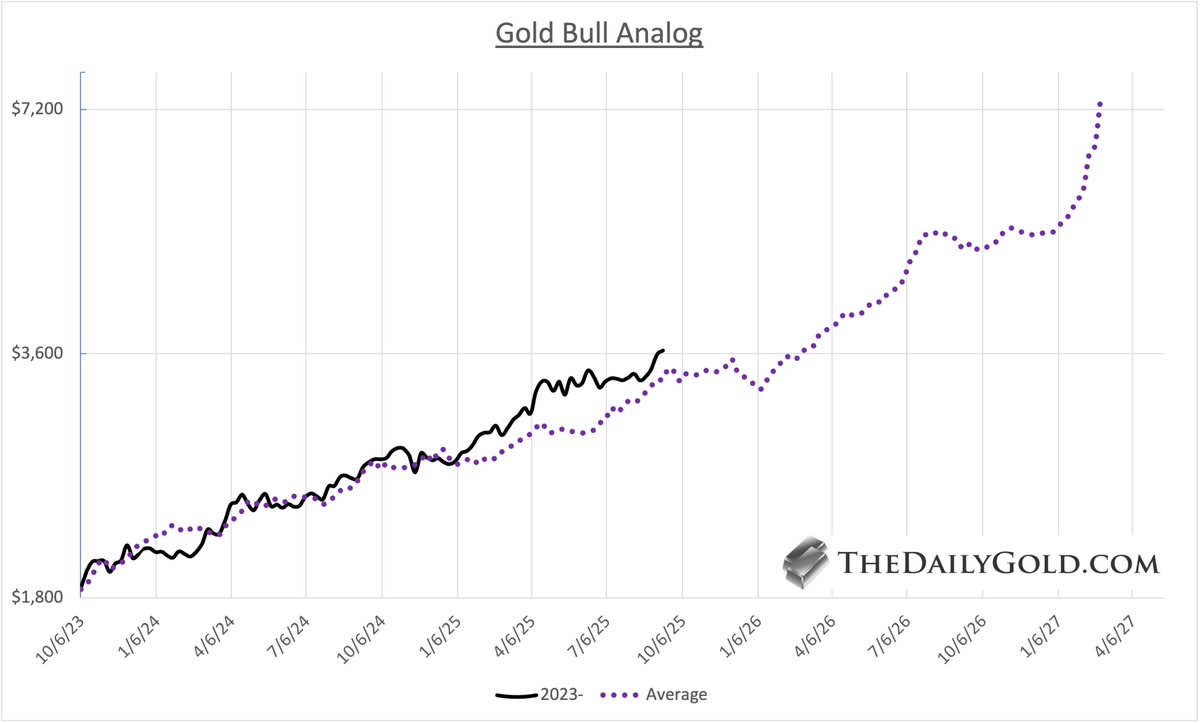
6) Silver Performance Following Gold Breakout in 1972
I have written about why 1972 is the best comp for Gold today.
Silver broke-out to a new all-time high in 1973, which was the first time it pierced the Civil War spike.
In decluttering the previous chart (for my own analysis), I noticed something.
Silver is tracking its own performance in 1972 closely.

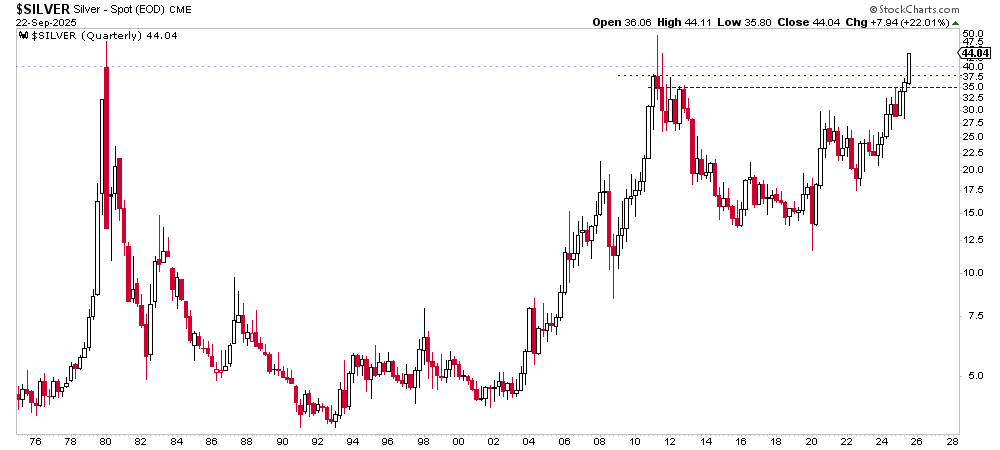
7) Silver Daily Chart
I really want Silver to consolidate more, but unfortunately for me, it has formed a bull flag.
Its recent breakout has a rough measured upside target of $41.
The bull flag also projects to $41.
And $41 is the last area of resistance until $50.
I really want Silver to consolidate more, but unfortunately for me, it has formed a bull flag.
Its recent breakout has a rough measured upside target of $41.
The bull flag also projects to $41.
And $41 is the last area of resistance until $50.

• • •
Missing some Tweet in this thread? You can try to
force a refresh