Finding high quality Gold & Silver stocks w/ 5 to 10-bagger potential
Master of Financial Technical Analysis
16 Years Married to my best friend, the best wife.
Jun 4 • 8 tweets • 3 min read
Thursday 🧵
The intermediate-term correction in precious metals is getting long in the tooth—but it’s not over yet.
Here are 5 charts I’m watching that could signal the end.
Let's Go!
1) Gold: Post-Breakout Correction Analog
There have only been 3 major breakouts in Gold.
The first significant correction after each one follows a clear pattern.
The current pullback is right on script—still needs a little more time and price.
Jan 7 • 8 tweets • 4 min read
New 🧵
The 5 key breakouts to watch in 2026.
After two years of powerful moves in Gold and Silver, a handful of major inflection points are still on deck.
Here are the 5 that matter most.
Let's Go!
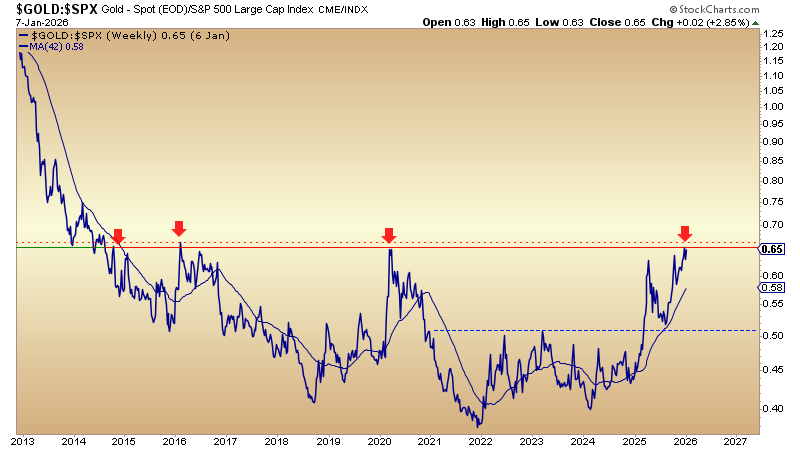
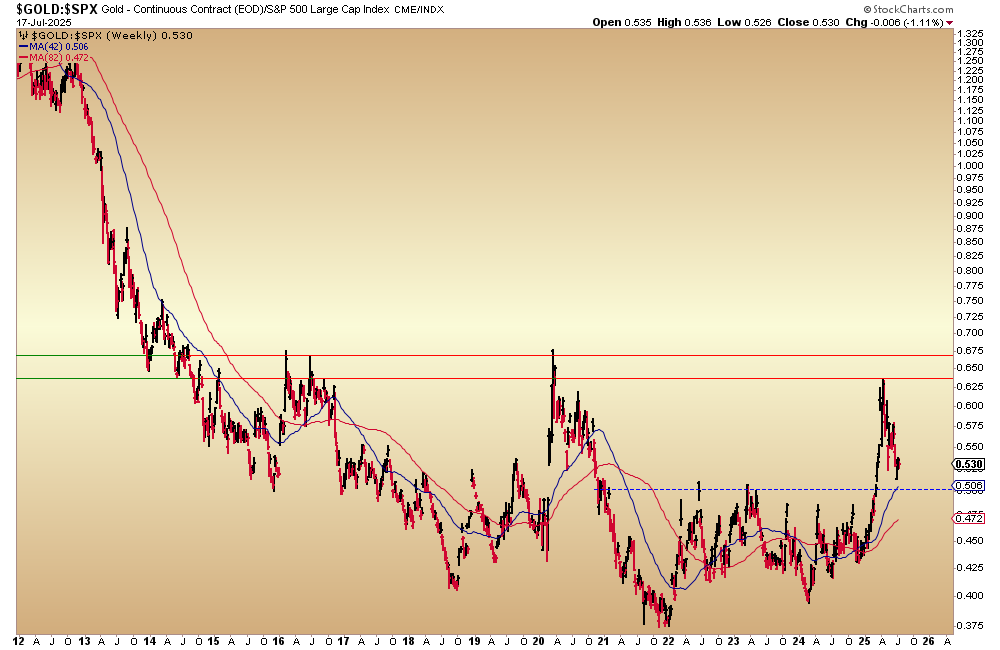
1) Gold vs. Stock Market
In early 2025, Gold broke out of a 4‑year base vs. the S&P 500, unleashing stronger flows into precious metals, especially miners and juniors.
Yet broad equities kept grinding higher as herding into stocks persisted.
Now the Gold/S&P 500 ratio is pressing against a much larger 12‑year base, and a breakout here could spark a far more dramatic rotation out of stocks and into Gold and precious metals.
Dec 11, 2025 • 9 tweets • 4 min read
Thursday 🧵
Some 170-Year-Long Charts For You.
These 6 Charts Explain Everything About Gold & Silver
Let's Go!
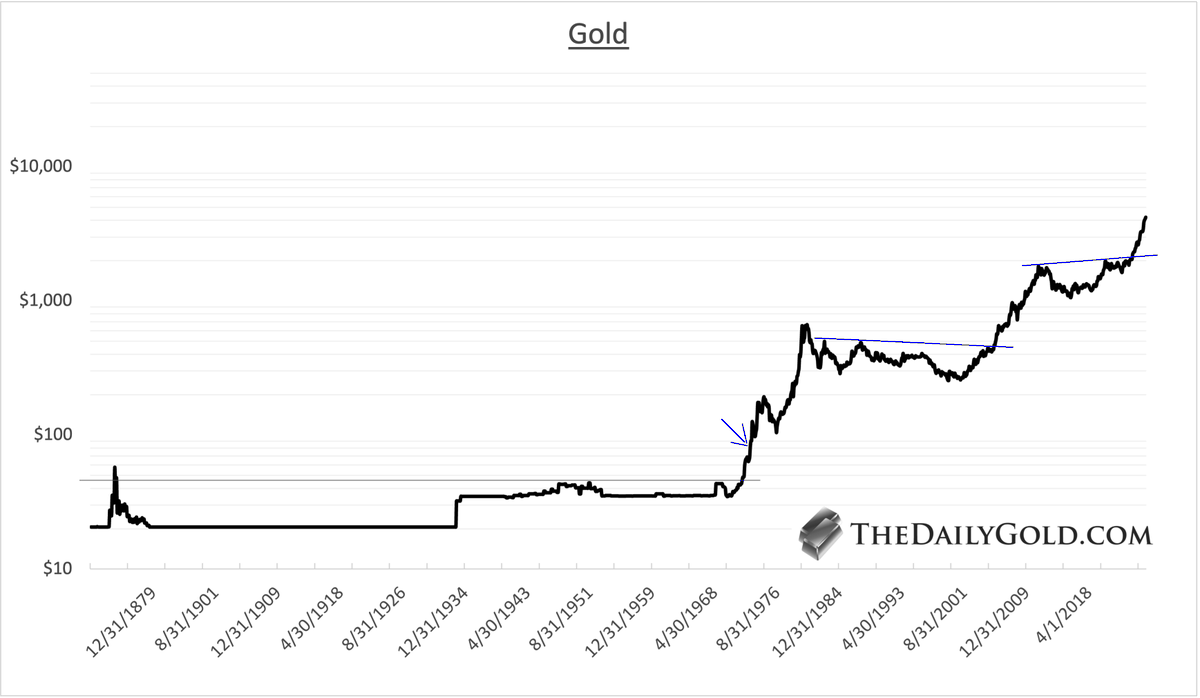
1) Gold Historical Chart
Gold is mirroring its performance from the early 1970s.
Specifically, it resembles 1972-1973.
There was a 24 month period from 1971 to 1973 when Gold surged 225% and endured only a single 13% correction along the way.
The arrow in the chart shows where we could be based on that template.
My all-time high breakout analog chart shows that the average of the 1972 and 2005 breakouts puts the current move at $7000/oz in March of 2027.
Gold may needs a 20% correction between now and then to reach that target.
Nov 20, 2025 • 9 tweets • 4 min read
Thursday 🧵
Silver Update.
6 Charts.
Let's Go!
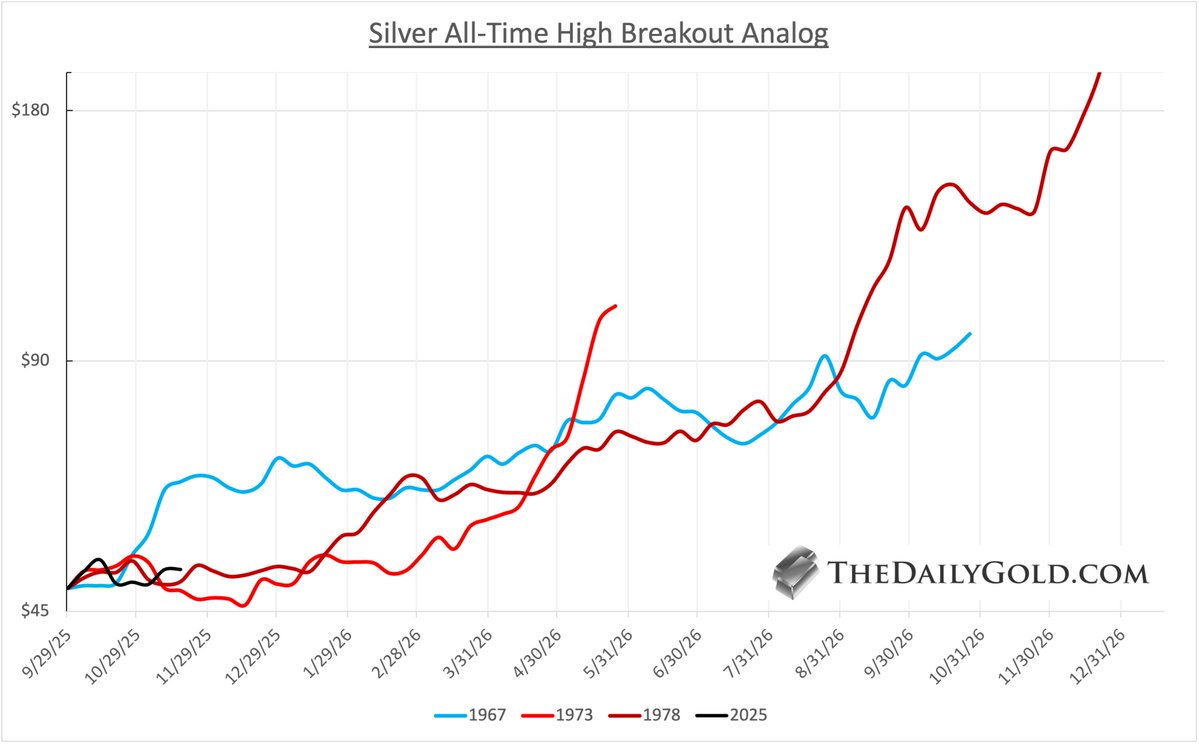
1) Silver All-Time High Breakout Analog
I may have to adjust this chart depending on how Silver corrects.
However, the reality is clear.
History argues that once Silver takes out $54, it should reach $90-$100 within 7 to 11 months.
It's 3/3 in history and will be 4/4.
Oct 21, 2025 • 9 tweets • 4 min read
Tuesday 🧵
Gold is at an Intermediate Term Peak
But Still Has a Very Long Way to to its Secular Peak
Let's Go!
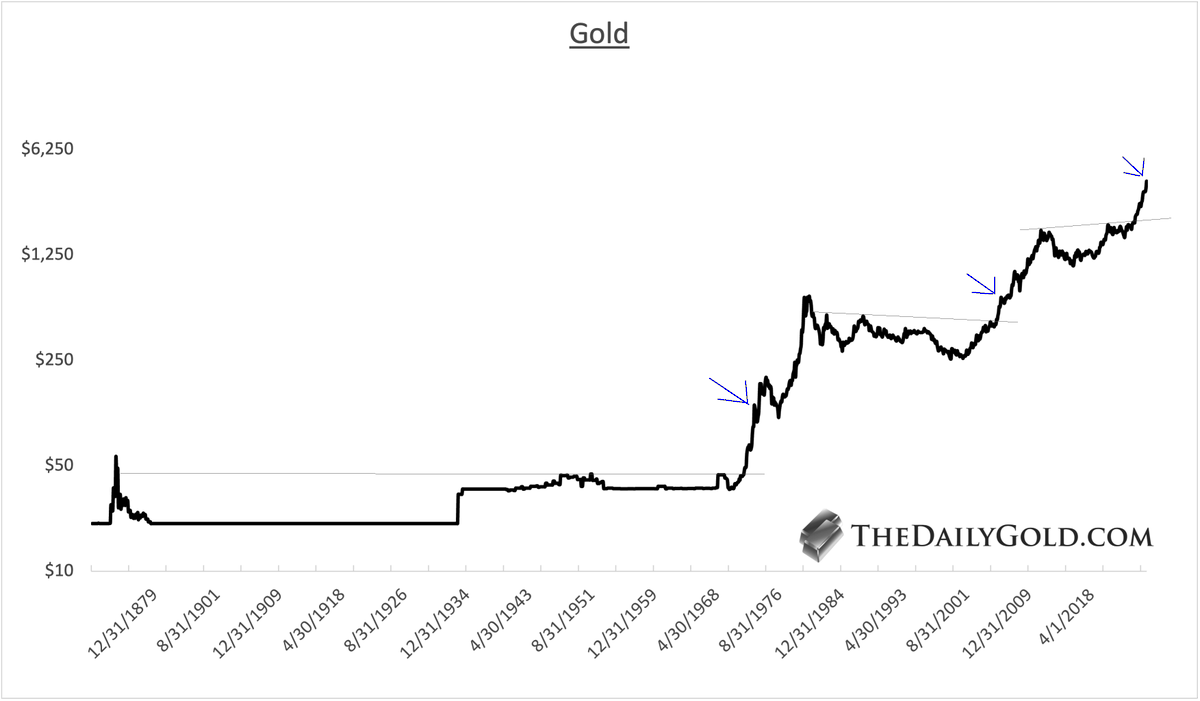
1) First Correction Post-Major Breakout
Gold has begun its first major correction since the major breakout of March 2024.
Gold has had three major breakouts in its history.
1972, 2005 and 2024
The arrows show similar points on this monthly, historical chart.
Sep 23, 2025 • 9 tweets • 4 min read
Tuesday 🧵
My updated Silver charts & analysis.
Let's Goooo!
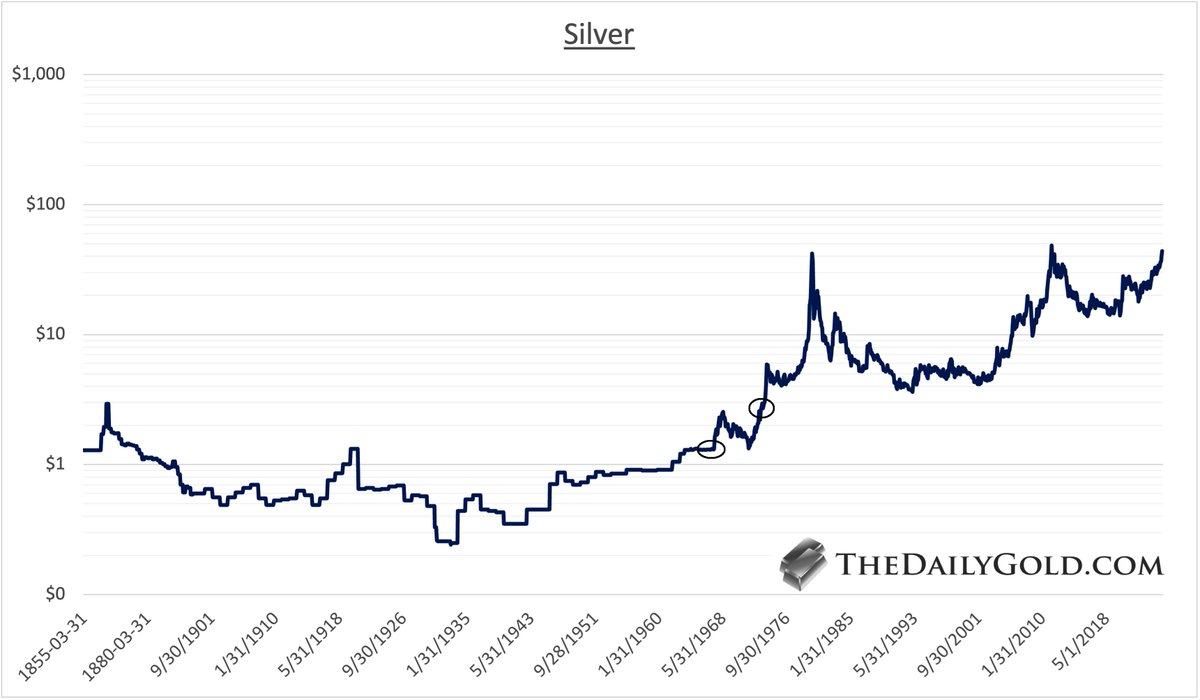
1) Silver Historical Chart
The circles show breakouts to new all-time highs.
The first circle was a new modern all-time high, the highest level since the Civil War.
Silver, which was trading around its 1920 peak, basically doubled in 1967, eclipsing the 1920 peak.
This lead to a mania in silver juniors in 1967-1968.
The equivalent today would be a pop to $100.
The breakout in 1973 led to a 120% pop in 4 months.
Sep 9, 2025 • 9 tweets • 4 min read
Tuesday 🧵
Gold & Silver Analog Charts Updated
These are some of my best and favorite charts.
Let's Go!
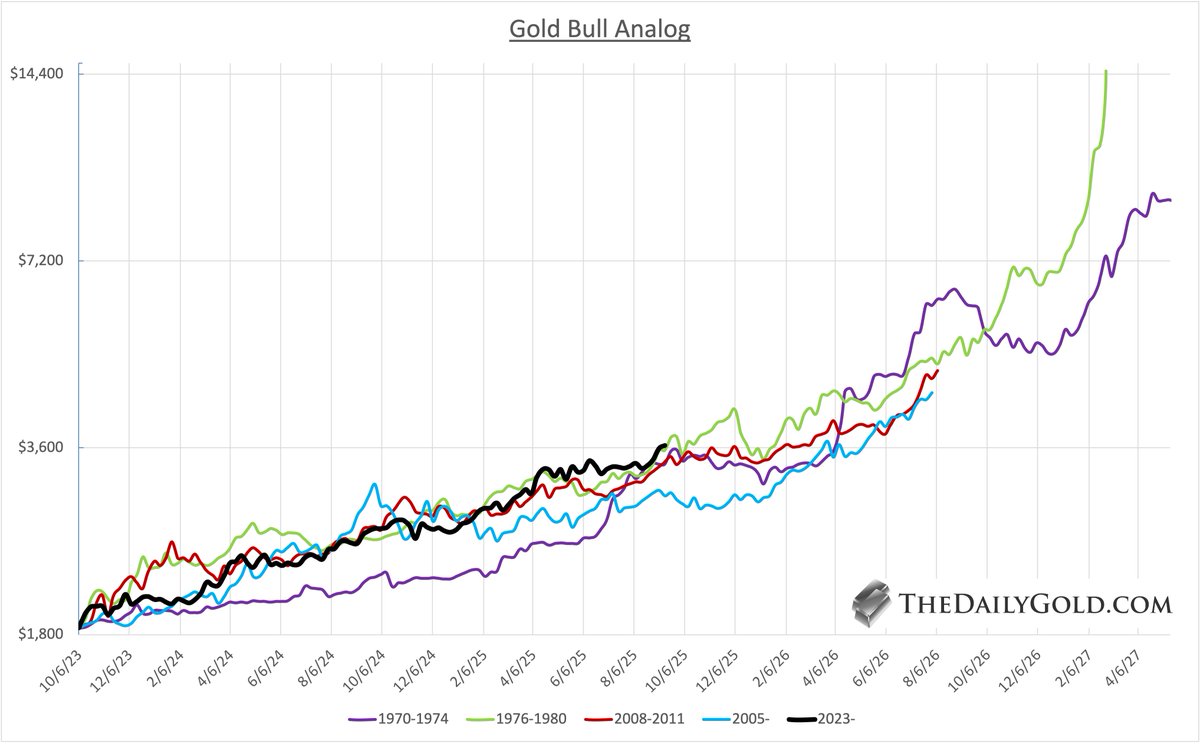
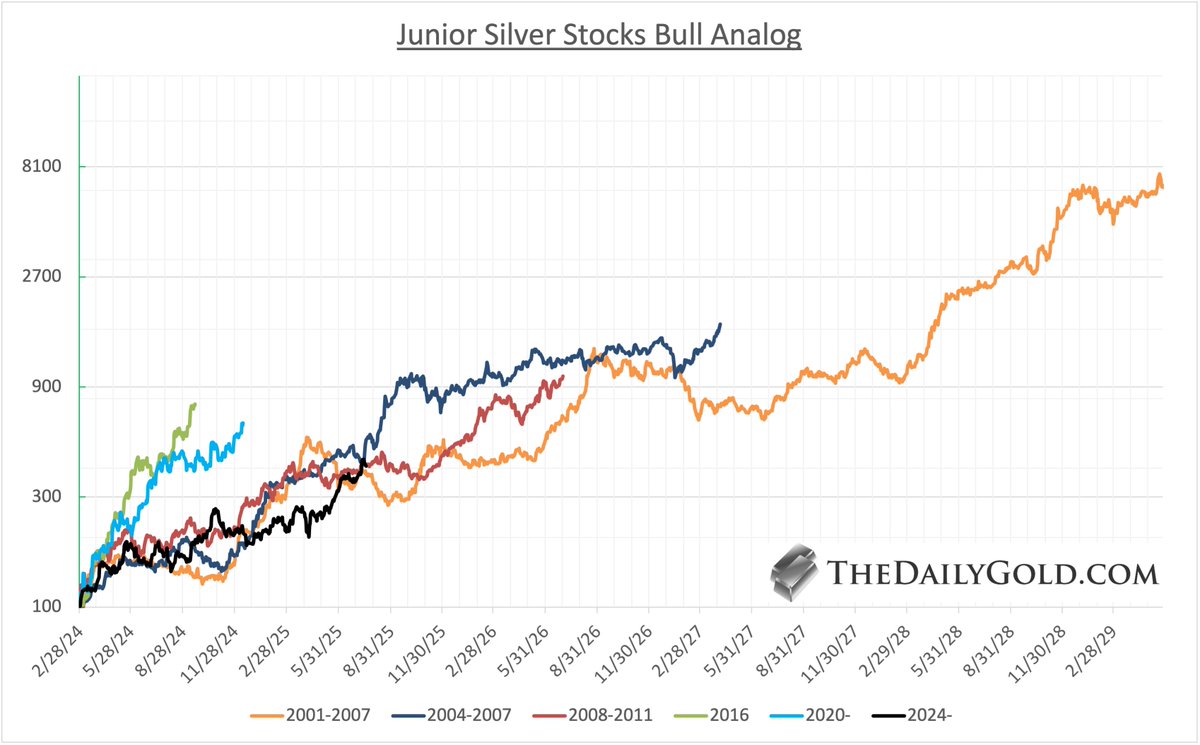
1) Gold Bull Analog
This chart plots the 4 strongest cyclical moves in Gold, on the scale of the current move that began October 2023.
(I start the moves when an impulsive uptrend begins).
Nearly two years in, and Gold has followed the template almost to a T.
The two weaker moves peaked just below $5000 in August 2026.
The two others (1970-1974, 1976-1980) peaked at ~$9,000 and ~$14,000.
Sep 2, 2025 • 9 tweets • 4 min read
Tuesday 🧵
Silver Price Expectations & Prediction for 2026-2027
Let's Go!
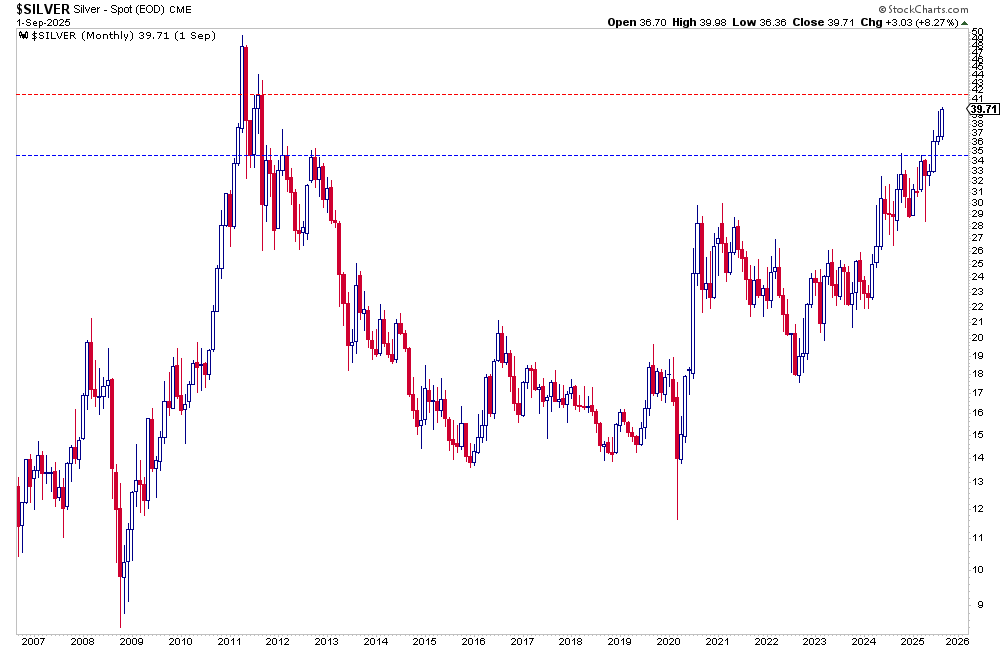
1) Silver Near Term to Medium Term
Spot Silver closed August just below $40.
In June, Silver broke-out from a 9/10-month long consolidation, that projects to an upside target of $41.
The monthly chart below and weekly chart show $42-$43 as the next significant resistance.
Aug 26, 2025 • 10 tweets • 5 min read
Thursday 🧵
This is an especially import one.
No 2008 Replay for Gold or Gold Stocks is Coming Anytime Soon.
I explain why.
Let's Go...!
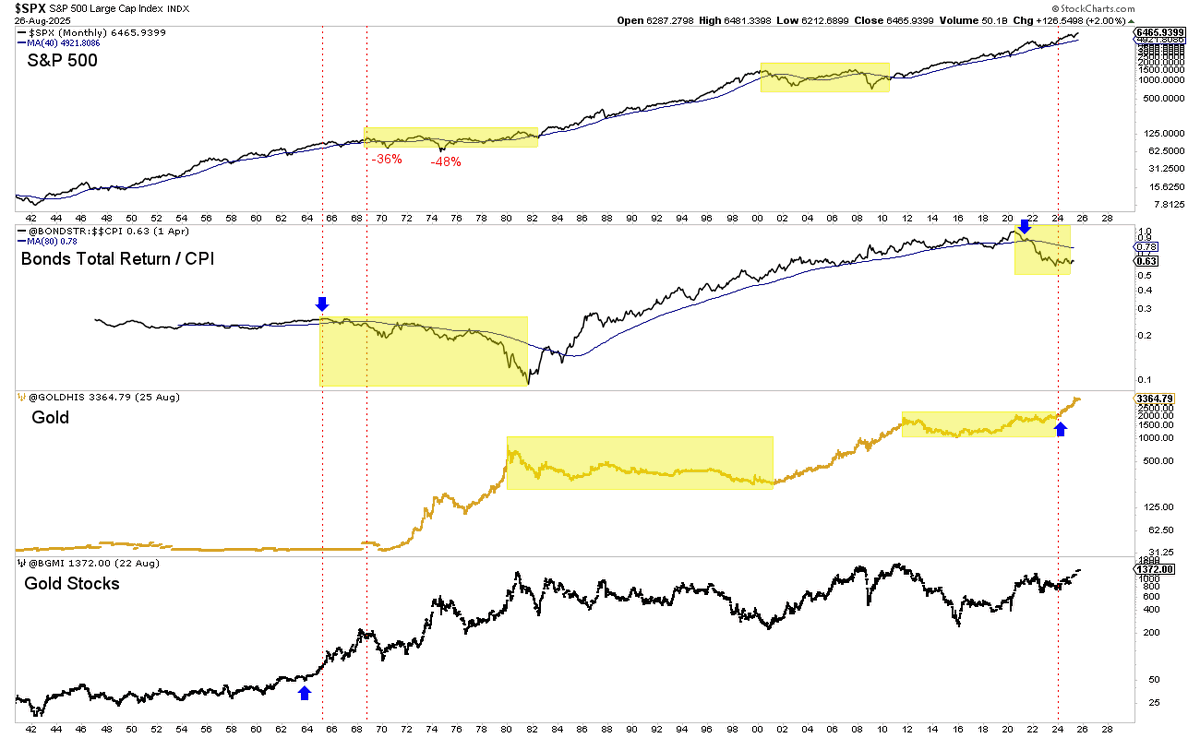
1) There is a secular bear market in Bonds
Unlike in 2008, Bonds are in a new secular bear market.
This is confirmed by the loss of the 80-month moving average of Total Real Return.
From 1920 to 2020 (100 Years), the only secular bear in Bonds was during 1965 to 1982.
😮
Jul 24, 2025 • 13 tweets • 4 min read
Thursday 🧵
Juniors vs. Seniors
Why you should focus on junior mining and junior developer stocks instead of senior mining firms.
(Tangent about Silver near the end).
Let's Go!
1) Are you willing to do the work (as Rick Rule says)?
Then junior resource companies are a better option for investors and speculators seeking growth and capital appreciation.
If not, close this thread and carry on with your scrolling.
Jul 17, 2025 • 9 tweets • 4 min read
Most Important Future Breakouts in Precious Metals
Thursday 🧵
There have been several important breakouts already.
But today I look at the breakouts which will signal the next major leg higher is starting.
Let's Go!
1) Gold vs. S&P 500
Gold against the stock market is trading within an 11-year-long base.
Breaking out from this base will be extremely significant and set the stage for Gold to run to $5000 and much higher.
Capital still finds US equities a reasonable bet relative to Gold. When that changes, as evidenced by this chart, look out.
This year, Gold broke out of a 4-year-long base against the stock market and surged higher to the lower end of the 11-year-long resistance.
It overshot and pulled back as the stock market rebounded and made a new high.
The sooner Gold stabilizes here (it may have already) and resumes an uptrend, the sooner Gold can breakout and run to $4000.
Jul 11, 2025 • 8 tweets • 3 min read
Everyone is making money now. Good!
Making money in a junior mining bull market is the easy part.
Knowing when and how to sell is the hard part.
Don't want to lose your gains in junior gold and silver stocks?
A Friday 🧵
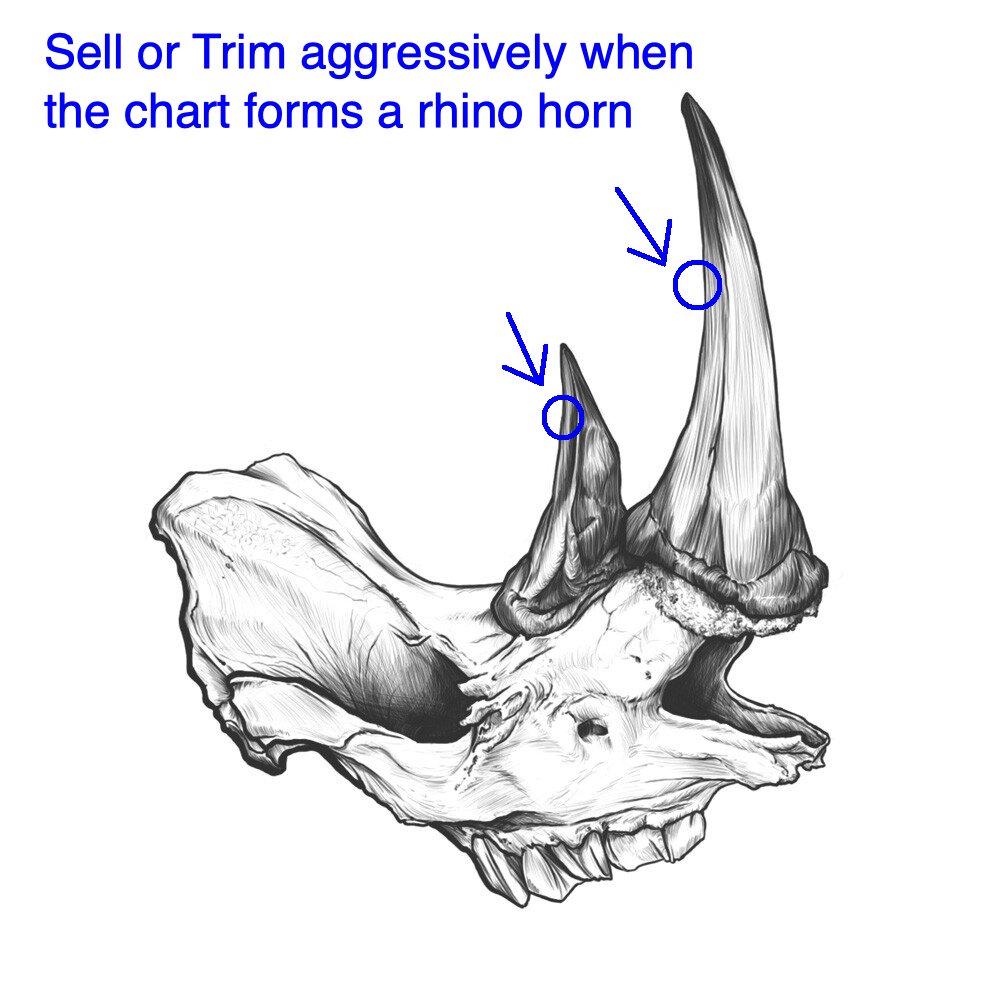
Judging when to trim or take profits...
1) Assess the company's current fundamental value
This is subjective but a good analyst can do this.
What is the company's value, right now? Not in 1-2 years, not at $50 Silver or $5000 Gold. Right now?
What will they cash flow in 2025?
What is their project worth right now?
Use economic studies to help measure value.
Also, and this could be a 1-B, how does the company's current value compare to other companies?
When you have a company that is overvalued relative to a group of other companies (like the others in your portfolio), that is a signal.
Jul 4, 2025 • 8 tweets • 4 min read
The Most Important Silver Charts Right Now
A Holiday 🧵
Let's Gooo!
1) Silver Historical Chart
Simplicity is beauty.
Silver is setting up for the greatest breakout in the history of capital markets since 1972, when Gold broke out from an over 100-year-long base.
Silver itself broke to new all-time highs in 1973 (circle).
The historical chart dates back 170 years.
Breaking $50/oz is going to be extremely significant and lead to spectacular moves and volatility.
Jun 5, 2025 • 9 tweets • 4 min read
Silver breaking $50 = 2nd Greatest Breakout of All-Time
& The Greatest Breakout in 52 Years
How Does This Compare to Other Breakouts?
A Thursday 🧵
The 7 Greatest Breakouts of All-Time
1) 7th Greatest Breakout of All-Time: Copper 2005
Copper in 2005 broke-out from a 31-year base.
Copper exploded 170% in the first 12 months post-breakout.
I would have expected it to run more but the GFC had an impact.
It made additional gains after the GFC but it was a breakout where all gains came from the initial move post-breakout.
May 19, 2025 • 7 tweets • 3 min read
5 Gold Charts Catching My Eye Right Now
A 🧵
Here we go.....
1) Record Number of Fund Managers Think Gold is Overvalued
The Bank of America Fund Manager Survey shows the highest amount of fund managers in 18 years think Gold is overvalued.
Keep two things in mind here.
First, the survey dates back to 2008.
So, 2008-2011 and 2024-2025 are the only points during which Gold was in a secular bull market. And those are the points that need to be compared to today.
So there is not enough data for a proper comparison.
Second, in a secular bull, sentiment data like this will run hot.
October/November 2024 had one of the highest readings ever. Gold corrected less than 10%, then exploded higher in early 2025.
Apr 25, 2025 • 7 tweets • 3 min read
Friday 🧵
Gold's interim peak is in and a correction is underway.
Usually that means gold stocks, juniors and Silver will perform worse than Gold.
Not this time.
Let's see why....
1) Let's look at a few historical precedents.
Starting with 2003
In late 2002 and into 2003, Gold made a big breakout move, clearing the low $3000s and a 5.5-year-long base.
It was very significant at the time.
Then Gold corrected and consolidated for a good 6 months before it began to break from its correction.
At one point, Gold was at the same price as it was 9 months earlier. No progress.
But the miners and juniors, after an initial selloff surged higher. Juniors really launched.
(GDXJ data pre 2004 is my own index).
Silver to Gold ratio bottomed in the middle of this period.
Apr 1, 2025 • 8 tweets • 4 min read
Tuesday 🧵
Yesterday was the end of the quarter.
Time for quarterly charts!
Let's goooooo.....
1) Gold Quarterly Chart
Gold closed the quarter on the high, which is a sign of strength.
The RSI compares to 1972, 1979, 2006 and to a lesser degree 2009.
The 2006 peak was after a huge breakout of a 23-year base but was not at all-time highs.
The extreme RSI in 1979 was in the middle of a blowoff top.
1972 is the best comparison because that peak followed a significant breakout to a new all-time high.
Gold corrected 13% then before exploding much higher.
Gold is only 12 months removed from breaking out of a 13-year base. This is critical to keep in mind.
Mar 26, 2025 • 7 tweets • 3 min read
When Silver's Big Move Against Gold Begins
A 🧵
Let's Goooooo!
1) Background
It has been a heck of a last year for precious metals. A year ago, Gold broke out from its 13-year cup and handle pattern, and days ago, it reached its measured upside target of $3,000/oz.
Quality miners and quality junior mining companies have surged higher.
Silver has moved higher alongside Gold but has not outperformed Gold yet. It has gained roughly the same amount as Gold in the past 13 months.
However, since the May 2024 peak, Silver is up only 4% while Gold is up nearly 25%.
Part of the issue is that Gold, after clearing $2100/oz, has been able to enjoy blue sky territory (no overhead resistance) while Silver has had to chew through multiple resistance levels between $26 and $35/oz.
Mar 20, 2025 • 7 tweets • 3 min read
Thursday 🧵
Gold & Silver Bull Analog Charts Updated
Let's Go!
1) Gold All-Time High Analog
This chart plots Gold's performance after the 3 breakouts to All-Time Highs that held. (2007 & 2020 breakouts did not hold).
There are four: 1972, 1978, 2009, 2024
Current move is hugging the top average line. The two average lines are close together.
Even if Gold follows the weakest of the other three, it could be at $4000/oz in 11 months.
Mar 12, 2025 • 9 tweets • 4 min read
The Most Important Indicator for Gold is Turning Bullish
...For the First Time in Almost 25 Years
A 🧵
1) Introduction to Critical Gold Relationships
We have written about the importance of Gold outperforming the stock market for nearly a decade. In addition, we expanded this concept by including Bonds to construct a 60/40 Portfolio.
In recent years, the bull market in precious metals has not felt like one due to the stock market’s strength, which has limited capital flows in precious metals.
However, that is beginning to change as capital has already started to move out of the Mag7, tech, and conventional stocks in favor of Gold.
Gold against the stock market has broken out and reached a 4-year high, while Gold against the 60/40 conventional investment portfolio is breaking out of a 10-year-long base.
Feb 22, 2025 • 8 tweets • 3 min read
Precious Metals Weekly Chart 🧵
1) Strong weekly close for Gold, but rest of sector not so much.
High of $2973, Gold has measured upside targets of $3000 and $3050.