Quants use principal component analysis to find alpha.
Blackrock uses it to manage $100s of billions in factor funds.
Northfield uses it to earn $10s of millions selling factors to investors.
Here’s how it’s done.
In a few lines of Python:
Blackrock uses it to manage $100s of billions in factor funds.
Northfield uses it to earn $10s of millions selling factors to investors.
Here’s how it’s done.
In a few lines of Python:

By reading this thread, you’ll be able to:
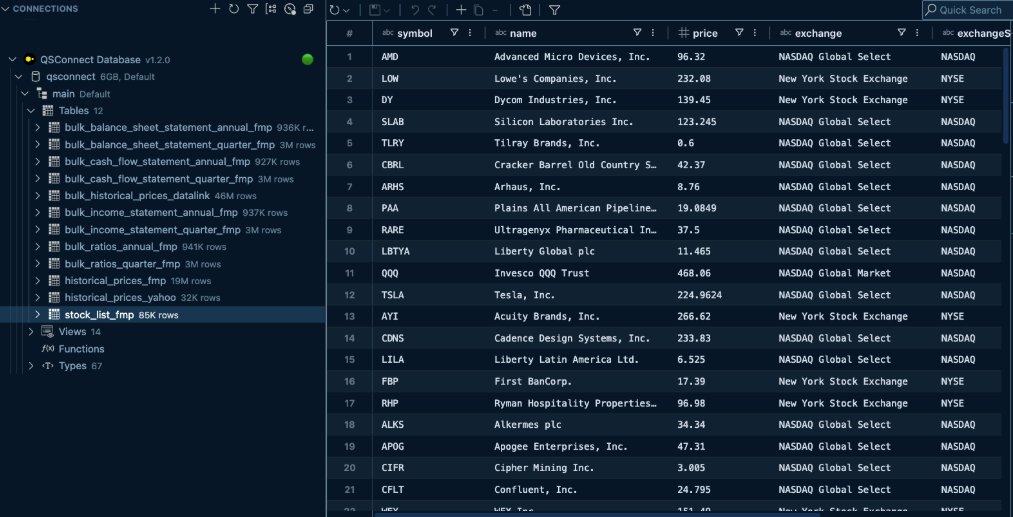
1. Get stock data
2. Fit a PCA model
3. Visualize the components
4. Isolate the alpha factors
But first, a quick primer on PCA if you’re unfamiliar:
1. Get stock data
2. Fit a PCA model
3. Visualize the components
4. Isolate the alpha factors
But first, a quick primer on PCA if you’re unfamiliar:
PCA is used in many ways including signal processing, image recognition, and of course quant finance.
PCA:
• Isolates factors that drive returns
• Explains the variance in a dataset
• Used for factor investing and risk management
Let’s dig in!
PCA:
• Isolates factors that drive returns
• Explains the variance in a dataset
• Used for factor investing and risk management
Let’s dig in!
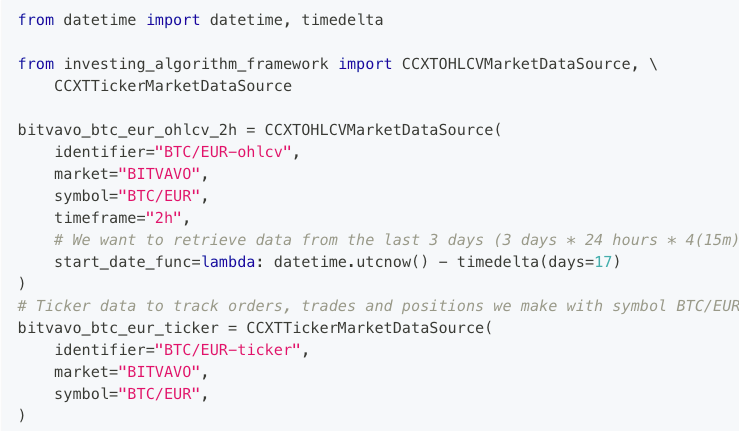
Start by importing the libraries.
sklearn is a package used to build statistical models for data analysis.
sklearn is a package used to build statistical models for data analysis.

Next, build a portfolio. You can pick any stocks you want.

sklearn makes it easy to fit a PCA model and get the components.
Fit the model with the portfolio returns and the algorithm will look for the top three components that explain most of the variance in the returns.
Fit the model with the portfolio returns and the algorithm will look for the top three components that explain most of the variance in the returns.

After you fit the model, grab the explained variance and components (remember the underscore).

If the description of PCA is unclear, a chart should help.
But first, build it.
But first, build it.

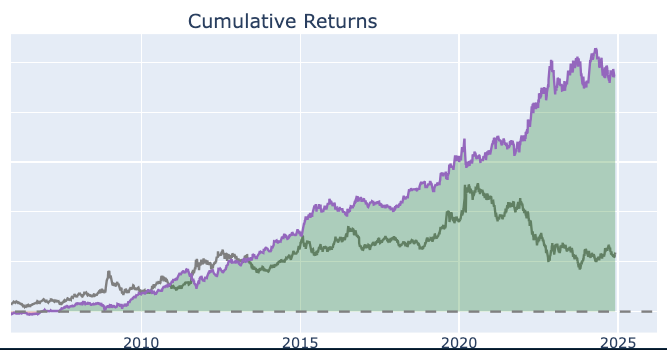
The left shows the contribution of the components toward the total variance.
The first explains 54.9%.
This is usually driven by the overall market movement.
The right is the cumulative sum of the contribution of each component which explains 84.7% of total portfolio returns.
The first explains 54.9%.
This is usually driven by the overall market movement.
The right is the cumulative sum of the contribution of each component which explains 84.7% of total portfolio returns.

The forces that move stock prices are isolated as the principal components.
The market, interest rates, and the pandemic drive returns.
PCA lets you isolate these statistical factors to get an idea of how much the portfolio’s returns come from these unobserved features.
The market, interest rates, and the pandemic drive returns.
PCA lets you isolate these statistical factors to get an idea of how much the portfolio’s returns come from these unobserved features.

Similar stocks will be driven by similar factors.
PCA makes it easy to visualize it.
PCA makes it easy to visualize it.

You can see the tech stocks and the gold stocks clustered together.
This component is more strongly driving the gold stocks.
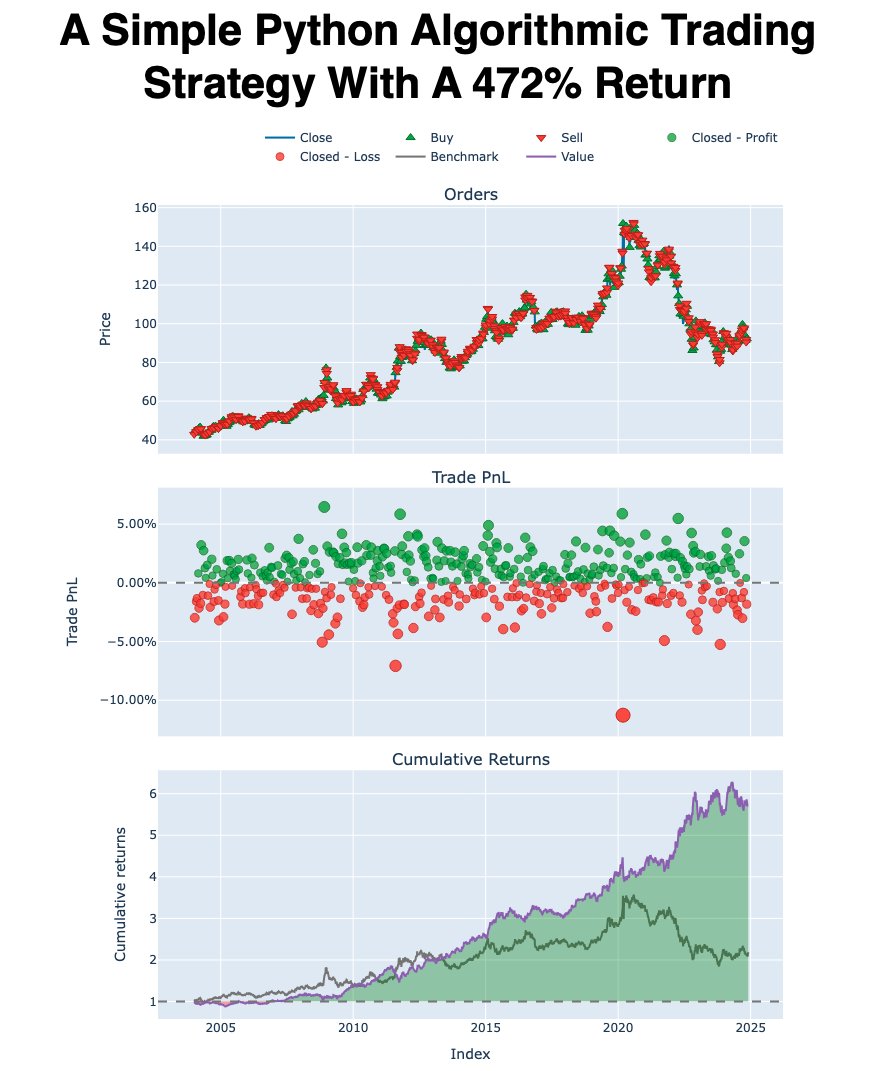
Another great way to visualize this is with a scatter plot.
This component is more strongly driving the gold stocks.
Another great way to visualize this is with a scatter plot.

Another great way to visualize this is with a scatter plot.

You can see how the stocks are driven by the first two principal components.
Gold stocks were largely driven by factor one and tech stocks were negatively driven by factor two.
Gold stocks were largely driven by factor one and tech stocks were negatively driven by factor two.

This analysis covered the time period during covid.
Gold stocks were bid up strongly as a hedge against inflation and uncertainty.
Tech stocks crashed as worries about economic health began.
These factors are hidden in the data.
PCA helps you find them.
Gold stocks were bid up strongly as a hedge against inflation and uncertainty.
Tech stocks crashed as worries about economic health began.
These factors are hidden in the data.
PCA helps you find them.
Want to learn how to build algorithmic trading strategies in Python (that actually work)?
👉 Join us live for our free training (500 seats): learn.quantscience.io/become-a-pro-q…
👉 Join us live for our free training (500 seats): learn.quantscience.io/become-a-pro-q…
That's a wrap! Over the next 24 days, I'm sharing my top 24 algorithmic trading concepts to help you get started.
If you enjoyed this thread:
1. Follow me @quantscience_ for more of these
2. RT the tweet below to share this thread with your audience
If you enjoyed this thread:
1. Follow me @quantscience_ for more of these
2. RT the tweet below to share this thread with your audience
https://twitter.com/1683526993059430411/status/1941166226069225663
P.S. - Want to learn Algorithmic Trading Strategies that actually work?
I'm hosting a live workshop. Join here: learn.quantscience.io/qs-register
I'm hosting a live workshop. Join here: learn.quantscience.io/qs-register
• • •
Missing some Tweet in this thread? You can try to
force a refresh