In this THREAD I will explain “Price Action”
1. Volume
2. Trends
3. Divergence
🧵(1/17)
1. Volume
2. Trends
3. Divergence
🧵(1/17)

1. Volume
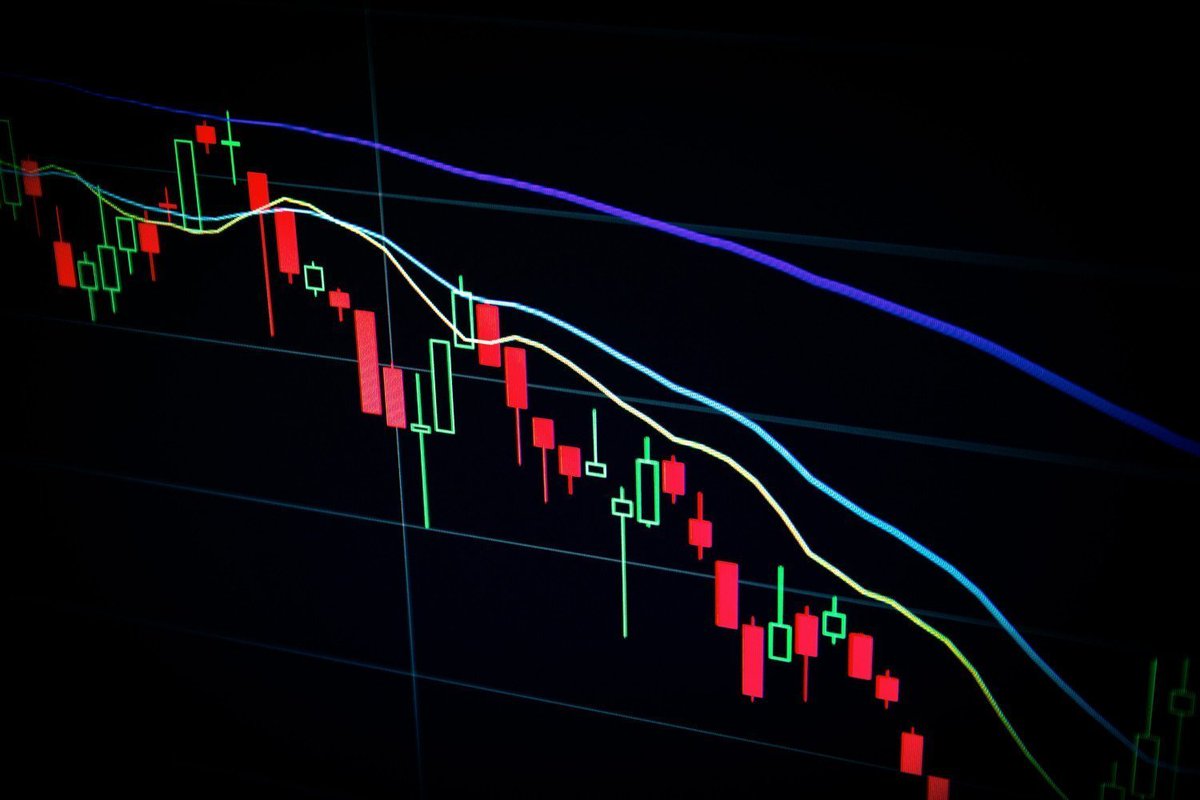
Volume refers to the total amount of a cryptocurrency that has been traded within a specific period.
It's a crucial metric for understanding market activity, liquidity, and potential price movements.
High volume suggests strong buying and selling interest.
Volume refers to the total amount of a cryptocurrency that has been traded within a specific period.
It's a crucial metric for understanding market activity, liquidity, and potential price movements.
High volume suggests strong buying and selling interest.

1.1 Volume
When comparing price and volume patterns, you’ll want to determine whether they align. If so, the probabilities favor an extension of the trend
If price and volume disagree, the underlying trend is not as strong this is called a volume divergence
When comparing price and volume patterns, you’ll want to determine whether they align. If so, the probabilities favor an extension of the trend
If price and volume disagree, the underlying trend is not as strong this is called a volume divergence

1.2 Volume
Volume normally leads to price during a bull move.
A new high in price that is not confirmed by volume should be regarded as a red flag.
Warning that the prevailing trading trend may be about to reverse
Volume normally leads to price during a bull move.
A new high in price that is not confirmed by volume should be regarded as a red flag.
Warning that the prevailing trading trend may be about to reverse

1.3 Volume
Indicators that will help you identify the volume:
On Balance Volume (OBV) measures buying and selling pressure.
As a cumulative indicator that adds volume on up days and subtracts volume on down days.
Indicators that will help you identify the volume:
On Balance Volume (OBV) measures buying and selling pressure.
As a cumulative indicator that adds volume on up days and subtracts volume on down days.

1.4 Volume
The volume oscillator is merely the ratio between two moving averages of volume.
It’s used to determine when the volume is expanding or contracting.
Expanding volume implies strength, and contracting volume implies weakness in the existing trend.
The volume oscillator is merely the ratio between two moving averages of volume.
It’s used to determine when the volume is expanding or contracting.
Expanding volume implies strength, and contracting volume implies weakness in the existing trend.

1.5 Volume
The MFI is an oscillator with a maximum of 100 and a minimum of 0.
When positive money flow is relatively high, the oscillator approaches 100.
When negative money flow is relatively high, the oscillator approaches 0.
The MFI is an oscillator with a maximum of 100 and a minimum of 0.
When positive money flow is relatively high, the oscillator approaches 100.
When negative money flow is relatively high, the oscillator approaches 0.

1.6 Volume
Volume pressure indicator analyzes buying and selling activity to assess market sentiment and potential trend reversals.
This type of indicator often visualizes buying and selling pressure using different colors or bar formations on a chart.
Volume pressure indicator analyzes buying and selling activity to assess market sentiment and potential trend reversals.
This type of indicator often visualizes buying and selling pressure using different colors or bar formations on a chart.


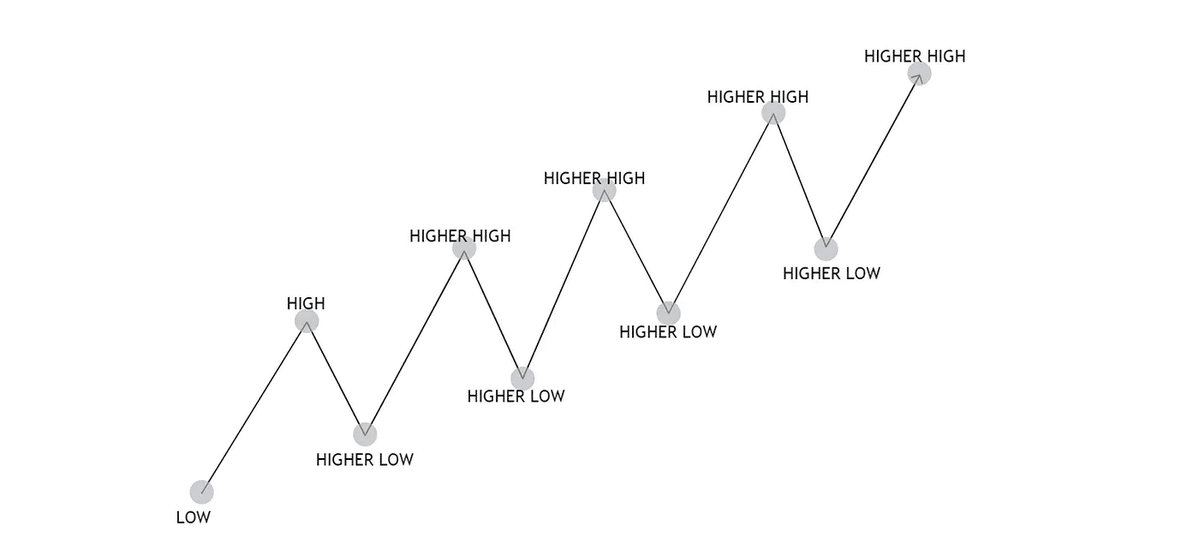
2. Trends
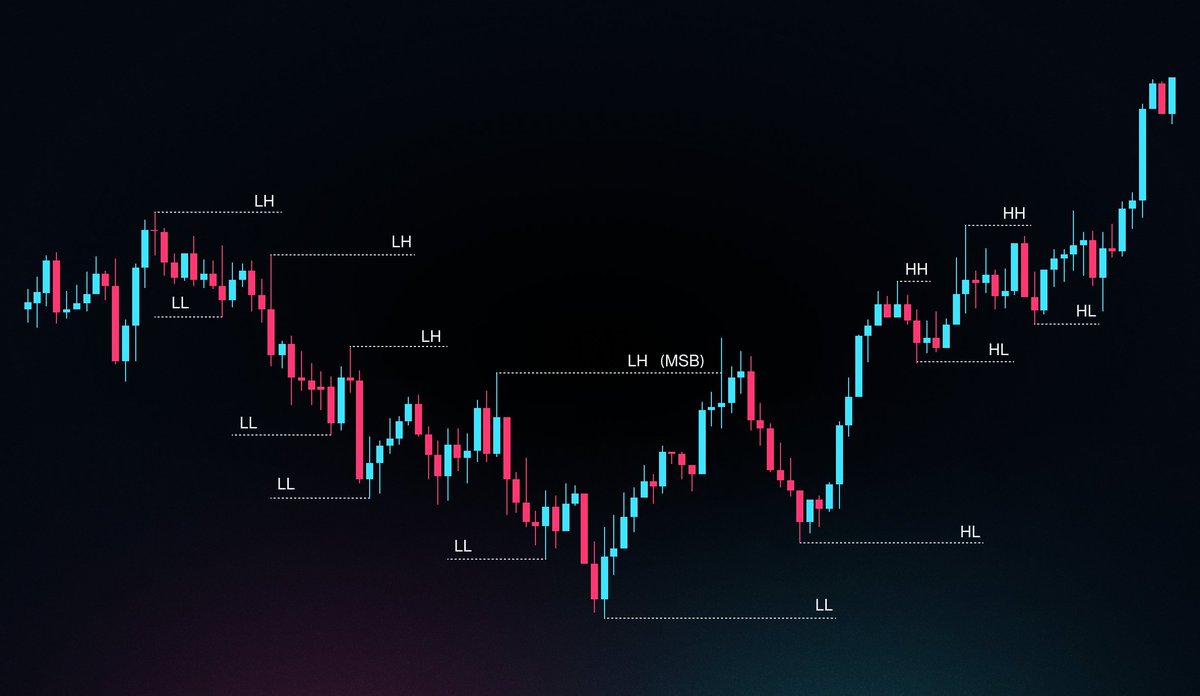
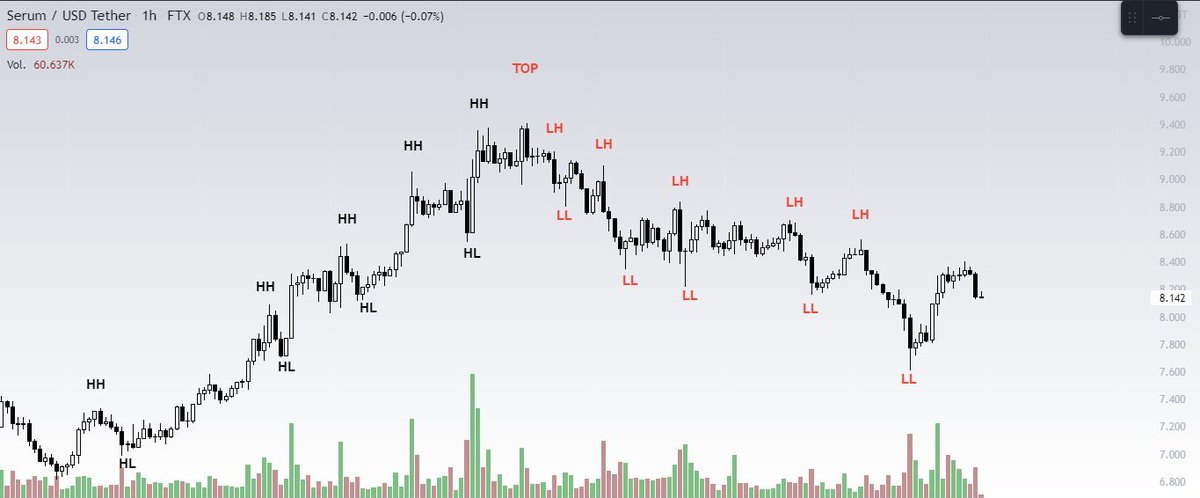
Trend is the direction that prices are moving in, based on where they have been in the past.
Trends are made up of peaks and troughs. It is the direction of those peaks and troughs that constitute a market's trend.
Trend is the direction that prices are moving in, based on where they have been in the past.
Trends are made up of peaks and troughs. It is the direction of those peaks and troughs that constitute a market's trend.


2.1 Trends
Trends in trading can change due to various factors, including shifts in market sentiment, economic indicators, and the overall supply and demand for an asset
Look for signals like trendlines and momentum indicators to gauge potential trend reversals.
Trends in trading can change due to various factors, including shifts in market sentiment, economic indicators, and the overall supply and demand for an asset
Look for signals like trendlines and momentum indicators to gauge potential trend reversals.

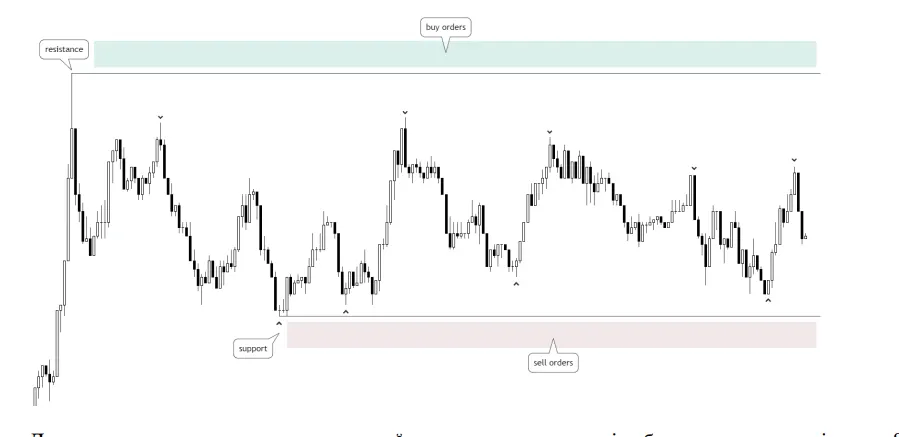
2.2 Trends
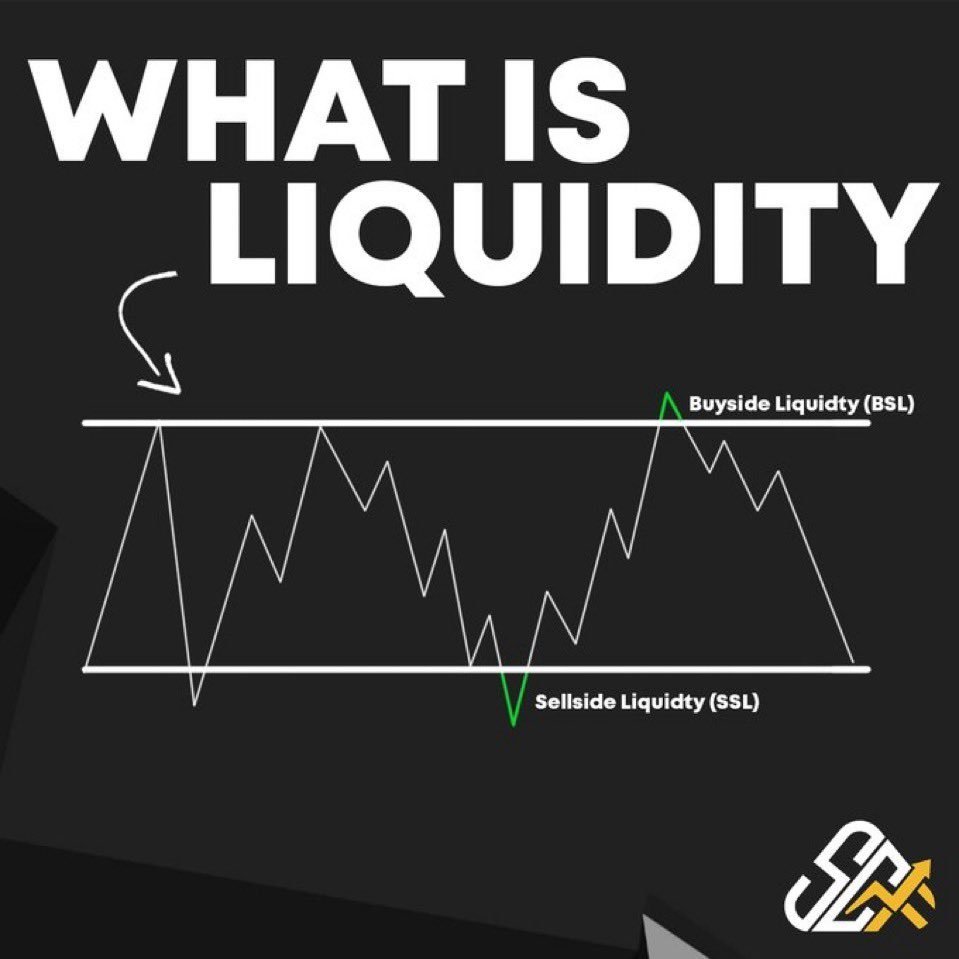
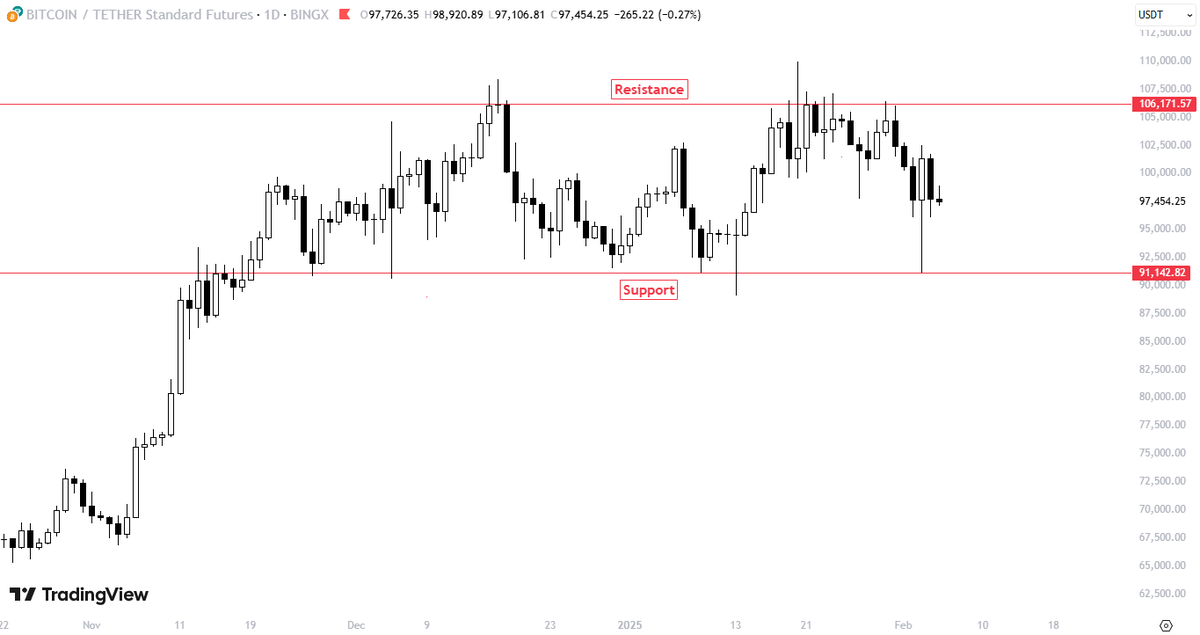
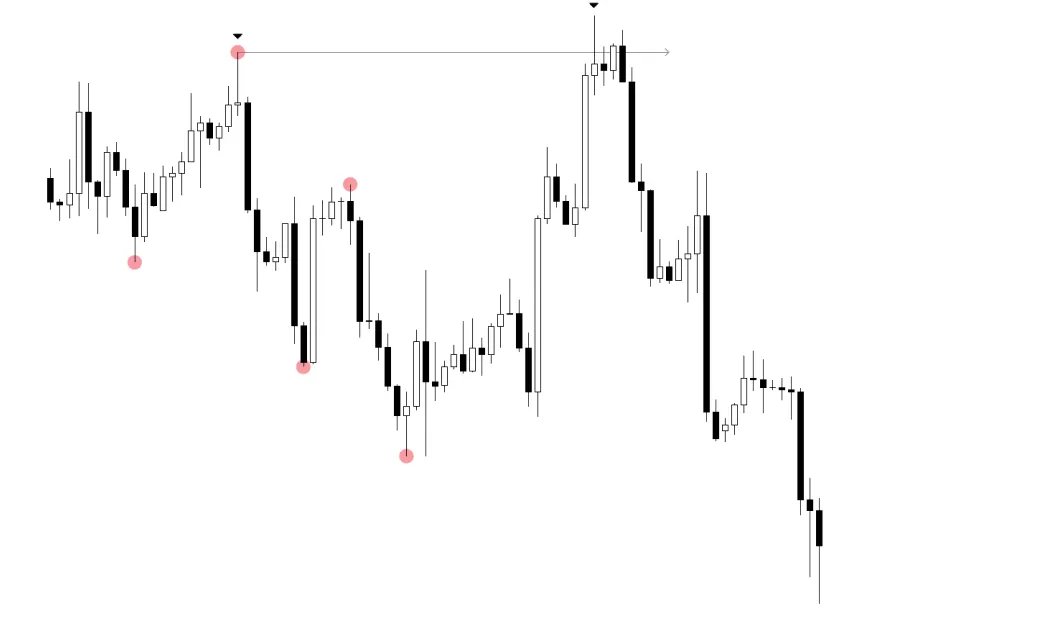
Range trading is a strategy where traders aim to profit from an asset's price moving sideways within a defined support and resistance range.
When the price does not have a clear trend, it remains in the range.
Range trading is a strategy where traders aim to profit from an asset's price moving sideways within a defined support and resistance range.
When the price does not have a clear trend, it remains in the range.

3. Divergence
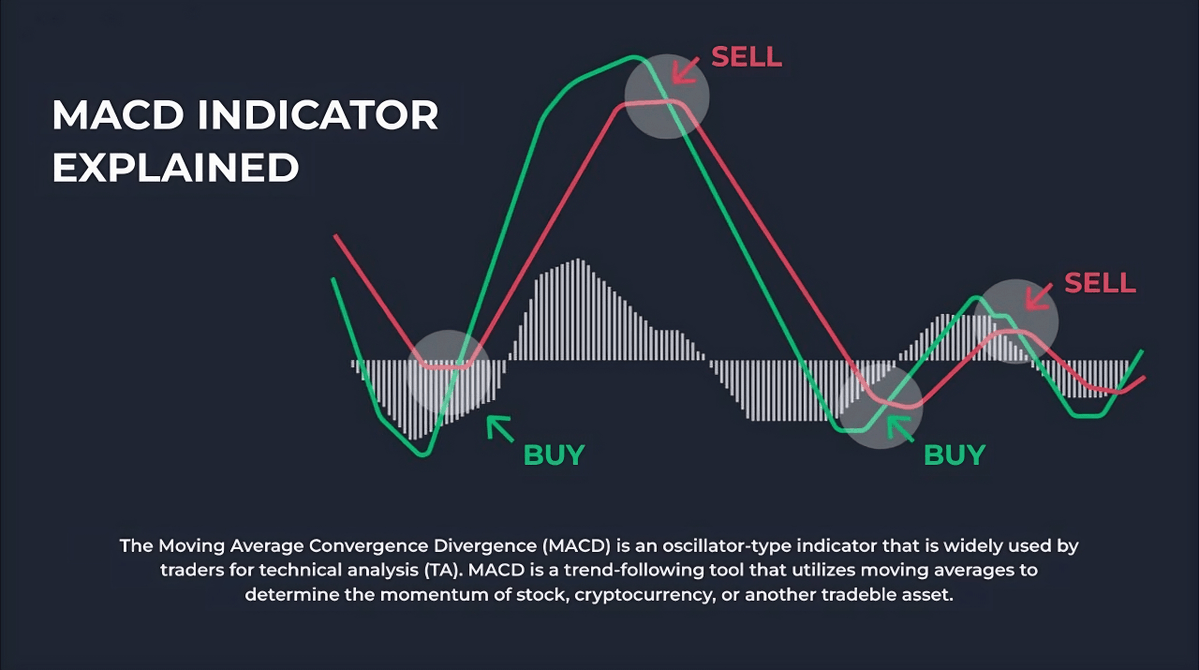
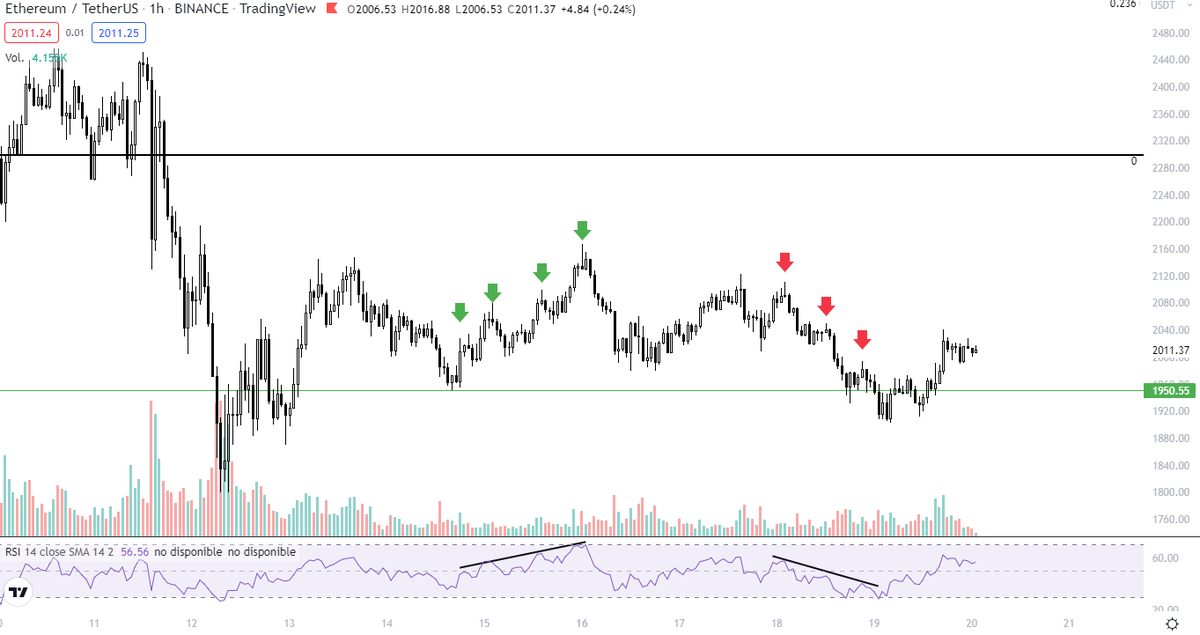
Is a technique for identifying potential market reversals by comparing price action with oscillators like RSI or MACD.
When the price reaches HH or LL that aren’t mirrored by the oscillator, it indicates a divergence.
Signaling a possible trend change.
Is a technique for identifying potential market reversals by comparing price action with oscillators like RSI or MACD.
When the price reaches HH or LL that aren’t mirrored by the oscillator, it indicates a divergence.
Signaling a possible trend change.

3.1 Divergence
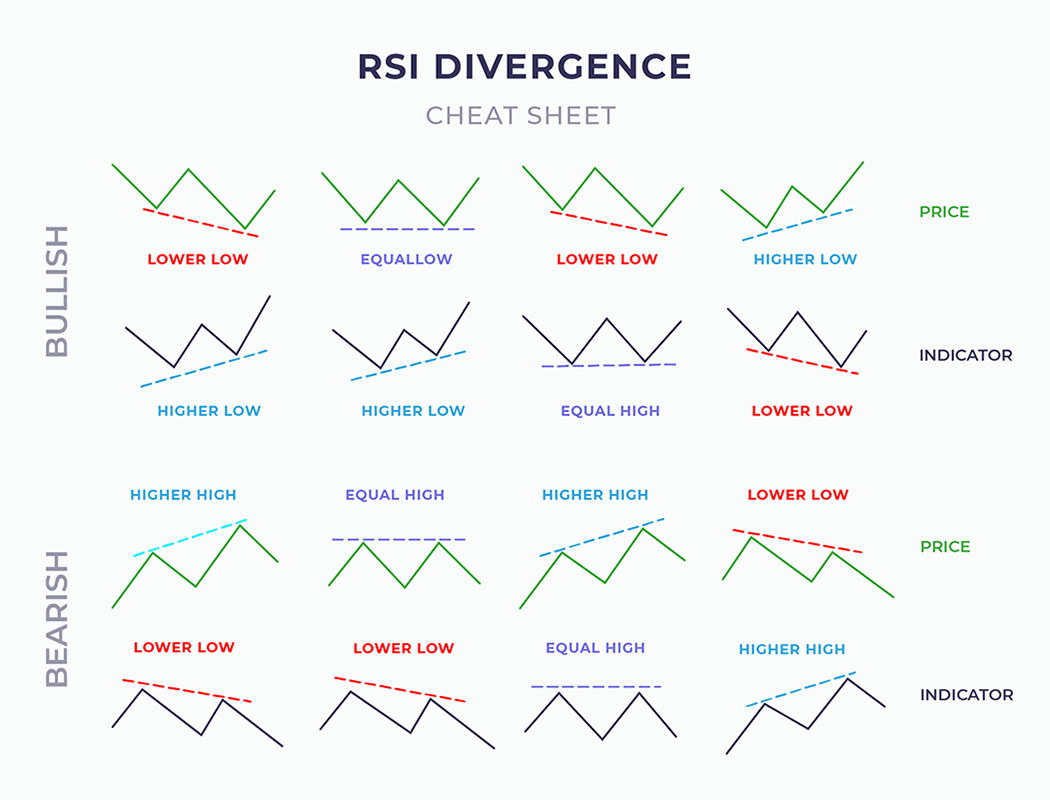
What is a bullish divergence?
The bullish divergence can be spotted when the price makes lower lows, but the oscillator makes higher lows.
This can be a possible signal of a downtrend reversal
What is a bullish divergence?
The bullish divergence can be spotted when the price makes lower lows, but the oscillator makes higher lows.
This can be a possible signal of a downtrend reversal

3.2 Divergence
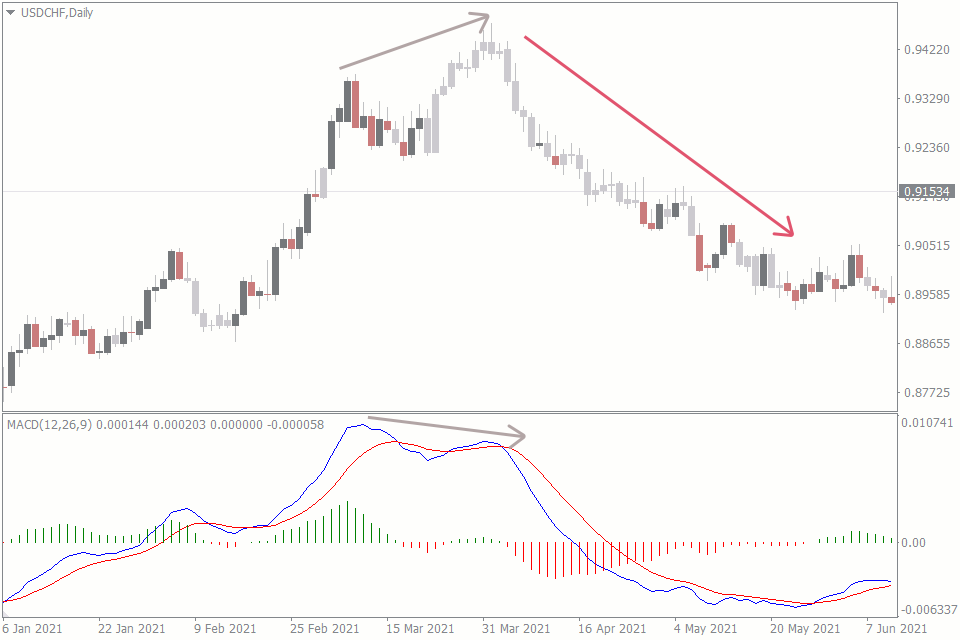
What is a bearish divergence?
When the price is making higher highs, but the oscillator makes lower highs, we can spot the regular bearish divergence.
This can be a signal of a reversal in an uptrend.
What is a bearish divergence?
When the price is making higher highs, but the oscillator makes lower highs, we can spot the regular bearish divergence.
This can be a signal of a reversal in an uptrend.

3.3 Divergence
What is a hidden divergence?
Hidden divergence can signal possible trend reversals and a trend continuation.
A hidden bullish divergence can be found in an uptrend.
What is a hidden divergence?
Hidden divergence can signal possible trend reversals and a trend continuation.
A hidden bullish divergence can be found in an uptrend.

3.4 Divergence
Regular divergences are useful for trend reversals, and hidden divergences can signal trend continuation.
It is always well advised to use other trading confluence tools rather than just trading these divergences blindly.
Regular divergences are useful for trend reversals, and hidden divergences can signal trend continuation.
It is always well advised to use other trading confluence tools rather than just trading these divergences blindly.

This thread has been a brief exposition about Volume, Trends and Divergences
I will publish Trading calls, Educational content and Giveaways here:
RT, LIKE, and COMMENT on the first tweet of this Thread if you appreciate this contentt.me/SoulzFamily
I will publish Trading calls, Educational content and Giveaways here:
RT, LIKE, and COMMENT on the first tweet of this Thread if you appreciate this contentt.me/SoulzFamily
• • •
Missing some Tweet in this thread? You can try to
force a refresh