New @The_Budget_Lab tariff analysis incorporating 1) the 50% copper tariff, and 2) the July 7 & 9 letters to 22 countries with new "reciprocal" tariff rates. Both go into effect August 1. In brief...
1/10
• Consumers face an overall average effective tariff rate of 18.0%, a 15.6pp increase from 2024 & the highest since 1934. After consumers & businesses shift spending in reaction to the tariffs, the average tariff rate will be 16.9%, a 14.5pp increase & the highest since 1935
2/10
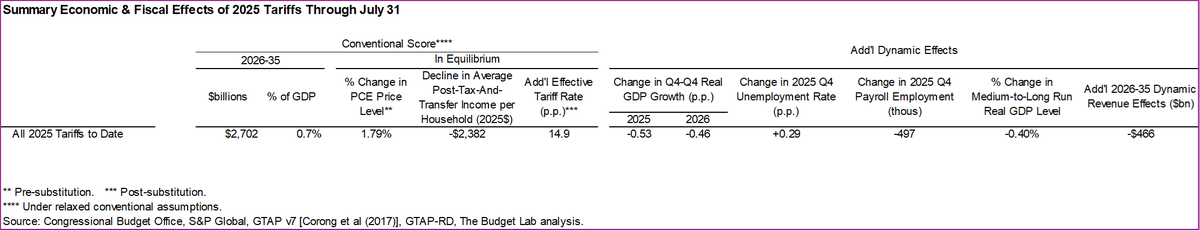
@The_Budget_Lab • The price level from all 2025 tariffs rises by 1.8% in the short-run, the equivalent of an average per household income loss of $2,400 in 2025$, assuming no Federal Reserve reaction. The post-substitution price increase settles at 1.5%, a $2,000 loss per household.
3/10
@The_Budget_Lab • Tariffs are a regressive tax, especially in the short-run. The short-run burden on 1st decile households (as a % of income) is more than 3x that of the top decile (-3.3% versus -1.0%).
• The average annual cost to the 1st & top decile are $1,300 & $4,800 respectively.
4/10
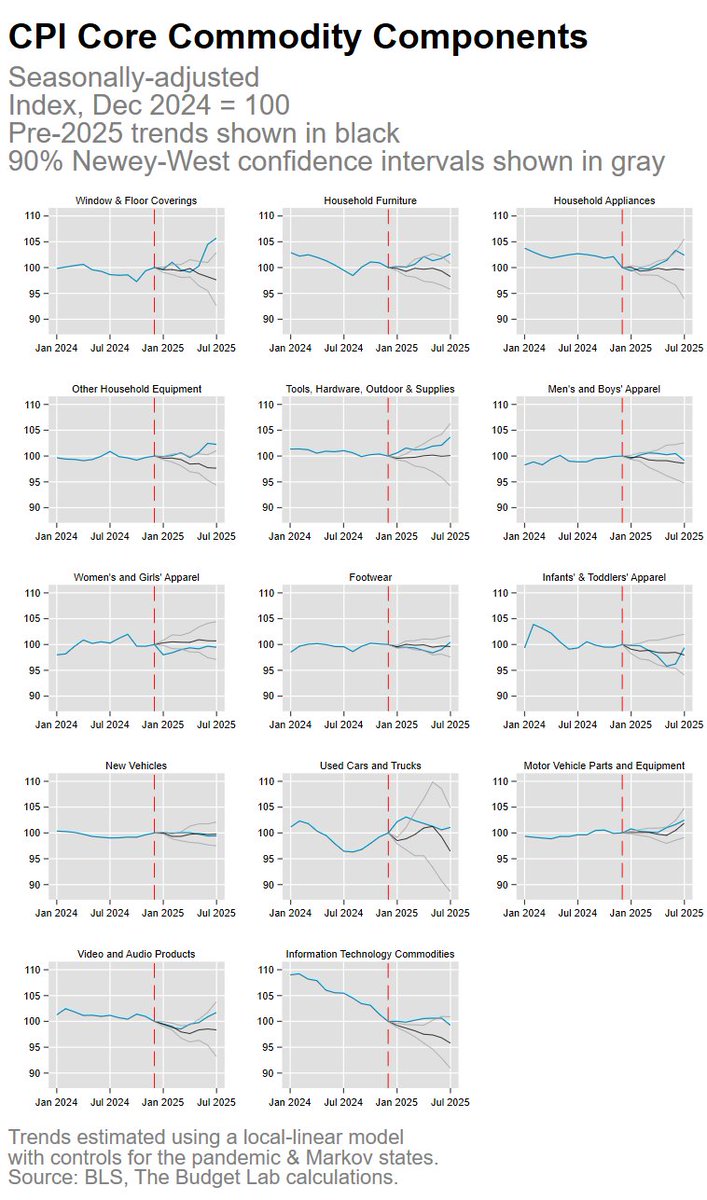
@The_Budget_Lab • The 2025 tariffs disproportionately affect clothing and textiles, with consumers facing 39% higher shoe prices and 37% higher apparel prices in the short-run. Shoes and apparel prices both stay 18% higher in the long-run.
5/10
@The_Budget_Lab • US real GDP growth over 2025 is -0.7pp lower from all 2025 tariffs. In the long-run, the US economy is persistently -0.4% smaller, the equivalent of $110B annually in 2024$.
• The unemployment rate rises +0.4pp by the end of 2025, & payroll employment is -553,000 lower.
6/10
@The_Budget_Lab • In the long-run, tariffs present a trade-off. US manufacturing output expands by 2.0%, but these gains are more than crowded out by other sectors: construction output contracts by 3.6% and agriculture declines by 0.8%.
7/10
@The_Budget_Lab • Canada has borne the brunt of the damage from US tariffs so far, with its long-run economy -1.9% smaller in real terms. China’s economy is -0.2% smaller, about 1/2 as large as the hit to the US. The UK’s is 0.2% bigger thanks in part to the benefits of US-UK trade deal.
8/10
@The_Budget_Lab • All tariffs to date in 2025 raise $2.6 trillion over 2026-35, with $418 billion in negative dynamic revenue effects, bringing dynamic revenues to $2.2 trillion.
• Tariffs under July 9 policy reach about 2/3 of April 2 policy (18% vs. 28% effective tariff rate)
9/10
New @The_Budget_Lab tariff analysis incorporating 1) the US-Vietnam framework announced July 2, and 2) the July 7 letters to 14 countries with new "reciprocal" tariff rates, which go into effect August 1.
In brief...
1/10
• Consumers face an overall average effective tariff rate of 17.6%, a 15.2pp increase from 2024 & the highest since 1934. After consumers & businesses shift spending in reaction to the tariffs, the average tariff rate will be 16.5%, a 14.1pp increase & the highest since 1936
2/10
@The_Budget_Lab • The price level from all 2025 tariffs rises by 1.7% in the short-run, the equivalent of an average per household income loss of $2,300 in 2025$, assuming no Federal Reserve reaction. The post-substitution price increase settles at 1.5%, a $1,900 loss per household.
3/10
Yesterday's US Court of International Trade decision invalidates the recent tariffs imposed under IEEPA, including the "reciprocal" tariffs & most tariffs on China, Canada, & Mexico, leaving only the Section 232 commodity tariffs in place. What are the economic implications?
1/8
• The average effective US tariff rate falls to 6.9% pre-substitution without the IEEPA tariffs, the highest since 1969, down from 17.8% prior. Even after consumption shifts, the average tariff rate will be 7.0%, also the highest since 1969. 2/8
• The price level from all non-IEEPA 2025 tariffs rises by 0.6% in the short-run, the equivalent of an average per household consumer loss of $950 in 2024$.
• The 2025 tariffs raise $686 billion over 2026-35, with $101 billion in negative dynamic revenue effects. 3/8
Assuming that the US raised the "reciprocal" tariff rate on the EU from 10% to 50%, what would be the economic effect?
The 1st table takes current tariffs & illustratively raises the EU reciprocal rate to 50% total. For comparison, the 2nd shows w/o the extra EU tariff. 1/7
* The pre-substitution average effective US tariff rate rises from 15.4% now to 19.5%
* Post-substitution, the average rate rises from 14.0% to 18.3%
* Short-run PCE price-level pressures rise by another 0.5pp, from 1.7% to 2.2%.
2/7
* Short-run purchasing power loss rises to $3,600 per household in 2024$ from $2,800 now.
* Conventional 10Y revenue rises by $130 billion, to $2.8T, but the 10Y dynamic revenue hit increases by $150bn, to -$549bn.
3/7
New tariff update today from @The_Budget_Lab incorporating
1. Today's announcement of lower US-China tariffs (10% instead of 125% reciprocal tariffs); 2. The May 8 US-UK trade deal; and, 3. The April 29 auto tariff rebate announcement.
Some high level takeaways:
1/13
@The_Budget_Lab • In broad strokes, the lower China tariffs announced today have 2 main effects, assuming they stay in place:
1. They reduce the economic damage of 2025 tariffs by 40% (judged by price & GDP);
2. They raise $300bn *more* over 10Y, showing how suboptimal 145% was.
2/13
@The_Budget_Lab • The current US average effective tariff rate is now 17.8% pre-substitution, highest since 1934. Post-substitution, it's 16.4%, the highest since 1937. Virtually all of the fall since our April 15 report is due to the lower China tariffs; the US-UK deal has little effect.
3/13
@jasonfurman & @ZLiscow have responded to the piece on real infrastructure investment @vannostrand & I wrote in @Briefing_Book. We always learn a ton from J&Z, & this is no exception. They engage w/ thoughtful, data-driven pts. You should read their threads & then come back here (links at end).
1/23
Our bottom line: the official BEA deflator & the NHCCI that J&Z defend tell different stories. But most measures say infra investment has risen. Each real validator we could find (# of h’way contracts, h’way employment, change in lane-miles of h’ways from 2 sources) all grew under Biden.
2/23
@jasonfurman @ZLiscow @vannostrand @Briefing_Book Let me start by stating 4 points we all agree on: 1. Nominal highway spending rose under Biden. 2. Highway costs also rose under Biden. 3. Inflation erodes the real value of infrastructure spending. 4. There is uncertainty about how #1 & #2 net out.
3/23
Hot off the presses, @The_Budget_Lab just published a preliminary estimate of the economic & fiscal effects of the Trump Admin's 25/25/10 Mexico/Canada/China tariff proposal, with a special lower 10% rate on Canadian crude oil imports. Some high-level conclusions follow... 1/4
1. The proposal raises PCE prices by 0.76% pre-substitution (full retaliation & no Fed offset). That's the equivalent of a $1,250 per household loss in purchasing power on average in 2024$.
2. The proposal raises $1.4-1.5T over 2026-35 conventionally scored, & ~$150B less dynamically scored.
2/4
3. US real GDP is 0.2% smaller in the medium-run.
4. The effective tariff rate rises ~6 perc pts to the highest since 1946.
5. We map average price effect across different commodities. For many goods, domestic prices rise too. Natural gas prices are 8.4% higher, autos 4%, produce ~2%.
3/4