
INVESTOR TIP: Free Cashflow Yield vs. ROE
ROE is a favorite of Warren Buffett.
ROE (and its realted cousing ROIC) is a great metric to look for in an investment.
These metrics are the cornerstones of all true quality compounders.
A quality compounder can 'invest in itself' -- utilizes its own free cashflow into invest in NPV+ opportunities and generate future returns.
But, it's not the only metric.
Free Cashflow Yield is another one.
High Free Cashflow yield means:
(1) You can buy back your stock
(2) PE firms can buy your stock with your own FCF
(3) Outside investors see FCF Yield and know that both (1) and (2) are possible so they step in and buy.
Also, there are some gaps with ROE.
For example, a business that had a capex splurge may have negative ROE due to the marking down of asset acquired at peak valuations.
But, that's a problem for legacy shareholders. After equity prices have dropped, the negative ROE is old news.
The assets are still there generating cashflow.
The negative ROE is better off ignored now (provided the return on those assets is higher than the cost of financing them).
The points is -- high FCF Yield is a sign that there is value even if ROE is negative.
FCF Yield may uncover 'mean reversion' opportunities, as often high ROE businesses are pricey
(Mag 4 stocks are high ROE for example.)
ROE is not the end all be all.
You can profit from the the mistakes of others by focusing on high free cashflow yield after asset prices have corrected.
Sometimes you can find high FCF Yield AND high ROE.
That's a beautiful thing provided those metrics aren't artifically high due to high levels of debt.
An example of that in the energy space would be Riley Exploration $REPX.
It has a 20% ROE and a 20%+ Free Cashflow yield.
tl;dr there is no single decisive metric or formula.
2/ Take a look at this chart of $REPX for example.
Looks like it hasn't gone anywhere since 2021 right?
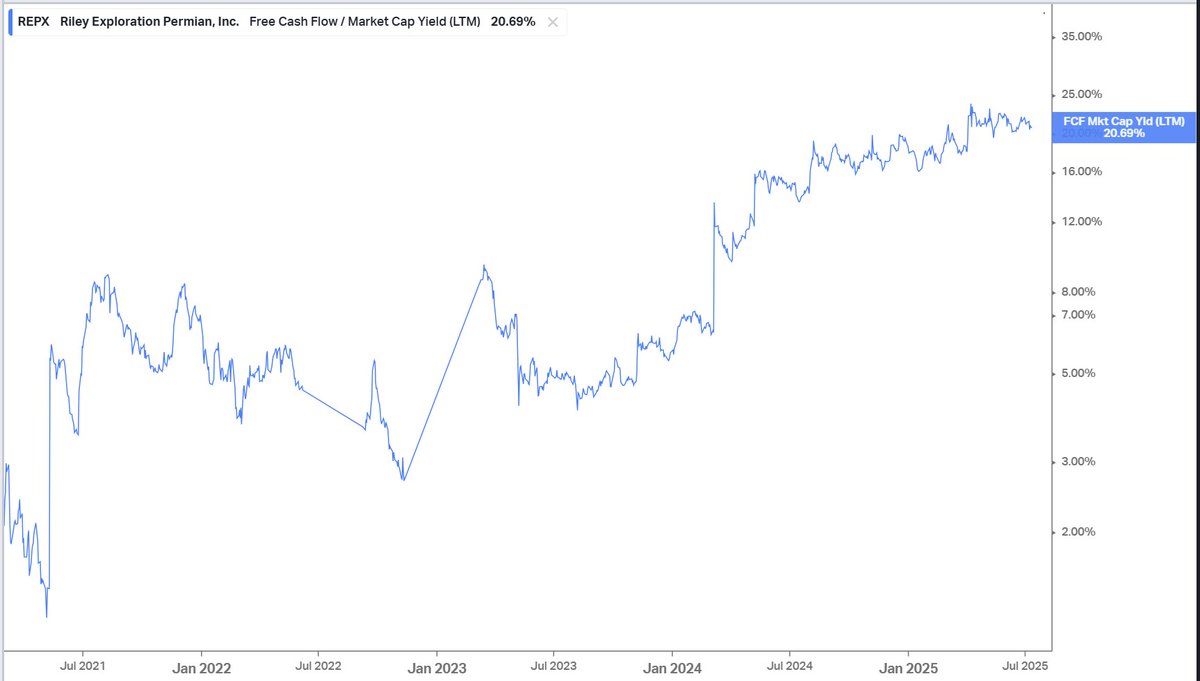
But... look under the hood at FCF Yield
Looks like it hasn't gone anywhere since 2021 right?
But... look under the hood at FCF Yield
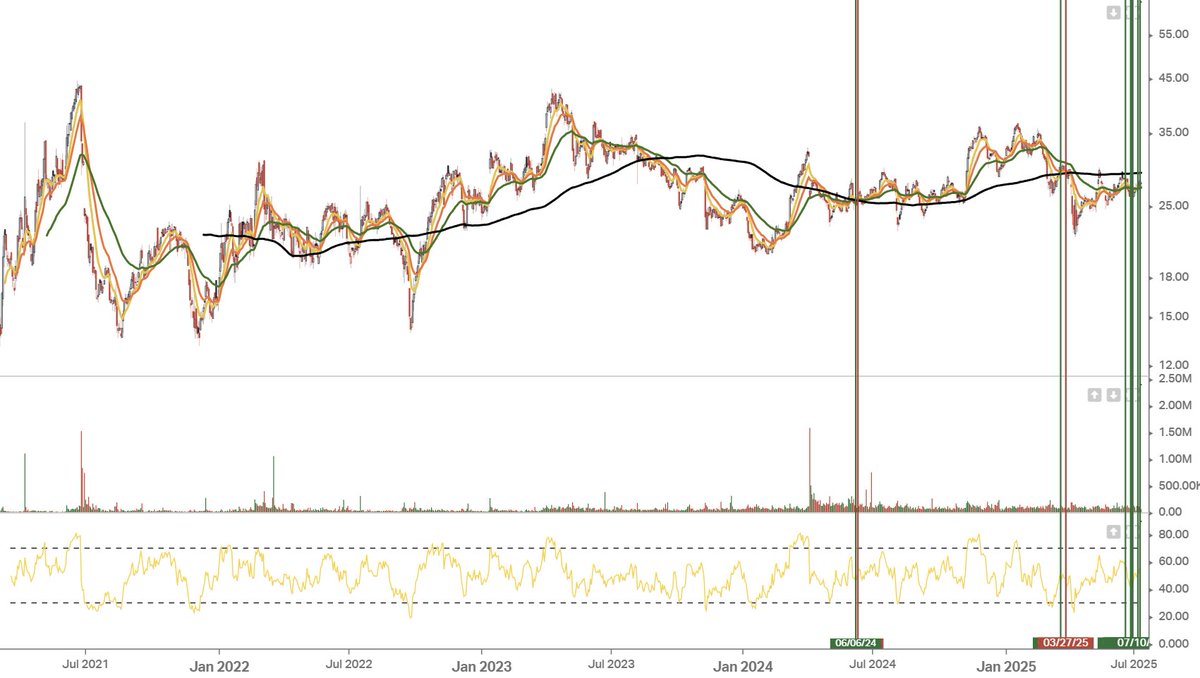
3/ Now you haver a very different story. In 2021, it was very expensive, and now it's dirt cheap.
I look at this and say 'this has a lot of potential energy'
Then the technical overlay is the observation that 'the lows are behind us'
FCF Yield can uncover a dimension that is not obvs at the surface level.
I look at this and say 'this has a lot of potential energy'
Then the technical overlay is the observation that 'the lows are behind us'
FCF Yield can uncover a dimension that is not obvs at the surface level.
4/ ROE interacts the Income Statement with the Balance Sheet. But, it has no concept of 'market value'.
FCF Yield looks at the cashflow statement and market prices.
Combined they are powerful.
FCF Yield looks at the cashflow statement and market prices.
Combined they are powerful.
5/ The blindspot risk is that FCF Yield and ROE can be goosed up higher with excess debt levels.
So, you need to check Interest Coverage ratios, the short-term payables on the debt as well.
This is also where ROIC can be better than ROE since it is a debt free metric.
So, you need to check Interest Coverage ratios, the short-term payables on the debt as well.
This is also where ROIC can be better than ROE since it is a debt free metric.
• • •
Missing some Tweet in this thread? You can try to
force a refresh


