
Orlando, FL's housing market is correcting fast.
Supply is at a 10-year record, up 142% over the last two years.
Sellers are struggling to sell their homes, and prices are dropping.
Orlando's market is heavily exposed to macroeconomic forces like travel and tourism. And there's currently a -6% YoY decline in traffic at Orlando International Airport.
That decline is now showing up in local economic and housing market weakness.
Home values are already down -2.6% in the last 12 months. And they are still about 15-20% overvalued after that drop. So there's likely more downside coming.
Access the housing market data for Orlando at reventure.app.

1) Overall, there were 14,391 active listings on the Orlando metro housing market in June 2025 according to data from Realtor.com.
This is the highest active listing count since at least 2017, and likely the highest going back to the end of the last crash in 2012.
All 4 of the major counties in the Orlando metro (Orange, Lake, Seminole, and Osceola) are experiencing this inventory spike.
This is the highest active listing count since at least 2017, and likely the highest going back to the end of the last crash in 2012.
All 4 of the major counties in the Orlando metro (Orange, Lake, Seminole, and Osceola) are experiencing this inventory spike.
2) As a result of so much supply hitting the market, values are now going down.
Zillow's value index shows the entire Orlando metro at -2.6% over the last 12 months.
With Osceola County being the worst impacted at -3.5%.
However, those YoY value growth figures largely reflect the market conditions 6-12 months ago. And do not accurately reflect just how much this market has deteriorated in the recent quarters.
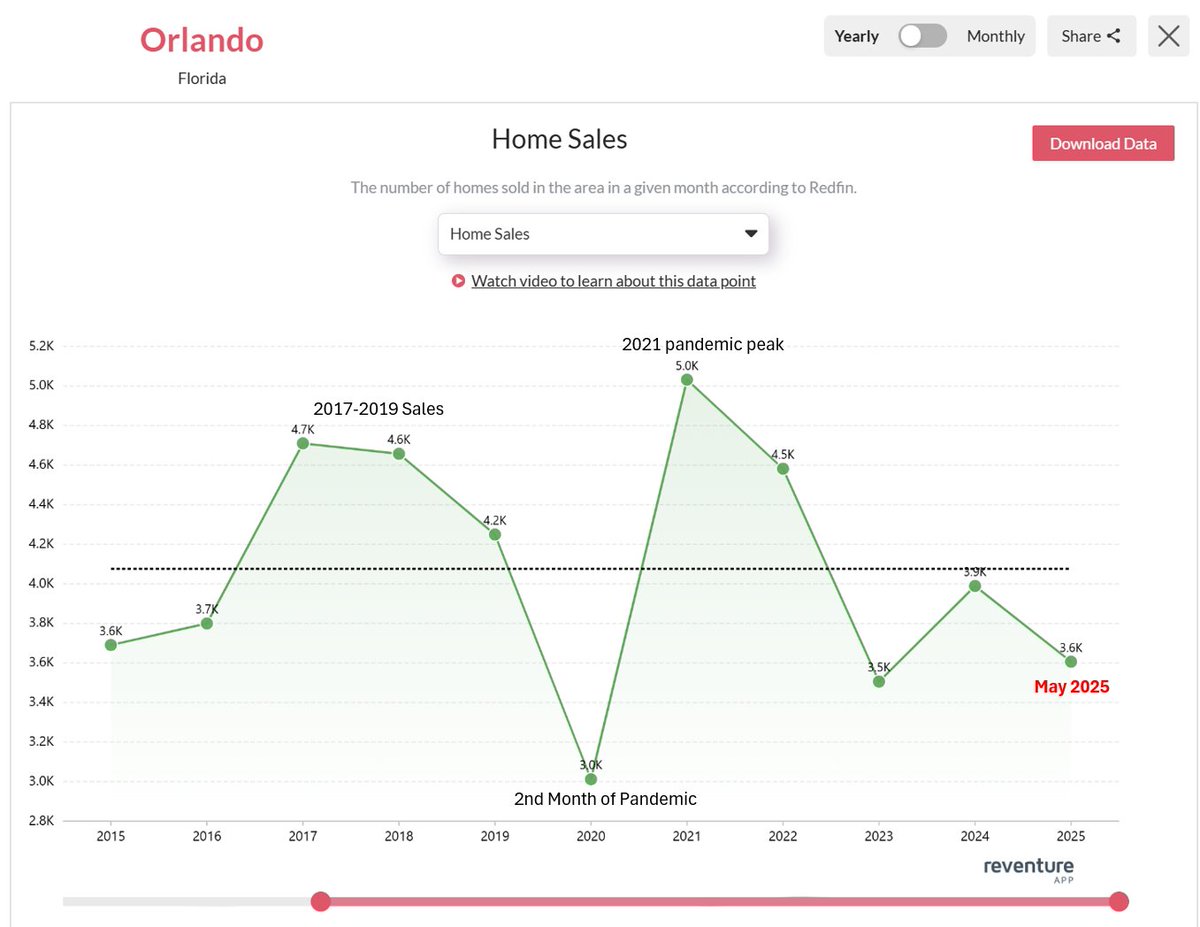
3) While supply in Orlando is rising to record levels, sales are lagging.
Home Sale activity is down -9.6% over the last 12 months, and is now resting at one of the lowest levels going back 10 years.
Data sourced from Redfin.
Home Sale activity is down -9.6% over the last 12 months, and is now resting at one of the lowest levels going back 10 years.
Data sourced from Redfin.
4) The reason Orlando's housing market has entered a downturn is due to:
-Decreased inbound migration
-Affordability Deterioration
-Local economic weakness
-Decreased inbound migration
-Affordability Deterioration
-Local economic weakness
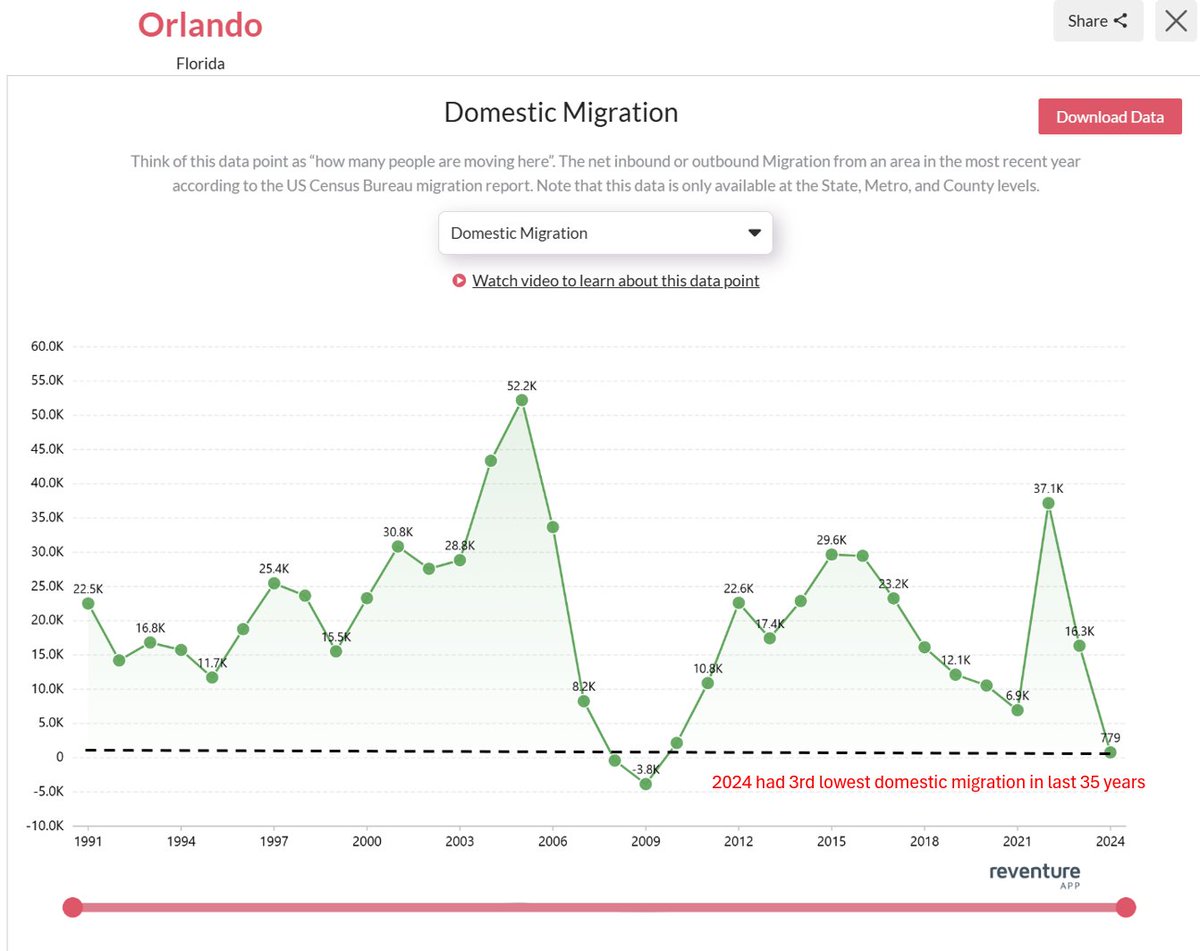
5) In terms of inbound migration, the boom from the pandemic is over.
After domestic migration peaked at 37,100 in 2022, it has since fallen off the table.
With 2024 registering the 3rd worst year for domestic migration in Orlando's history, going back 35 years.
This data is sourced from the US Census Bureau.
After domestic migration peaked at 37,100 in 2022, it has since fallen off the table.
With 2024 registering the 3rd worst year for domestic migration in Orlando's history, going back 35 years.
This data is sourced from the US Census Bureau.
6) With lower migration, more of the homebuyer demand responsibility now falls on the local population in Orlando.
However, they are priced out. The mortgage payment to income ratio in the metro is currently registering 38.5%.
That's near an all-time record, and reflects the reality that many Orlando homebuyers simply cannot qualify for mortgages in this market.
Note that the long-term average Mtg/Income ratio is 27%. That's probably what the market needs to get back to before it stabilizes.

7) But this last point is potentially the most interesting, and it's the fact that Orlando's economy might be beginning to see a contraction.
With data from the Bureau of Transportation Statistics showing a -6% YoY drop in airport traffic at Orlando International.
This data is confirmed by the Orlando Greater Aviation Authority, which shows a -5.8% YoY drop in domestic passengers.
With data from the Bureau of Transportation Statistics showing a -6% YoY drop in airport traffic at Orlando International.
This data is confirmed by the Orlando Greater Aviation Authority, which shows a -5.8% YoY drop in domestic passengers.

8) Lower traffic through Orlando's airport is a concerning sign for the local economy, as it means fewer tourists are visiting the metro.
This decreased visitor volume is likely negatively impacting local service industry jobs, and could even be negatively impacting Disney, however, they are still reporting fairly stable park attendance figures.
This decreased visitor volume is likely negatively impacting local service industry jobs, and could even be negatively impacting Disney, however, they are still reporting fairly stable park attendance figures.
• • •
Missing some Tweet in this thread? You can try to
force a refresh


