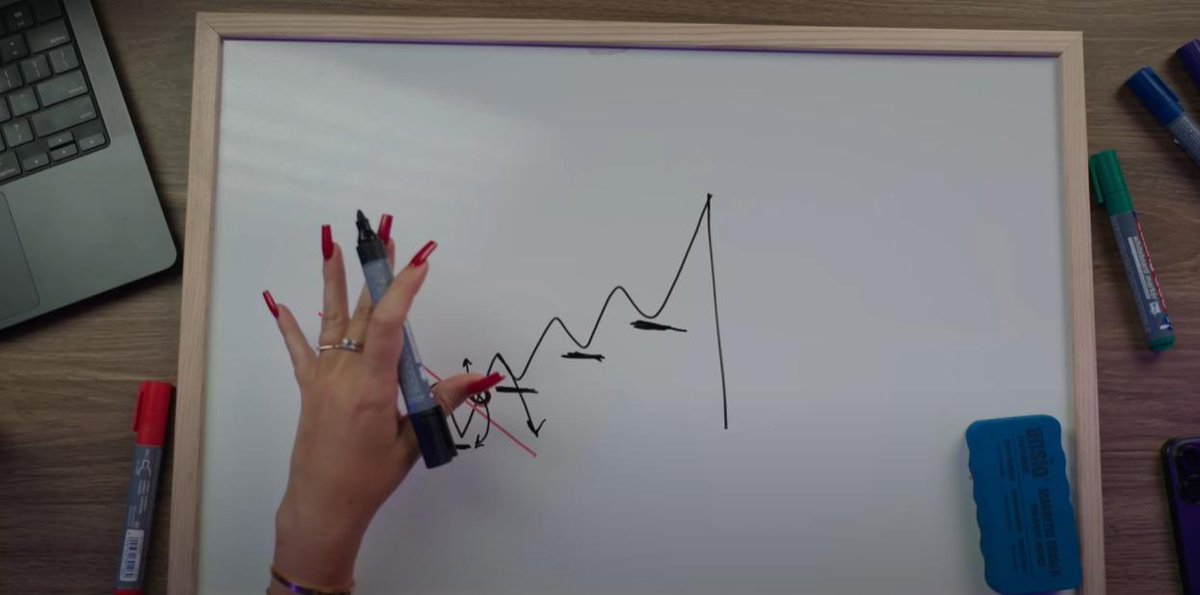
Trading is so simple.
I literally built a profitable system using two trendlines.
And it’s made me multiple 6-figures in profits.
Here’s my entire strategy & how to trade it (step-by-step):
I literally built a profitable system using two trendlines.
And it’s made me multiple 6-figures in profits.
Here’s my entire strategy & how to trade it (step-by-step):

I only use manually drawn trendlines, that’s it.
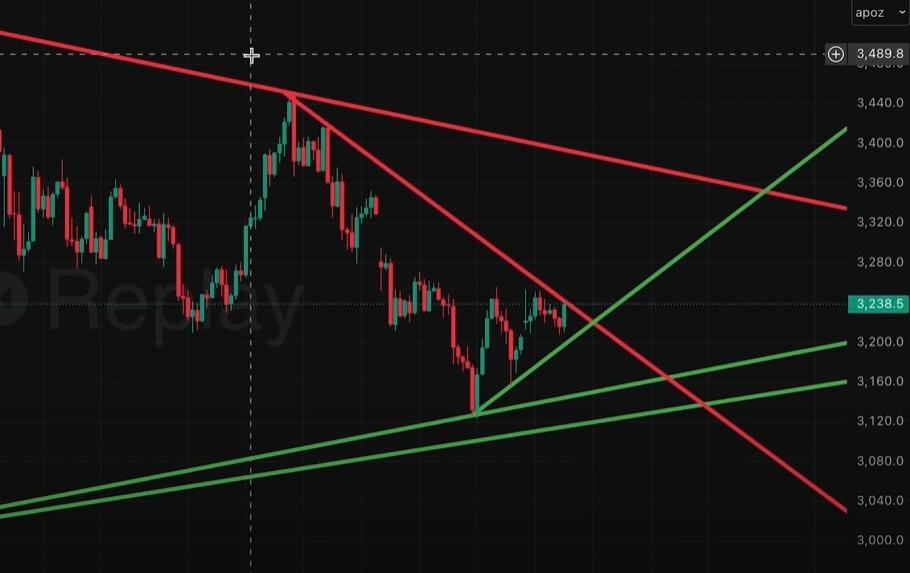
The system is built on 2 lines:
1. The Action Line (entry trigger)
2. The Safety Line (risk control)
Price either bounces or breaks… and that tells me what to do.
The system is built on 2 lines:
1. The Action Line (entry trigger)
2. The Safety Line (risk control)
Price either bounces or breaks… and that tells me what to do.
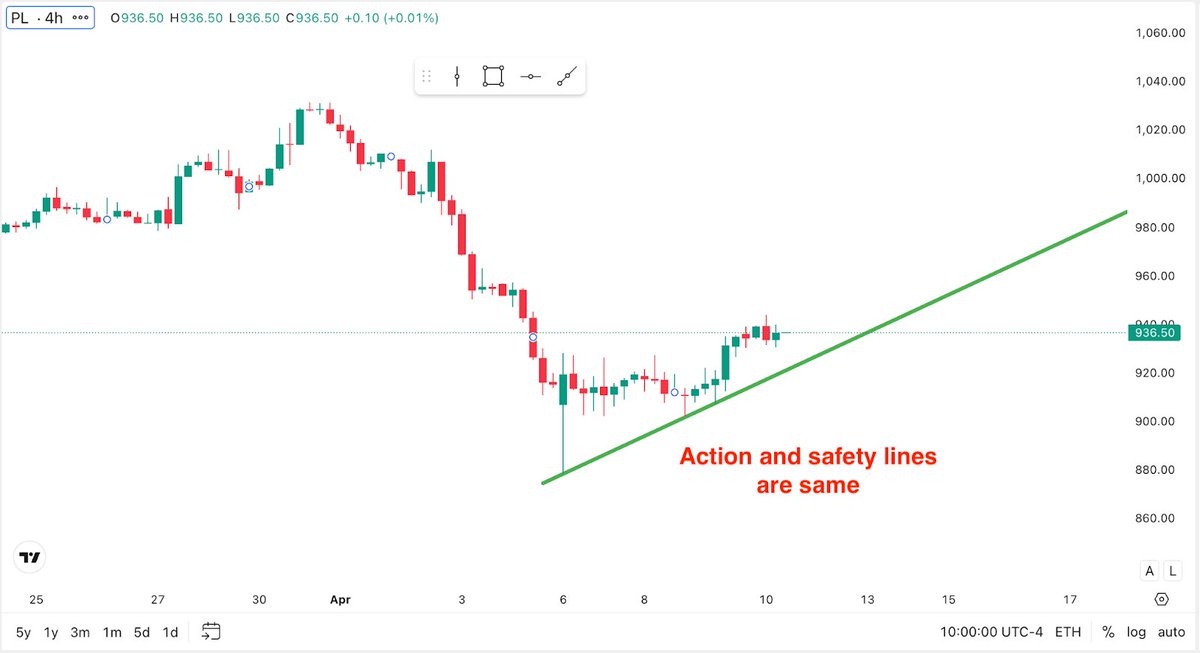
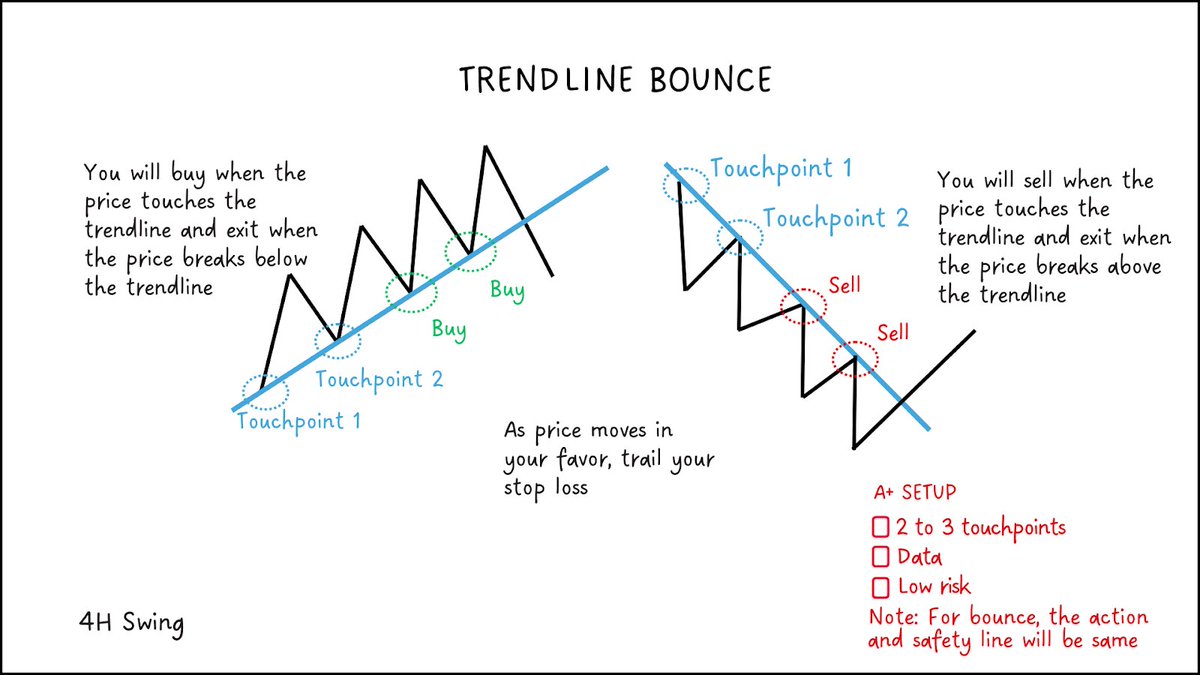
Setup #1: Trendline Bounce
You’re trading the continuation.
Price touches and respects a clean trendline, that’s your entry.
Same line acts as your stop. If it breaks, you exit.
It’s that simple.
You’re trading the continuation.
Price touches and respects a clean trendline, that’s your entry.
Same line acts as your stop. If it breaks, you exit.
It’s that simple.
Bounce Entry Rules:
Trendline must have 2–3 clean touches
At least 1 week of data from first touch to entry
Enter on the third touch
Stop goes just beyond the line
Trendline must have 2–3 clean touches
At least 1 week of data from first touch to entry
Enter on the third touch
Stop goes just beyond the line
Why Bounce works:
- Entry + exit on the same line
- Tight risk
- Clean invalidation
If price closes through your line, you're out.
No stress or second guessing.
- Entry + exit on the same line
- Tight risk
- Clean invalidation
If price closes through your line, you're out.
No stress or second guessing.
Setup #2: Trendline Break
This time you're trading the reversal.
Price breaks through a clean trendline, and confirms a new trend.
You enter after the break, not before.
This time you're trading the reversal.
Price breaks through a clean trendline, and confirms a new trend.
You enter after the break, not before.


There are 2 types of Break setups:
2-touch break: More frequent, less reliable
3-touch break: Stronger trend, better confirmation
In both, you need a clear opposing trendline as your Safety Line.
2-touch break: More frequent, less reliable
3-touch break: Stronger trend, better confirmation
In both, you need a clear opposing trendline as your Safety Line.


Your Safety Line = your stop.
If price closes through it, the trade is invalid and you’re out.
This keeps your risk tight, even on volatile setups.
If price closes through it, the trade is invalid and you’re out.
This keeps your risk tight, even on volatile setups.

Quick Recap:
Bounce = continuation
Break = reversal
Every setup needs:
• Clean trendlines
• At least 2–3 touches
• A safety line to define risk
No indicators or confusion.
Just structure.
Bounce = continuation
Break = reversal
Every setup needs:
• Clean trendlines
• At least 2–3 touches
• A safety line to define risk
No indicators or confusion.
Just structure.
Pros of this system:
• No indicators - pure price action
• Simple entry/exit rules
• Works on any instrument or timeframe
• Repeatable + backtestable
And the best part…
You only need 1 hour a day.
• No indicators - pure price action
• Simple entry/exit rules
• Works on any instrument or timeframe
• Repeatable + backtestable
And the best part…
You only need 1 hour a day.
Thanks for reading!
If you want a clean, rule-based way to trade trendlines:
• Draw your Action Line
• Wait for a bounce or break
• Use your Safety Line for risk
Want more breakdowns?
Follow @toritrades for more and check out the playbook here:
tradezella.com/playbooks/tren…
If you want a clean, rule-based way to trade trendlines:
• Draw your Action Line
• Wait for a bounce or break
• Use your Safety Line for risk
Want more breakdowns?
Follow @toritrades for more and check out the playbook here:
tradezella.com/playbooks/tren…
• • •
Missing some Tweet in this thread? You can try to
force a refresh