Mike Hoerger, PhD MSCR MBA Profile picture
Jul 15, 2025 11 tweets 6 min read Read on X
1) PMC COVlD Dashboard, July 14, 2025 (U.S.) 🧵

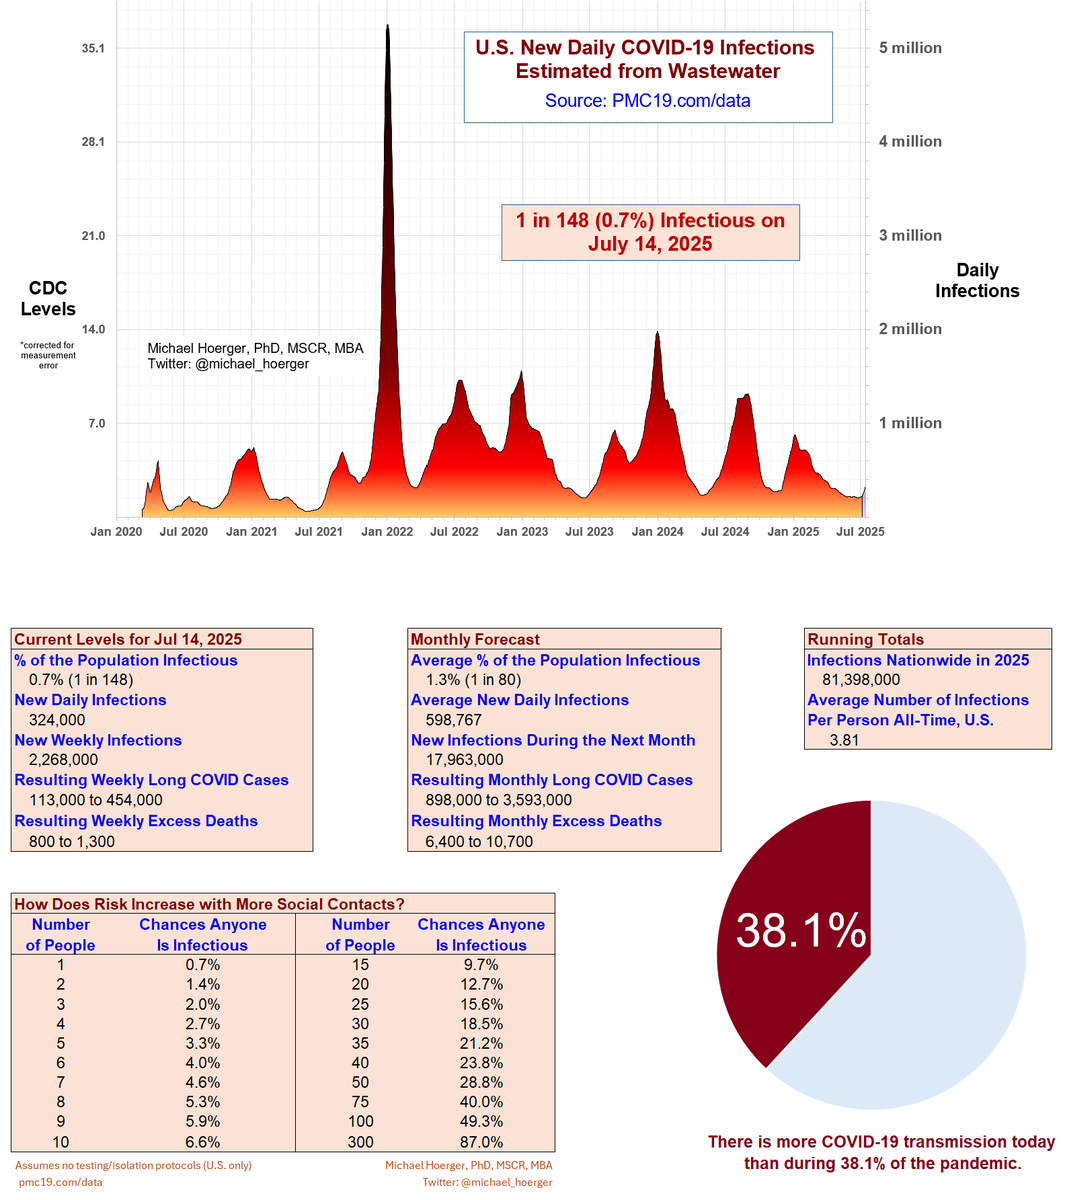
We estimate 1 in 148 Americans are actively infectious. This equates to 2.3 million infections/week, expected to result in >100,000 new #LongCOVID conditions & >800 deaths.

A room of 100 people is a coin toss of an exposure. Figure shows each wave of the pandemic.   Tables: Current Levels for Jul 14, 2025	 % of the Population Infectious	 0.7% (1 in 148)	 New Daily Infections	 324000	 New Weekly Infections	 2268000	 Resulting Weekly Long COVID Cases	 113,000 to 454,000	 Resulting Weekly Excess Deaths	 800 to 1,300	 	 Monthly Forecast	 Average % of the Population Infectious	 1.3% (1 in 80)	 Average New Daily Infections	 598766.6667	 New Infections During the Next Month	 17963000	 Resulting Monthly Long COVID Cases	 898,000 to 3,593,000	 Resulting Monthly Excess Deaths	 6,400 to 10,700	 	 Running Totals	 Infection...
2) PMC COVlD Dashboard, July 14, 2025 (U.S.) 🧵

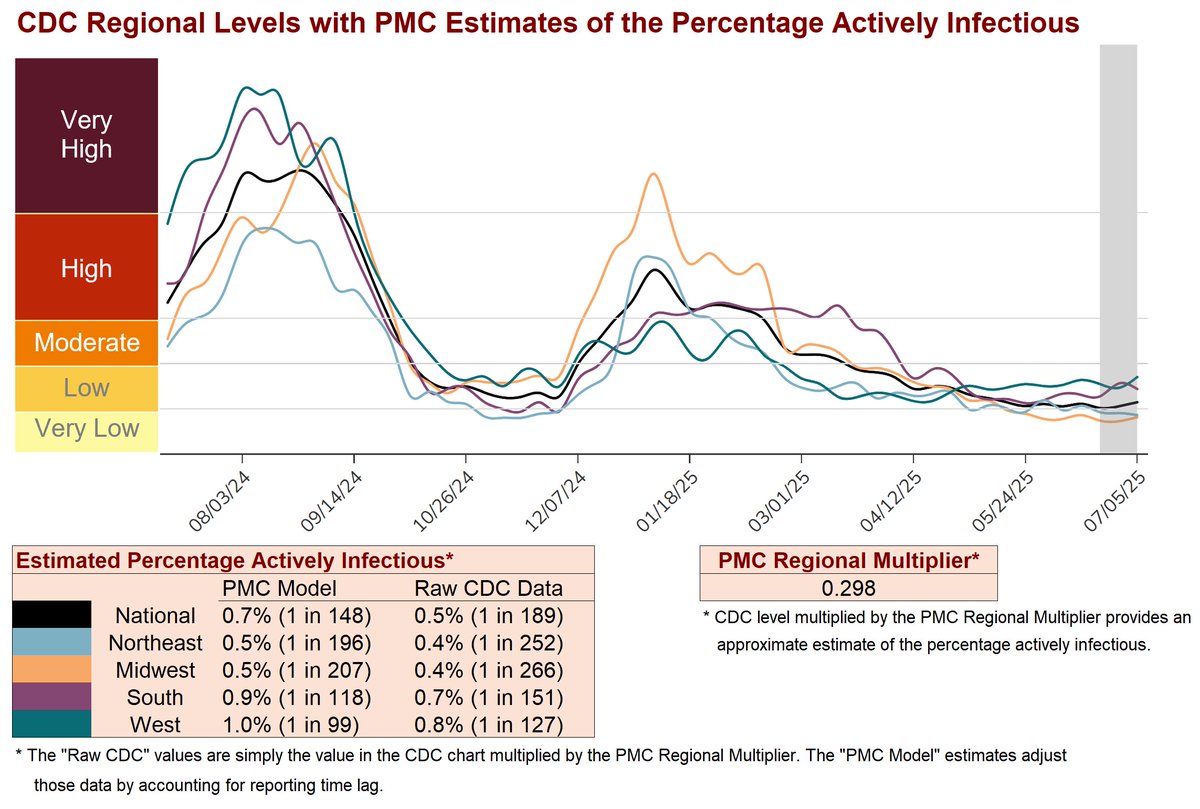
Transmission (red) is closely tracking the path of 2 years ago (yellow). However, the incoming data are spotty. >20% of CDC states have limited/no data, & Biobot hasn't reported in weeks.

Could be MUCH worse or slightly better. Graph of year over year transmission. The current year (red) is tracking the path of two years ago (yellow) extremely closely. Two years ago, the peak was around September 1, at about 1 million daily estimated infections, and significantly higher than the Delta wave (blue).
3) PMC COVlD Dashboard, July 14, 2025 (U.S.) 🧵

Our model formalizes the mathematical assumptions in those predictions. If transmission follows what we know in terms of how waves grow or slow generally and historical patterns, this is what we'd expect.

The spottiness of the current real-time data reduce precision substantially. Retroactive corrections can make the forecast jump around from better to worse from one week to the next. Expect the worst. Hope for the best.Graph shows national transmission expected to increase the next several weeks.
4) PMC COVlD Dashboard, July 14, 2025 (U.S.) 🧵

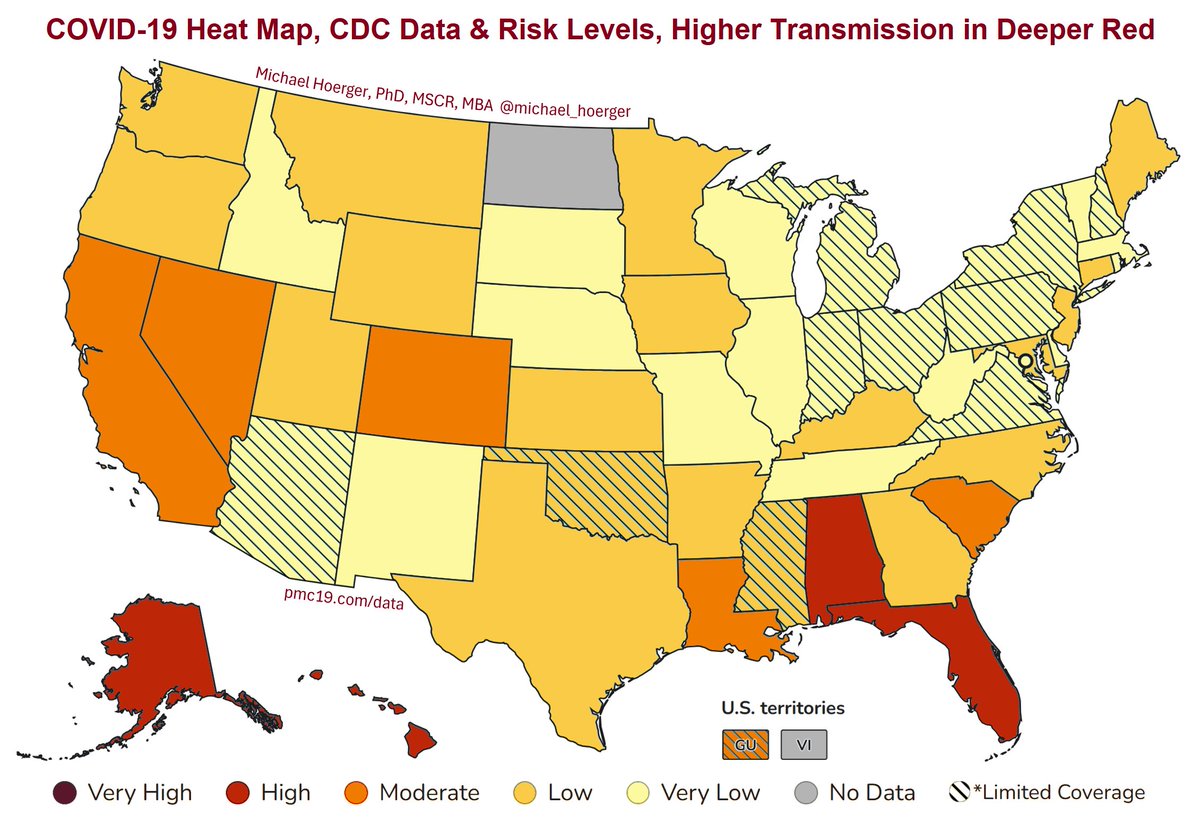
Although many speak of the wave in the future tense, several regions are presently surging.

Transmission is "high" in Alaska, Hawai'i, Florida, & Mississippi. "High" means at least an estimated 1 in 75 infectious. Heat map: Alaska, Hawai'i, Alabama, and Florida with the highest transmission. 11 states with little or no data.
5) PMC COVlD Dashboard, July 14, 2025 (U.S.) 🧵

Hawai'i, for example, has been surging for weeks.
CDC's graph of transmission in Hawai'i. "High" since May 31.
6) PMC COVlD Dashboard, July 14, 2025 (U.S.) 🧵

The Bay Area of California is surging. Any dark red "very high" transmission region has an estimate of at least 1 in 40 actively infectious.

In a room of 12, you're talking a 1-in-4 chance of exposure.

7) PMC COVlD Dashboard, July 14, 2025 (U.S.) 🧵

Note, the CDC "restandardizes," "cleans," or improves the accuracy of its estimates each week and with big updates on Jan 1 and July 1.

This is all normal stuff, but you may notice the PMC multiplier shifted down a little more (a stat we use in converting wastewater levels to case estimates). Some of the left-side axes on various graphs have been updated too.

The CDC used to have a banner noting the Jan/Jul 1 thing year-round. It was misunderstood and even used by disinformation artists to try to portray wastewater data poorly.

Amid many negative changes to federal websites the past several months, the CDC C19 wastewater pages have improved in a few minor areas, especially getting rid of things like that banner that just confused people.CDC graph of longitudinal transmission, and tables with stats like the PMC multiplier.
8) PMC COVlD Dashboard, July 14, 2025 (U.S.) 🧵

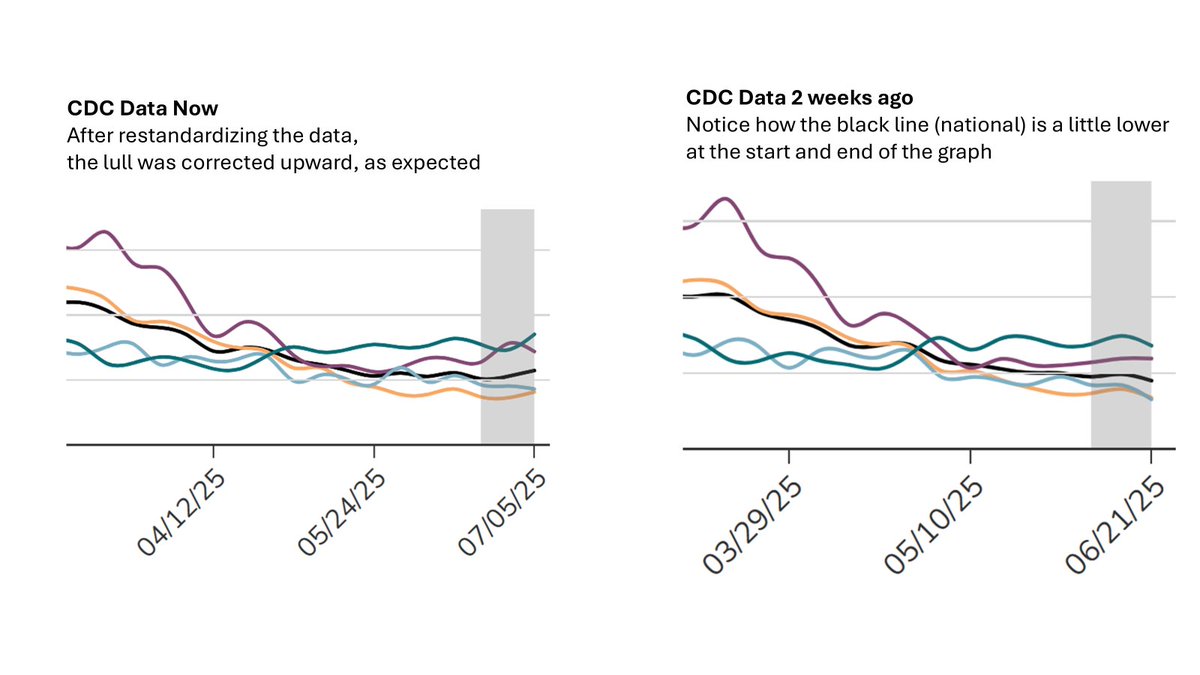
That's all pretty technical stuff in the analytic weeds, but the update essentially means national levels didn't get as low as the CDC had previously estimated.

Some "big accounts" have downplayed summer transmission. They are often more generalists and are not deep in these data. I noted previously the lull levels would likely get corrected upward, and this was in fact correct. Compare the most recent report versus 2 weeks ago.

See how the black line doesn't go as low now. You might have to zoom in to see it. It may seem small, but it had the effect of increasing 2025 infections (through June 21) by about 9 million.Comparison of a previous versus revised line graph, described in the post.
9) PMC COVlD Dashboard, July 14, 2025 (U.S.) 🧵

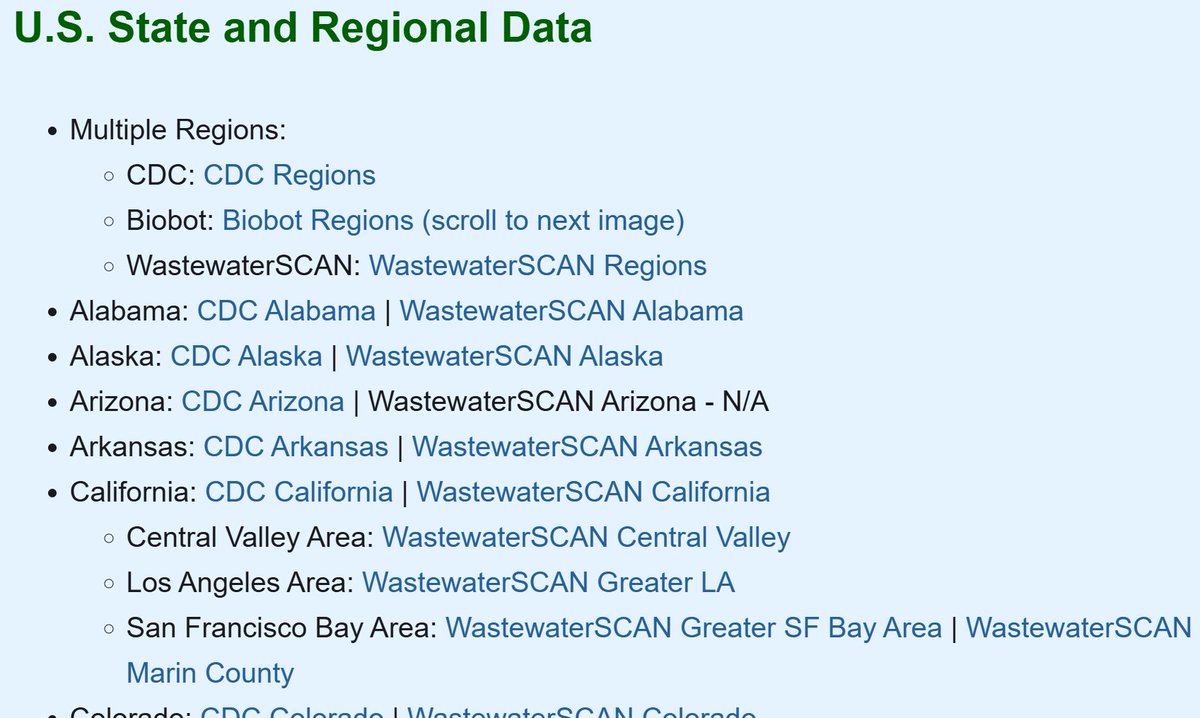
The COVID reporting delays and corrections and significant geographic variation can make it challenging to know one's local situation.

These resource may help:
pmc19.com/data/index.php…Screenshot of links to more localized data
10) PMC COVlD Dashboard, July 14, 2025 (U.S.) 🧵

We have also added an extensive repository to worldwide COVID surveillance data trackers.

11) PMC COVlD Dashboard, July 14, 2025 (U.S.) 🧵

Find the complete PMC dashboard at pmc19.com/data

Localized data: pmc19.com/data/index.php…

Worldwide data:
pmc19.com/data/index.php…

Please improve and share info across platforms. 🙏 Image of the entire dashboard, summarized in previous posts in the thread and their ALT text.

• • •

Missing some Tweet in this thread? You can try to force a refresh
 

Keep Current with Mike Hoerger, PhD MSCR MBA

Mike Hoerger, PhD MSCR MBA Profile picture

Stay in touch and get notified when new unrolls are available from this author!

Read all threads

This Thread may be Removed Anytime!

PDF

Twitter may remove this content at anytime! Save it as PDF for later use!

Try unrolling a thread yourself!

how to unroll video
  1. Follow @ThreadReaderApp to mention us!

  2. From a Twitter thread mention us with a keyword "unroll"
@threadreaderapp unroll

Practice here first or read more on our help page!

More from @michael_hoerger

Jan 25
During this 12th COVlD wave, the CDC reports 1-in-3 states have "High" or "Very High" levels.

PMC estimates the proportion of residents actively infectious (prevalence):
◾️USA: 1 in 67
◾️IA: 1 in 27
◾️MI: 1 in 25
◾️IN & CT: 1 in 23
◾️ME: 1 in 21
◾️OK & SD: 1 in 17

🧵1/ Heat map using CDC data. National PMC prevalence estimate noted; estimated incidence of 732,000 new daily infections.
On average, Americans have have 5.0 cumulative SARS-CoV-2 infections.

This week's infections are expected to result in 1/4 to 1 million new #LongCOVID conditions and ≈2,000 excess deaths.
🧵2/ Column 1: Table of state-level prevalence estimates. Highest estimates noted in the thread text.  Column 2:  Proportion Actively Infectious										1 in 67 (1.5%) New Daily Infections										 732,000  Infections the Past Week										 5,220,000  Infections in 2026										 24,000,000  Cumulative Infections per Person										 5.04  										 Long COVID										 Long COVID Cases Resulting								37,000 to 146,000		   from New Daily Infections										 Long COVID Cases Resulting								261,000 to 1,040,000		   from New Weekly Infections										 										 Excess Deaths										 Ex...
The wave peak is now estimated >10% higher than last week at 1.2 million new daily infections, nearly double the Delta wave.

We expect sustained high transmission (≈600,000 to 750,000 new daily infections) the next few weeks as COVlD circulates through schools/families.
🧵3/ Fig 1: Graph of 12 waves  Fig 2: "Barometer" showing above average transmission  Fig 3: Year-over-year graph, which informs the analytic forecast  Fig 4: Forecast described in post
Read 4 tweets
Jan 17
Based on today's CDC & Biobot data, we estimate the following for the week of Jan 19:

🔸1 in 52 people in the U.S. actively infectious
🔸25% chance of exposure in a room of 15 ppl
🔸Nearly 1 million new daily infections
🔸5 cumulative infections per person all-time (avg)
🧵1/5 Heat map from CDC data with PMC estimates. Description of "Very High" states in next post
Transmission estimates have been marginally corrected upward.

11 states have Very High COVlD levels:

🔸PA: 1 in 25 estimated actively infectious
🔸MI: 1 in 23
🔸OH & KY: 1 in 22
🔸SD: 1 in 20
🔸NE & IA: 1 in 18
🔸IL & ME: 1 in 17
🔸IN: 1 in 16
🔸WV: 1 in 11
🧵2/5 Proportion Actively Infectious										1 in 52 (1.9%) New Daily Infections										 941,000  Infections the Past Week										 6,020,000  Infections in 2026										 18,000,000  Cumulative Infections per Person										 5.01  										 Long COVID										 Long COVID Cases Resulting								47,000 to 188,000		   from New Daily Infections										 Long COVID Cases Resulting								301,000 to 1,200,000		   from New Weekly Infections										 										 Excess Deaths										 Excess Deaths Resulting 									270 to 450	   from New Daily Infections										 Excess Deaths Resulting 				...
We're in the middle of a 12th COVlD wave.

The peak has likely passed, but with students headed back to school, transmission is expected to remain high for at least the next several weeks.

🧵3/5 1) Graph of 12 waves 2) Barometer showing above-average transmission 3) Year over year graph 4) Forecast for transmission to decline and then percolate at high levels
Read 5 tweets
Jan 10
The size of the winter COVlD wave has been revised upward as post-holiday data come in.

We estimated 1 in 55 people in the U.S. are actively infectious.

🔥WV: 1 in 14
🔥IN: 1 in 15
🔥MI & OH: 1 in 21
🔥MO: 1 in 22
🔥CT: 1 in 24
🔥KS: 1 in 25
🔥MA & IL: 1 in 27

Quick 🧵 1/4 Heat map and PMC estimates, 1 in 55 infectious and 892,000 new daily infections for Jan 12.  We expedited the report to release it two days early.
Nationally, we are seeing an estimated 892,000 new daily SARS-CoV-2 infections, meaning a 1 in 4 chance of exposure in a room of 15 people. Risk varies considerably by state.

We are approaching an average of 5 infections per person since pandemic onset.
🧵 2/4 Alabama	Moderate Alaska	Very Low Arizona	Very Low Arkansas	High* California	Very Low Colorado	Low Connecticut	Very High Delaware	Moderate District of Columbia	Very Low Florida	Very Low Georgia	Very Low Guam	Very Low Hawaii	Very Low Idaho	Very Low Illinois	Very High Indiana	Very High Iowa	High Kansas	Very High Kentucky	Moderate Louisiana	Moderate Maine	High Maryland	High Massachusetts	Very High Michigan	Very High* Minnesota	Moderate Mississippi	Low* Missouri	Very High* Montana	High Nebraska	High Nevada	Very Low New Hampshire	Moderate New Jersey	Low New Mexico	Moderate New York	High* North Ca...
We are in the 12th COVlD wave of the U.S.

Current transmission is higher than 68% of all days since the pandemic onset in 2020.
🧵 3/4 12 waves of COVlD  Pandemic barometer: Higher than 88% of the past 100 days, 73% of the past year, 68% of the entire pandemic.  Year over year graph  Forecast of slowly declining transmission.
Read 4 tweets
Jan 8
You might not have heard, but the northeastern U.S. is in a COVlD surge.

We use wastewater levels to derive estimates of the proportion of people actively infectious in each state (prevalence), e.g., 1 in 24 people in Connecticut.

Let me walk you through it...

🧵1/8 Colors show CDC levels PMC prevalence estimates noted: -Maine 1 in 38 actively infectious with COVlD -New Hampshire 1 in 35 (limited data) -Vermont 1 in 75 -New York 1 in 44 (limited data) -Pennsylvania 1 in 44 -Massachusetts 1 in 36 -Connecticut 1 in 24 -Rhode Island 1 in 41 -New Jersey 1 in 82
Notice that #Connecticut has excellent SARS-CoV-2 wastewater surveillance. It's "Very High" across much of the state, per CDC.

Based on wastewater levels, we estimate 1 in 24 residents are actively infectious w/COVlD. That's a 66% exposure risk in a room of 25 people.

🧵2/8 Colors show CDC levels PMC estimate of prevalence
The CDC reports "Very High" levels in #Massachusetts.

The surveillance is less robust, but we estimate 1 in 26 residents are actively infectious, similar to our estimate in CT where coverage is better.

In a room of 25 people, that's a 62% chance of an exposure.

🧵3/8 Colors show CDC levels PMC prevalence estimates provided
Read 8 tweets
Jan 8
We're in the middle of a 12th COVlD wave in the U.S., with transmission particularly high in the Midwest and Northeast.

The CDC announced this week that COVlD continues to kill more Americans than breast and prostate cancer combined.

Get boosted & #MaskUp 💉💪😷
1/4🧵 Heat map of CDC data with PMC prevalence estimate
Levels are "Moderate" to "Very High" in 26 states.

However, data reporting is slow, and about 1/3 of states have low-quality data this week due to the holidays and illness.

2/4🧵 National estimates: Number of People		Chances Anyone is Infectious			 1				1.5%	 2				3.0%	 3				4.5%	 4				6.0%	 5				7.4%	 10				14.3%	 15				20.7%	 20				26.5%	 25				32.0%	 30				37.0%	 50				53.8%	 75				68.6%	 100				78.6%	 200				95.4%	 300				99.0%
Barometer: Higher transmission than 90 of the past 100 days (perhaps higher still, due to low data reporting quality)
State	CDC Level	Actively Infectious Alabama	Moderate	1 in 48 (2.1%) Alaska	Very Low	1 in 152 (0.7%) Arizona	Very Low	1 in 201 (0.5%) Arkansas	High*	1 in 36 (2.8%) California	Very Low	1 in 484 (0.2%) Colorado	Moderate	1 in 49 (2.0%) Connecticut	Very High	1 in 24 (4.2%) Delaware	Low*	1 in 70 (1.4%) District of Columbia	Very Low	1 in 5,835 (0.0%) Florida	Very Low	1 in 284 (0.4%) Georgia	Low	1 in 90 (1.1%) Guam	Very Low	1 in 687 (0.1%) Hawaii	Very Low	1 in 874 (0.1%) Idaho	Very Low	1 in 169 (0.6%) Illinois	Moderate*	1 in 56 (1.8%) Indiana	High*	1 in 34 (2.9%) Iowa	Moderate	1 in 41 (2.4%) Kansas...
State	CDC Level	Actively Infectious Missouri	Moderate*	1 in 42 (2.4%) Montana	High	1 in 34 (2.9%) Nebraska	Very High	1 in 26 (3.9%) Nevada	Very Low	1 in 138 (0.7%) New Hampshire	High*	1 in 35 (2.9%) New Jersey	Low	1 in 82 (1.2%) New Mexico	Low	1 in 87 (1.2%) New York	Moderate*	1 in 44 (2.3%) North Carolina	Low	1 in 82 (1.2%) North Dakota	High*	1 in 34 (3.0%) Ohio	Very High	1 in 27 (3.7%) Oklahoma	Moderate*	1 in 62 (1.6%) Oregon	Very Low	1 in 170 (0.6%) Pennsylvania	Moderate	1 in 44 (2.3%) Rhode Island	Moderate	1 in 41 (2.4%) South Carolina	Moderate	1 in 54 (1.9%) South Dakota	Very High	1 in...
If like years 1-4 of the pandemic, the winter wave has peaked. If like last year, we could hover near peak levels for a month.

Forecasting quality is low with 1/3 of states having data issues. Hopefully, we'll know a lot more in a few days.

3/4🧵 12 waves
Proportion Actively Infectious										1 in 65 (1.5%) New Daily Infections										 749,000  Infections the Past Week										 5,390,000  Infections in 2026										 3,000,000  Cumulative Infections per Person										 4.88  										 Long COVID										 Long COVID Cases Resulting								37,000 to 150,000		   from New Daily Infections										 Long COVID Cases Resulting								270,000 to 1,080,000		   from New Weekly Infections										 										 Excess Deaths										 Excess Deaths Resulting 									220 to 370	   from New Daily Infections										 Excess Deaths Resulting 					...
year over year graph
forecast
Read 4 tweets
Jan 5
We told you that 109,000-175,000 Americans would died of COVID (excess deaths) in 2025.

Today, the CDC estimates 101,000 deaths/year (flat from Oct 2022 to Sep 2024), and likely higher when considering more nebulous non-acute excess deaths (heart attack 6 months later).
1/5
The CDC estimates are actually higher than I would have guessed, given their methodology, which models estimates based on easily countable factors in healthcare and expert input on multiplier values. It lends credence to the PMC upper bound of excess deaths of 175,000/yr.
2/5
What's troubling is the CDC has annual mortality flat. My expectation based on mortality displacement and Swiss Re data is that it should be declining. If is stays flat, we're running on something like breast+prostate cancer or lung cancer deaths per year in perpetuity.
3/5
Read 6 tweets

Did Thread Reader help you today?

Support us! We are indie developers!


This site is made by just two indie developers on a laptop doing marketing, support and development! Read more about the story.

Become a Premium Member ($3/month or $30/year) and get exclusive features!

Become Premium

Don't want to be a Premium member but still want to support us?

Make a small donation by buying us coffee ($5) or help with server cost ($10)

Donate via Paypal

Or Donate anonymously using crypto!

Ethereum

0xfe58350B80634f60Fa6Dc149a72b4DFbc17D341E copy

Bitcoin

3ATGMxNzCUFzxpMCHL5sWSt4DVtS8UqXpi copy

Thank you for your support!

Follow Us!

:(