About that "no evidence of inflation" from tariffs...
If you know where to look, it seems pretty clear that inflationary pressures are building in the product categories most exposed to tariffs.
Case in point from today's June CPI report: Household Furnishings & Supplies, which saw prices jump nearly 1% m/m in June.
This was the sharpest monthly increase since the peak of the pandemic-driven inflation in early '22.
More evidence in the 🧵

Looking at the categories flagged as being most exposed to tariffs by two Fed staff economists earlier this year, you'll see a lot of the products in the Household Furnishings & Supplies category on this list 👇
https://x.com/Econ_Parker/status/1922290381292487033
Another category well-represented on the list of tariff-exposed products is Recreation Commodities, which also spiked by nearly 0.8% m/m in June.
Again, this was the sharpest monthly increase since the pandemic-driven surge in inflation back in 2022.
Again, this was the sharpest monthly increase since the pandemic-driven surge in inflation back in 2022.

Within Recreation Commodities, Video & Audio Products is a key segment near the top of the most impact list and it's clearly flipped from persistent deflation to monthly inflation exceeding 1%.

Interestingly, one of the highest profile goods exposed to tariffs has seen no clear tariff impact thus far, unless some of the surge in prices ahead of the tariff implementation can be attributed to front-running the anticipated tariffs.

To that point, we saw a surge in auto sales leading up to the Liberation Day, followed by a plunge in sales as the prior surge was clearly pull-forward behavior.
So, it seems automakers made hay during the demand surge, but the recent slowdown is now putting downward pressure on prices
So, it seems automakers made hay during the demand surge, but the recent slowdown is now putting downward pressure on prices

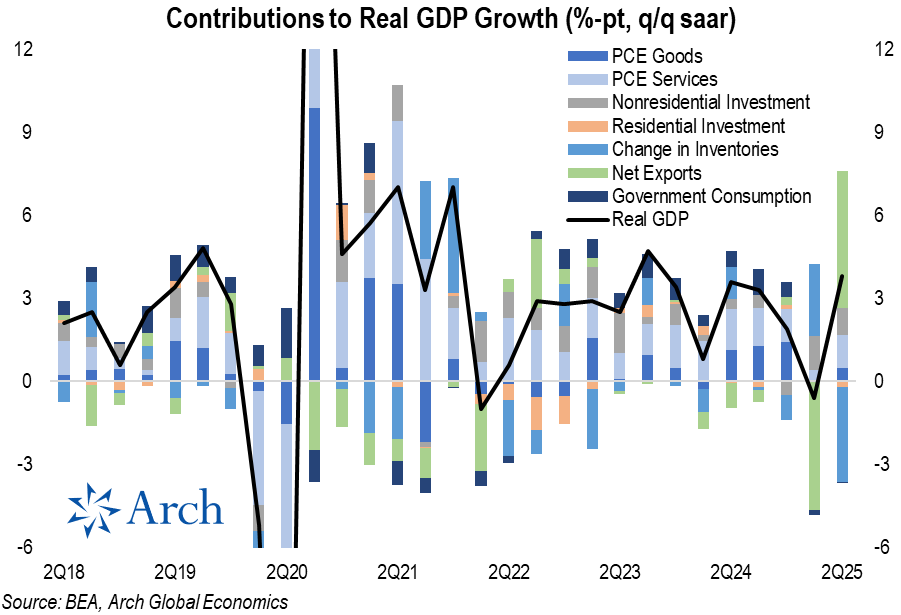
Stepping back from tariff-impacted goods and looking at the bigger picture, it is also true that broader inflationary pressures have abated.
Core CPI was just 0.23% in June despite the acceleration in tariff-impacted goods inflation and has averaged just under 0.2% per month over the past 3 months.
Core CPI was just 0.23% in June despite the acceleration in tariff-impacted goods inflation and has averaged just under 0.2% per month over the past 3 months.

The relatively contained core CPI reading was helped by the continued demand-driven drag from auto prices, which subtracted -14bps from Core Goods inflation in June.
The recent persistent drag from auto prices has offset a decent amount of the surge in prices for the other tariff-impacted goods highlighted above.
The recent persistent drag from auto prices has offset a decent amount of the surge in prices for the other tariff-impacted goods highlighted above.

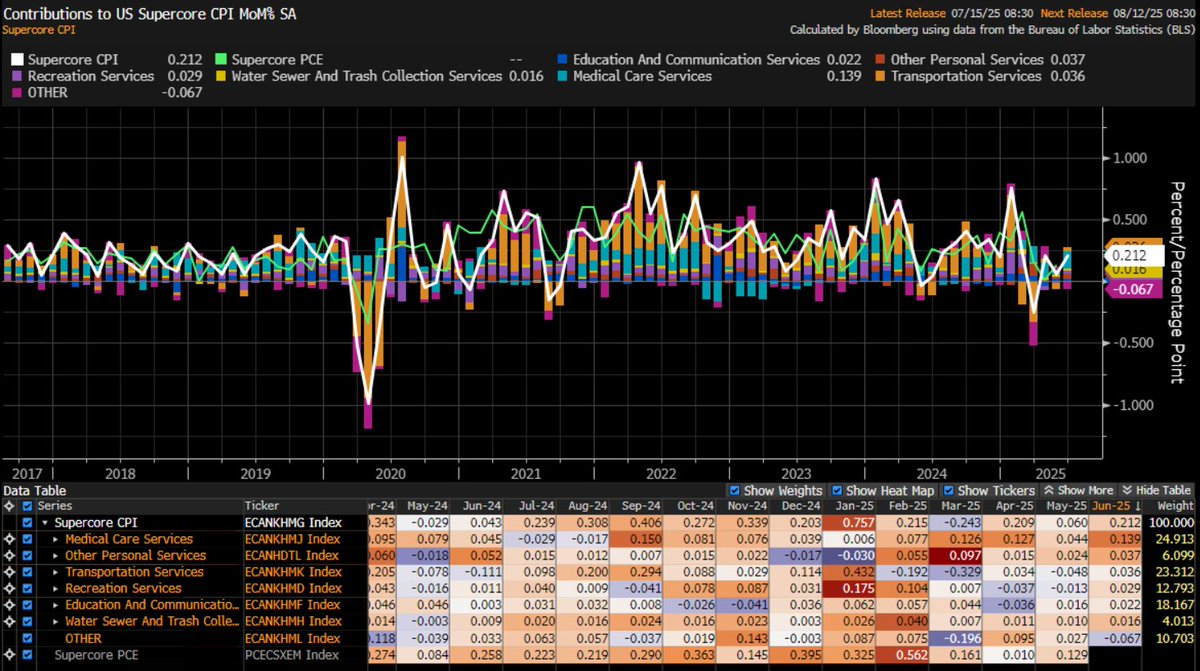
Similarly, Supercore CPI inflation (i.e., core services excluding shelter) was up 0.21% m/m in June, or roughly in-line with its historical average monthly pace despite a 14bps bump from Medical Care Services alone.
• • •
Missing some Tweet in this thread? You can try to
force a refresh