
Global Chief Economist @ ACGL | ex JPM AIG HUD | Husband to Jamie; Dad to Landon, Greyson & Logan | No investment advice & views are my own 🦬🇺🇸🇮🇱
12 subscribers
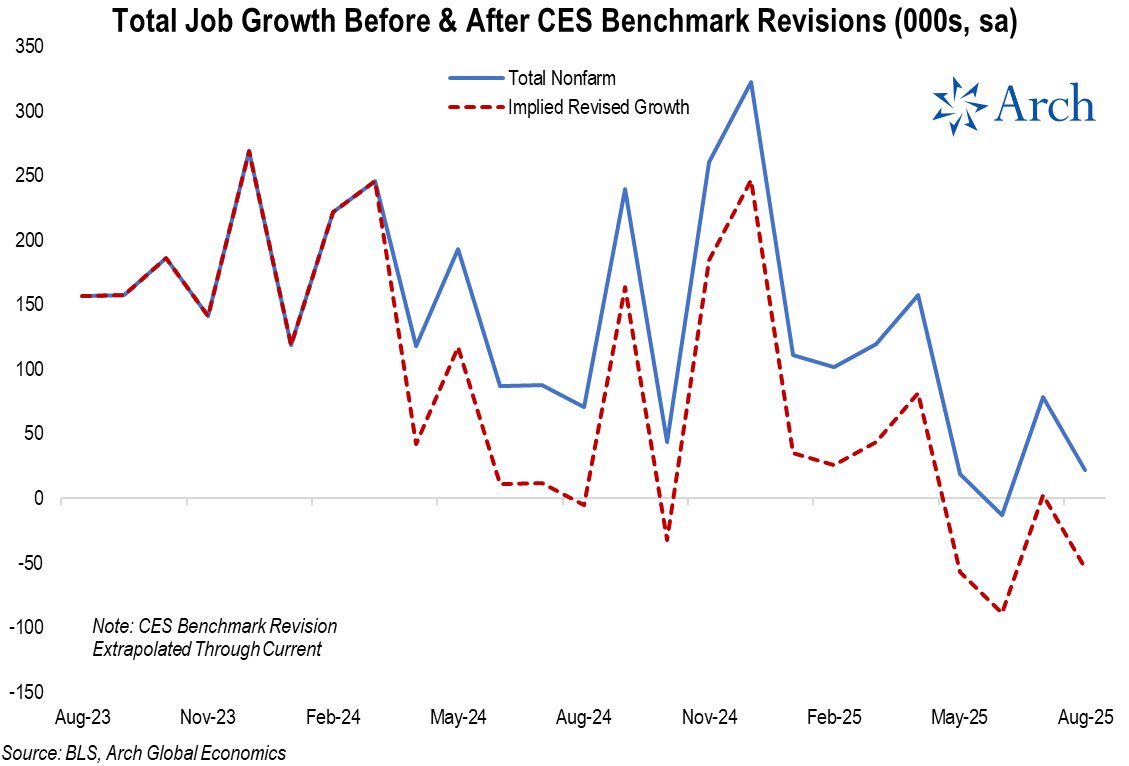
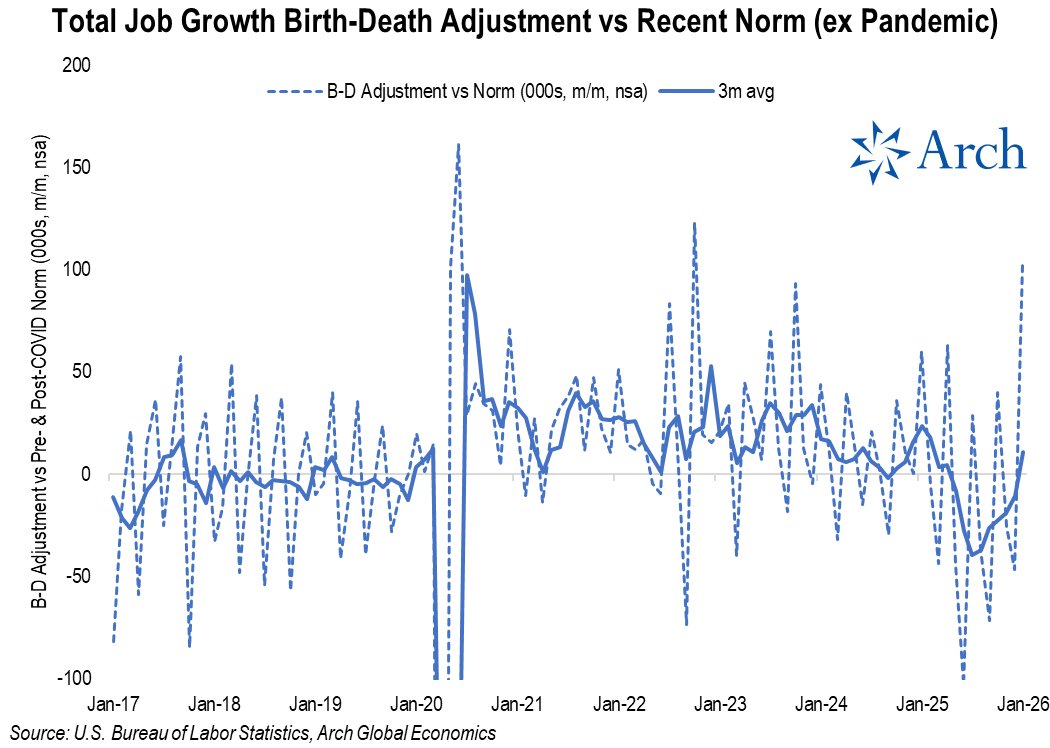 First, the fundamental error: you cannot subtract the not seasonally adjusted (NSA) birth-death adjustment from the seasonally adjusted (SA) headline payroll number.
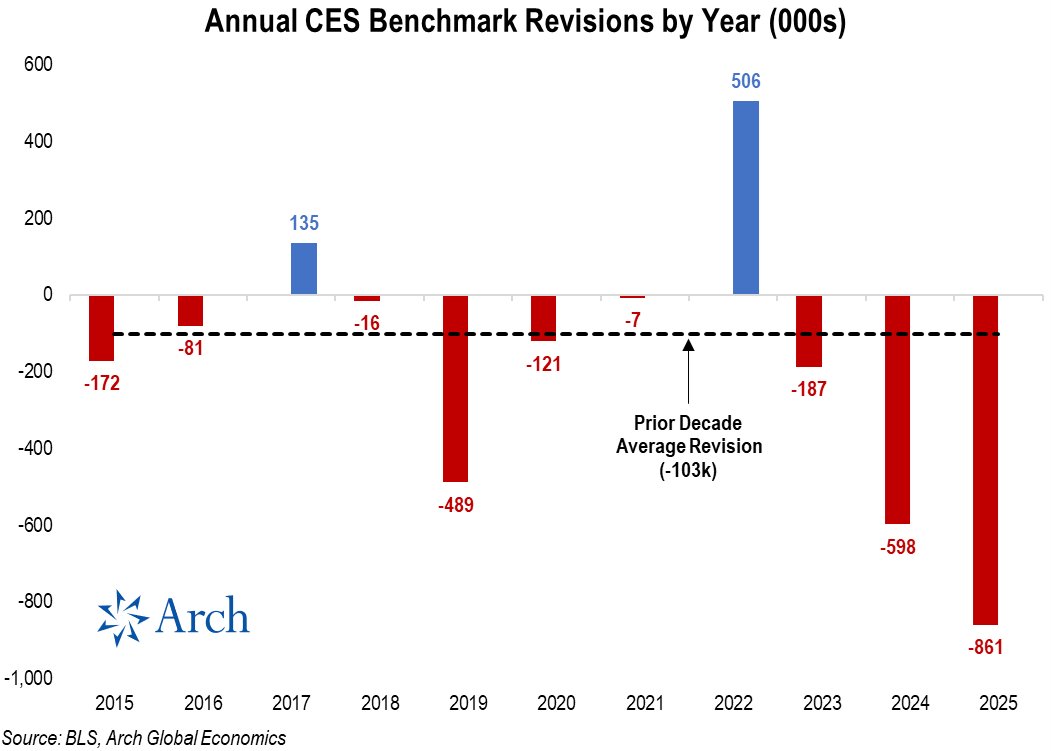 The final benchmark revision for March 2025: -898k (SA), or -0.6%.
 The $200B figure is massive relative to GSE capital. For context, Fannie and Freddie have a combined accumulated net worth of ~$173B as of late 2025.
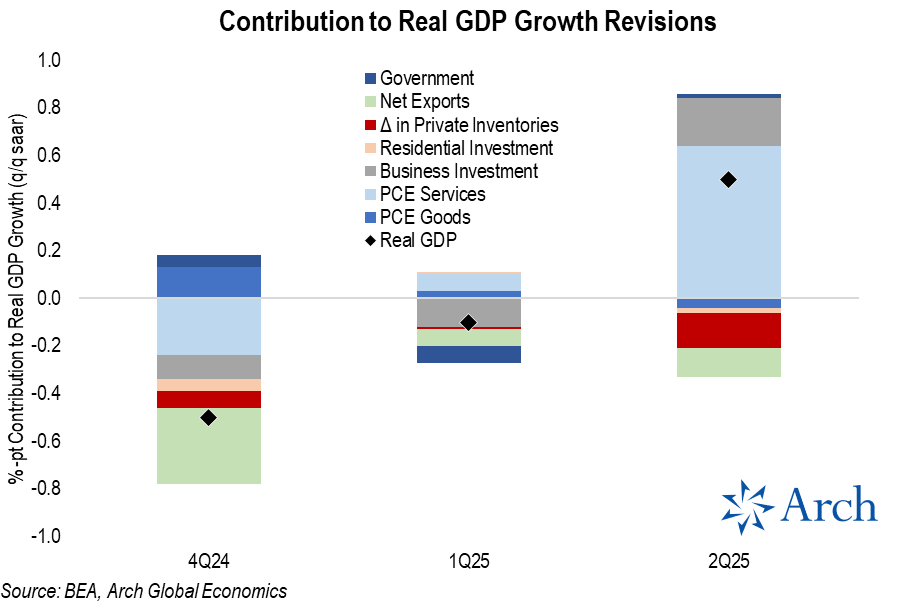 Looking at the revised series, here's contributions to real GDP growth over time, showing all of the slowdown occurred in Q1, with exports and inventories driving most of the swing.
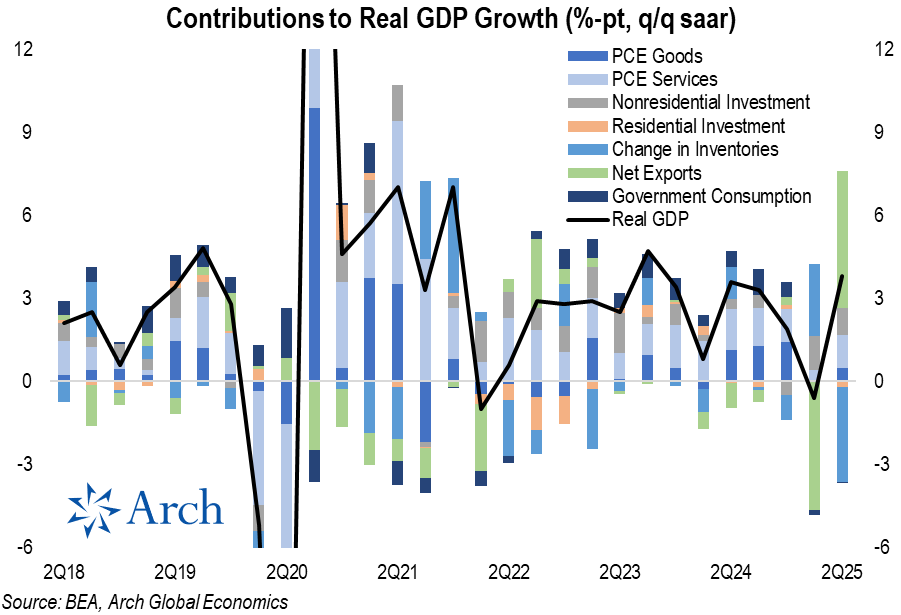
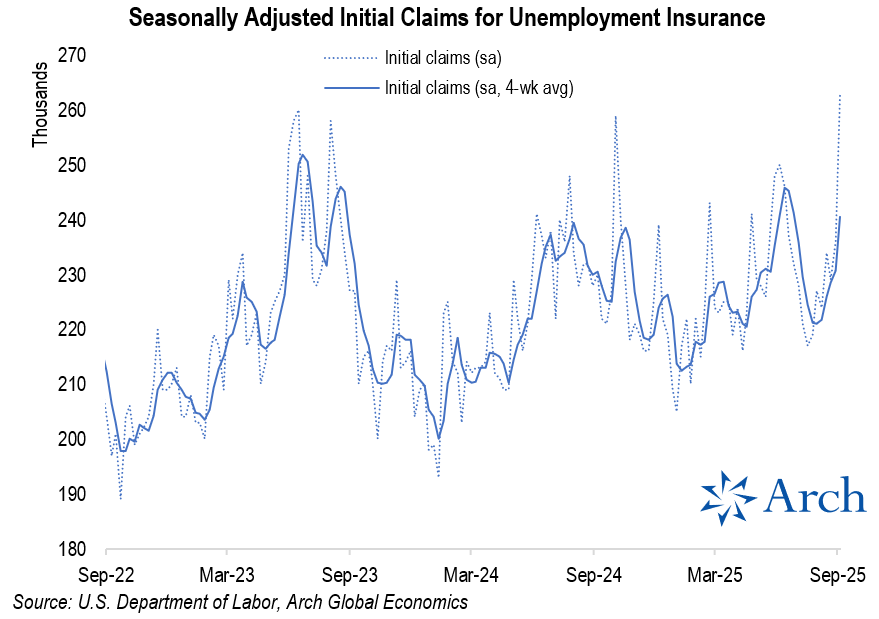
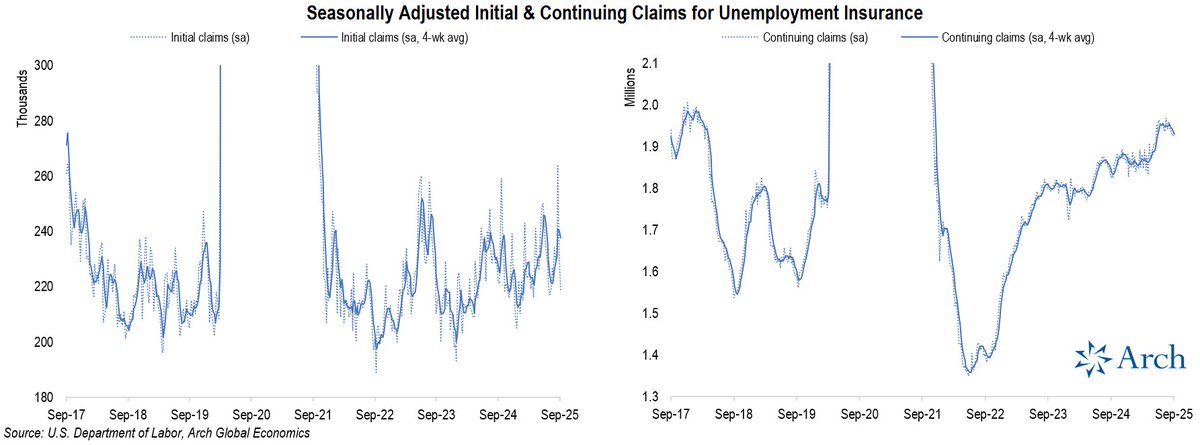 After one of the highest weekly increases in jobless claims in a while, we now have had outsized back-to-back weekly declines...
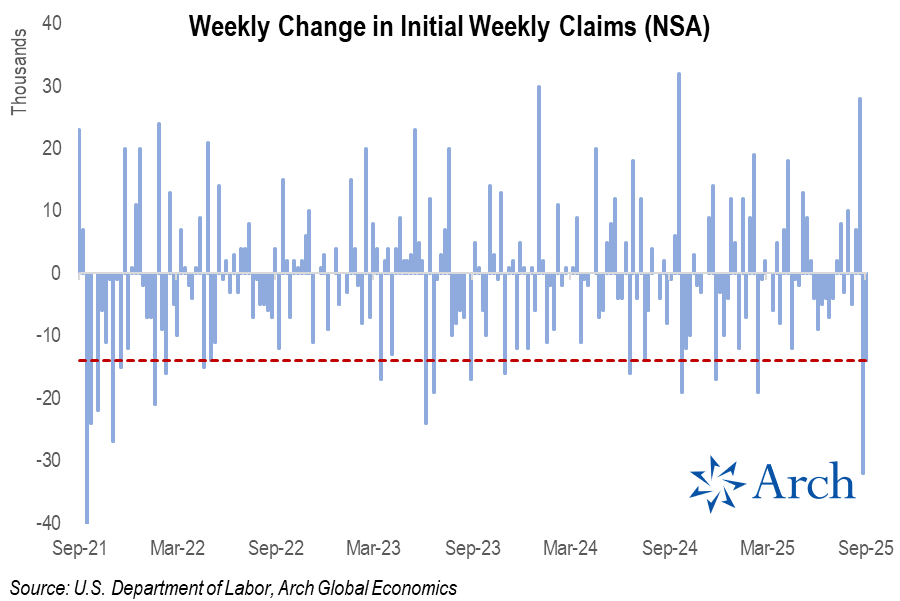
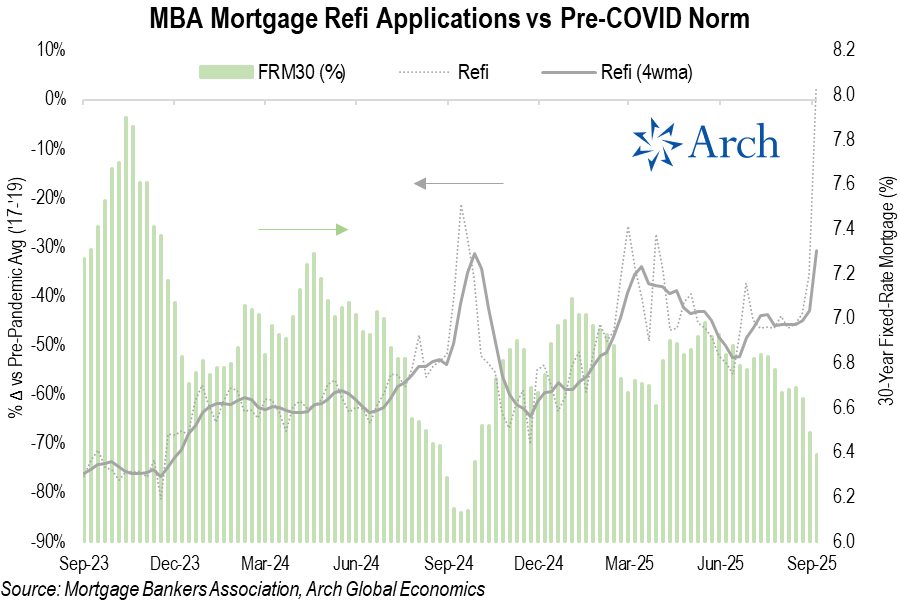 Mortgage purchase application activity was much less exciting...
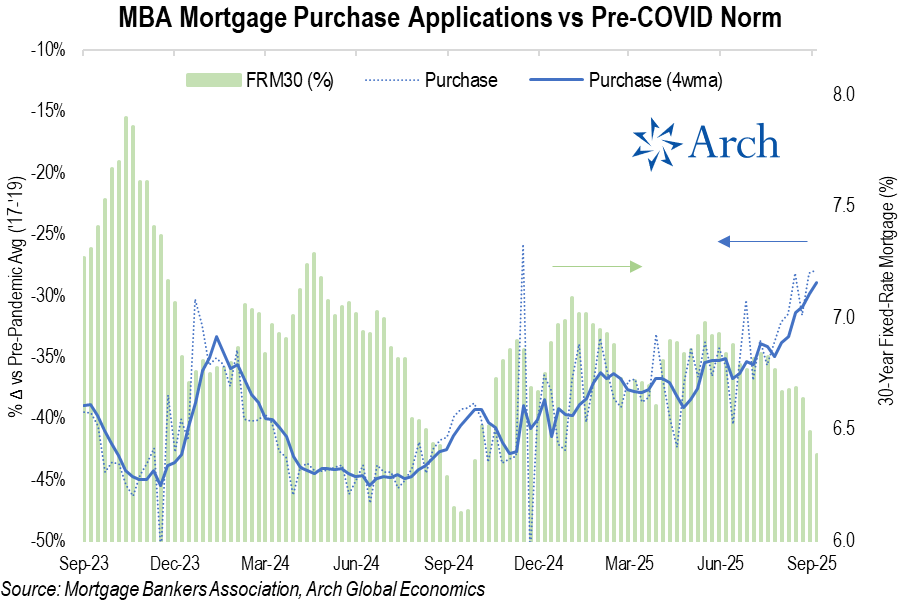
 Let's start with how big of a weekly increase this was.
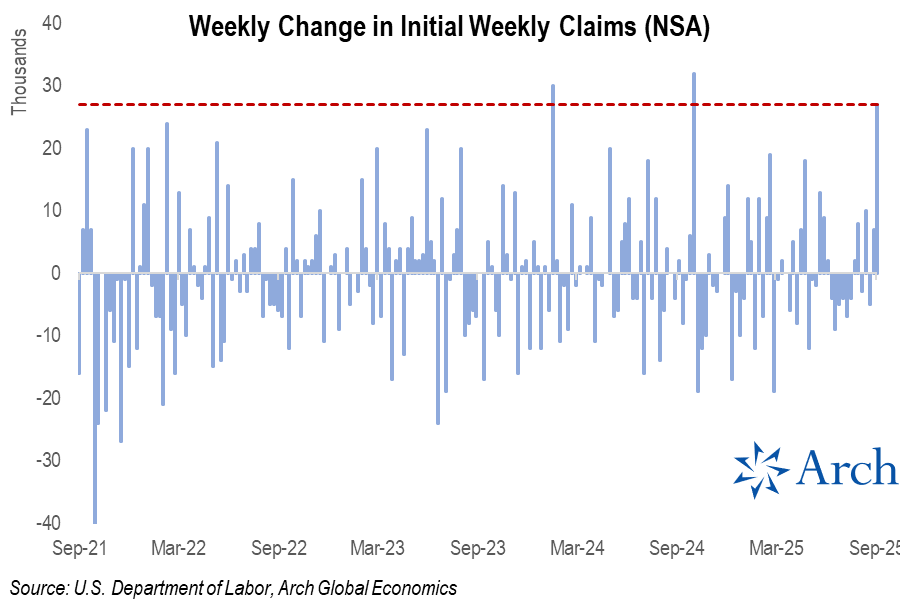
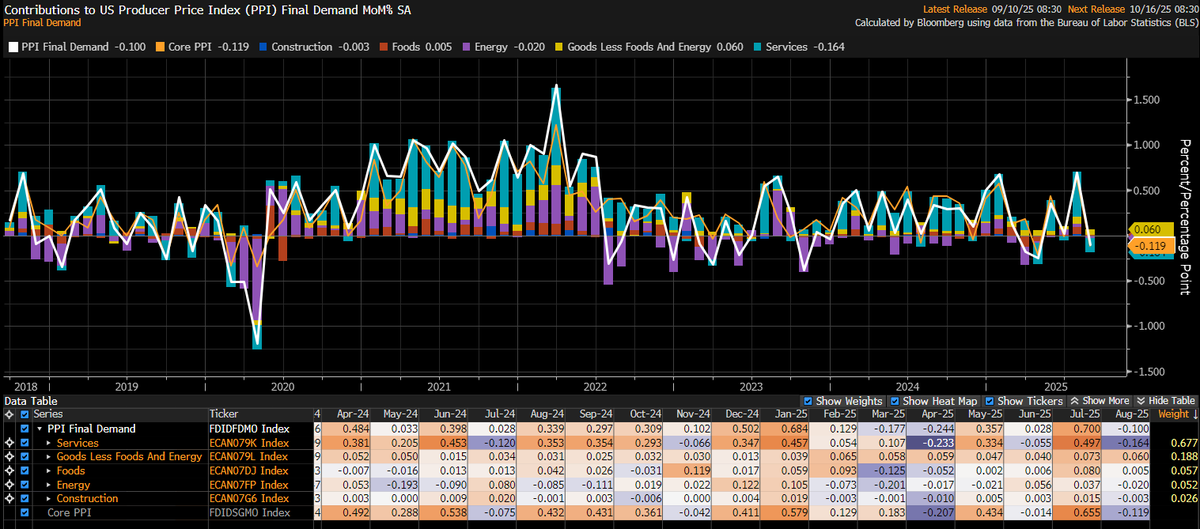 Let's look at Goods Less Food And Energy, what I was referring to as "Core Goods."
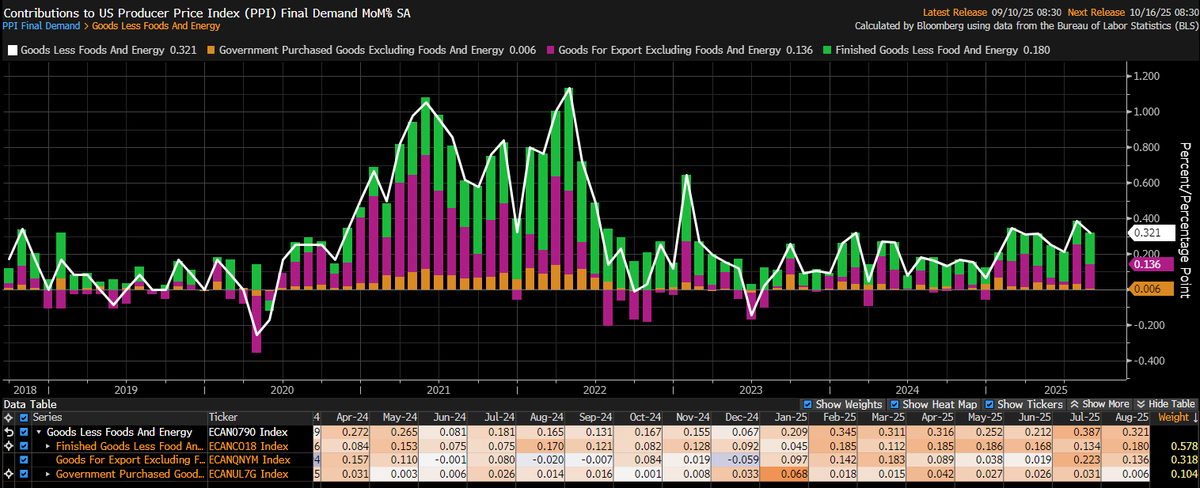
 Here's a look at job growth over the prior 4 months, with sector-level revisions incorporated.
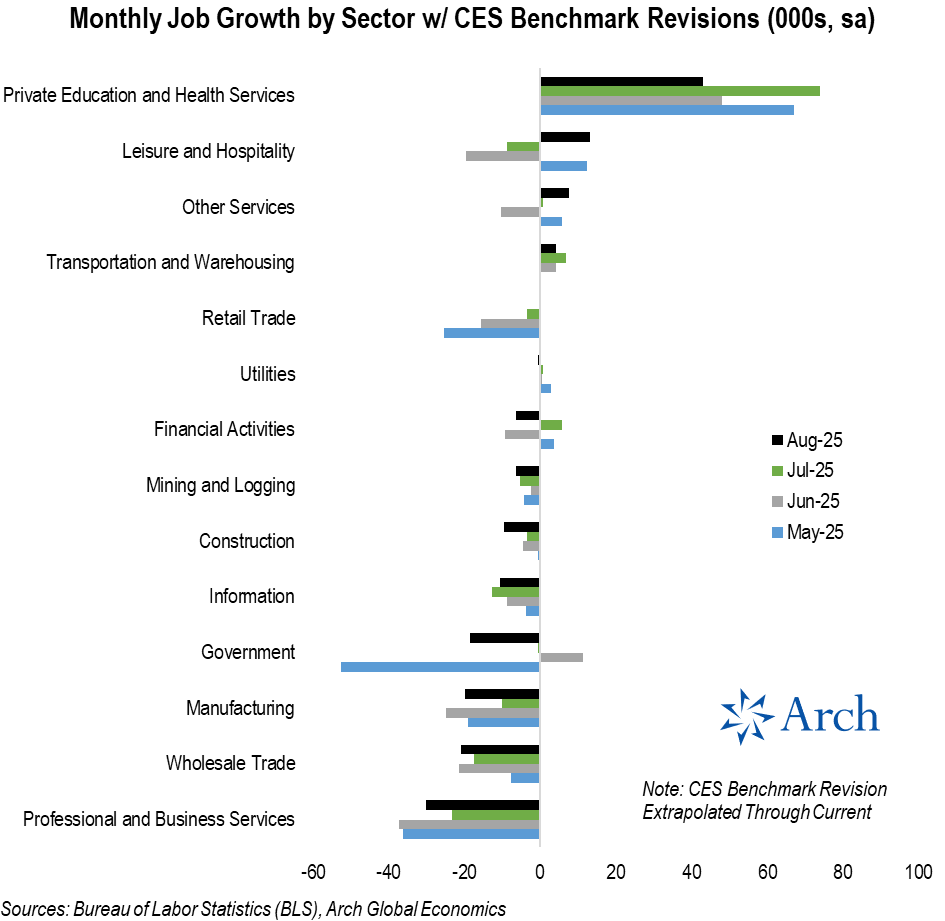
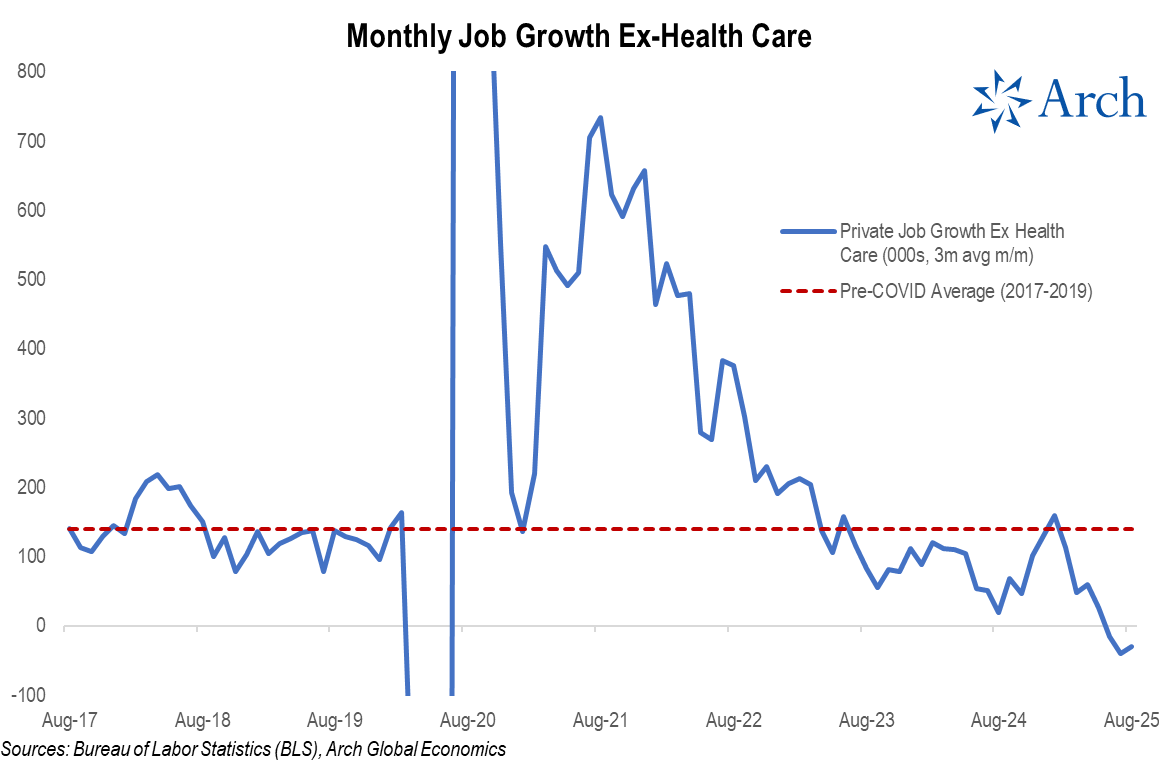 Here's the same data, but with the breakdown of health care jobs (grey) vs all other industries.
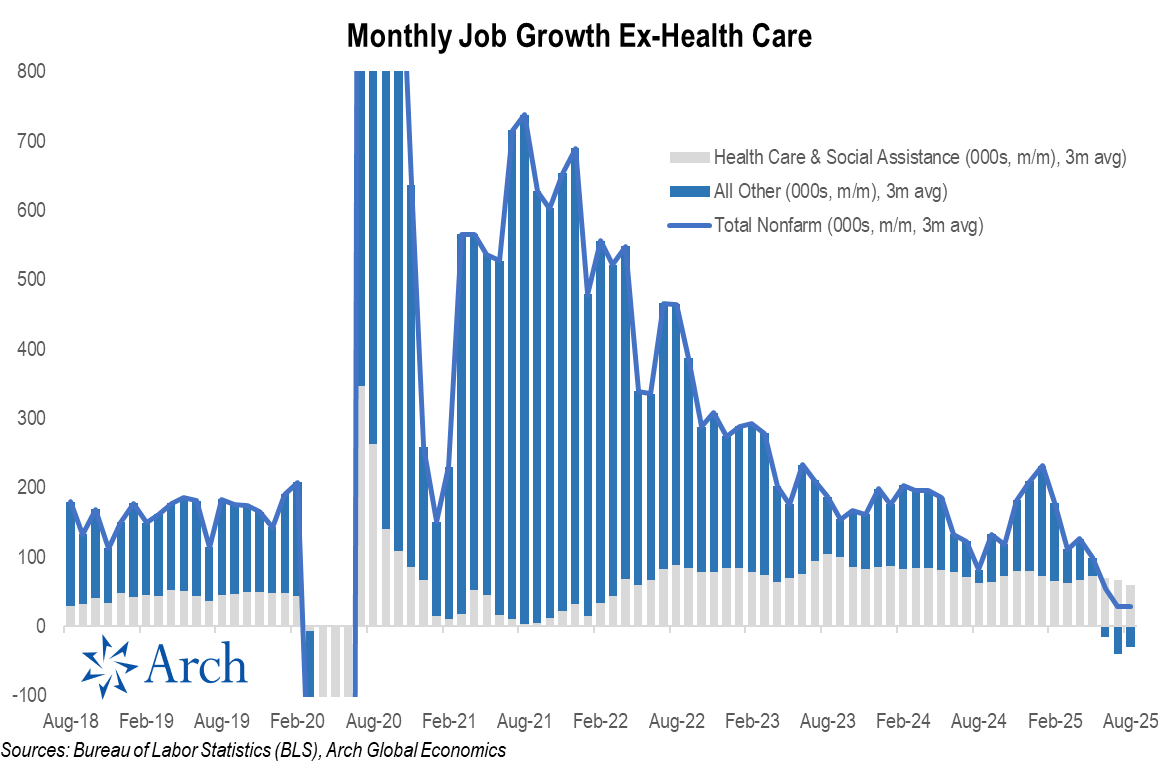
 Let's look under the hood at which regions are driving the recent downshift.
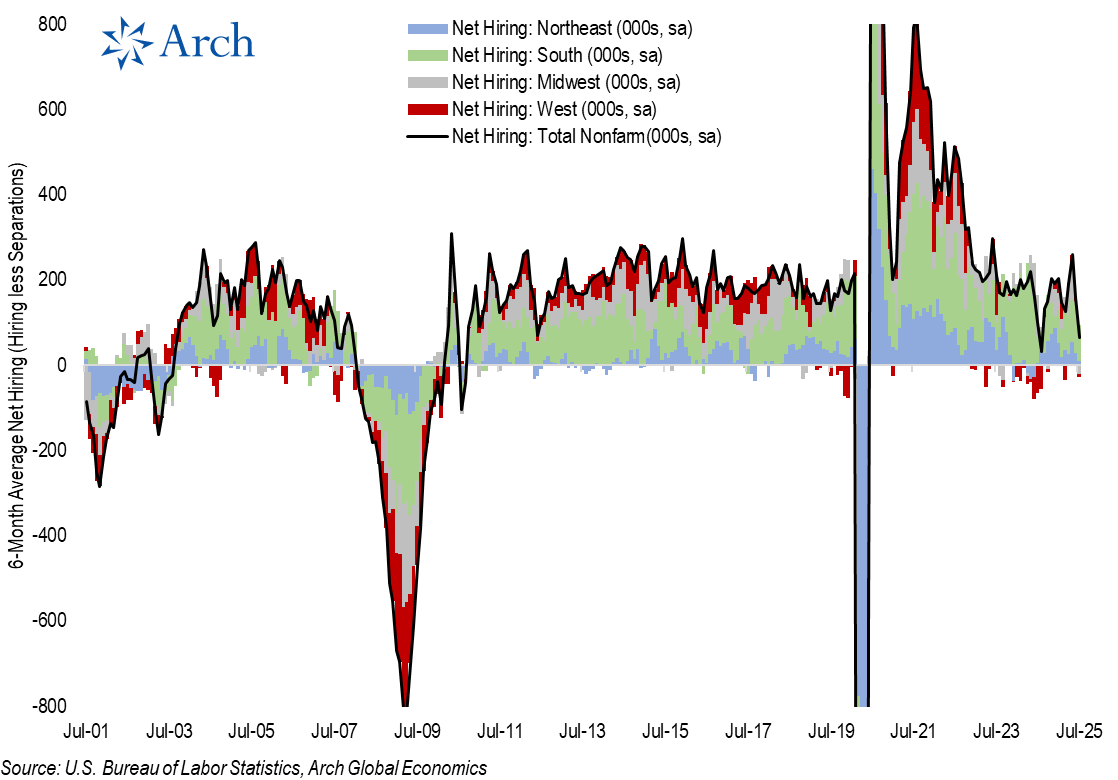
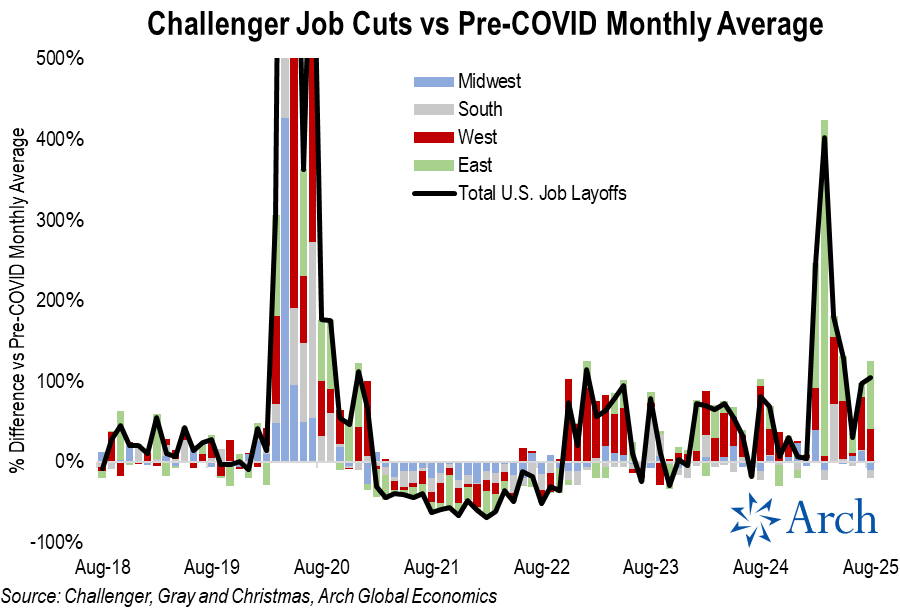 On an absolute basis, announced job cuts were ~44k above normal for August, with most of the lift coming from the east (35.2k above normal), followed by the West (17.1k), with the South and Midwest both below their pre-COVID norm, -3.9k and -4.3k, respectively.
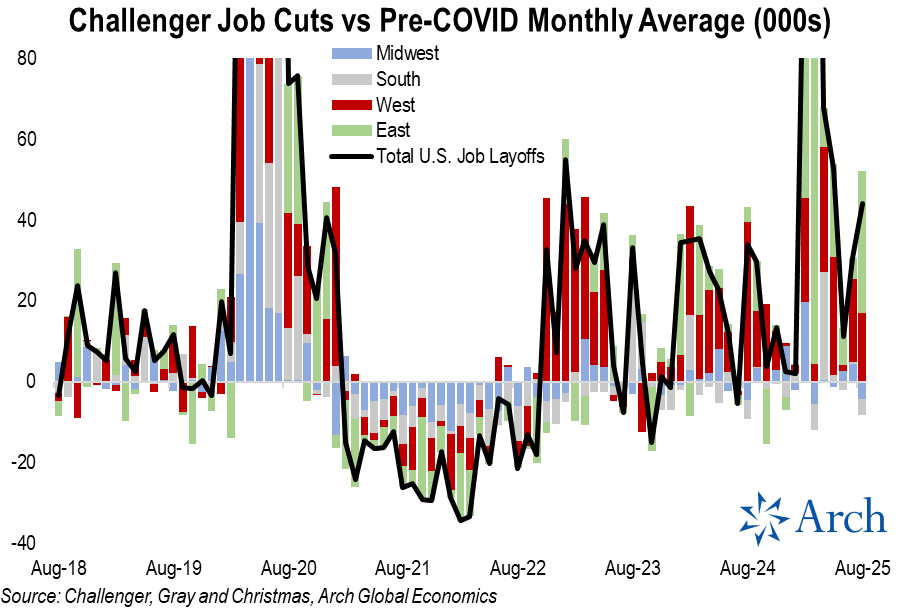
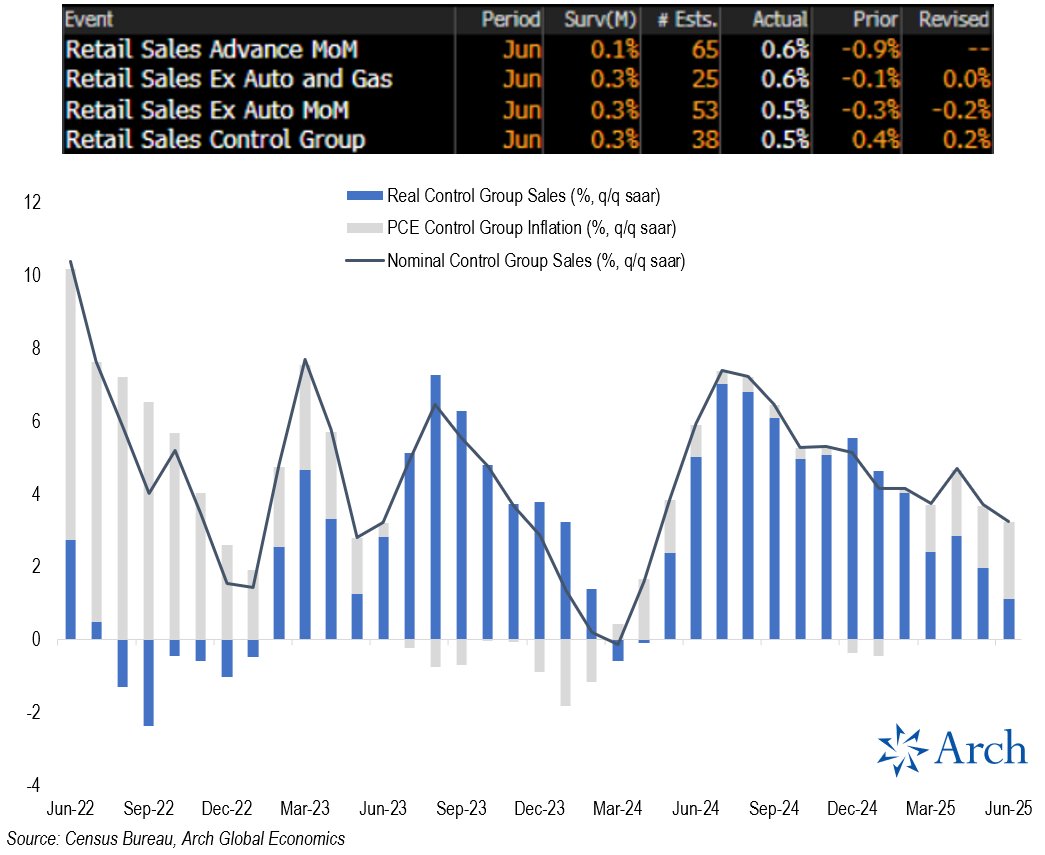
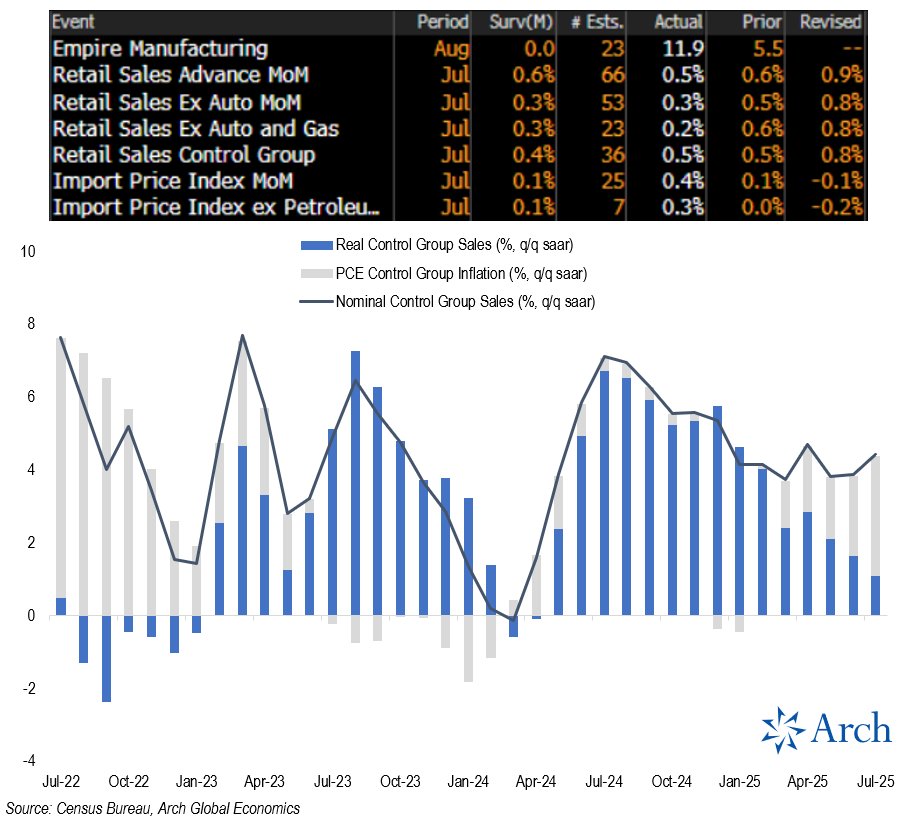 My read: although nominal control group growth has remained “solid” in the mid-single digits, real (inflation adjusted) control group growth has cooled notably from robust growth in ’24 (peak of almost 7% q/q saar) to just a 1% quarterly annualized pace in July.
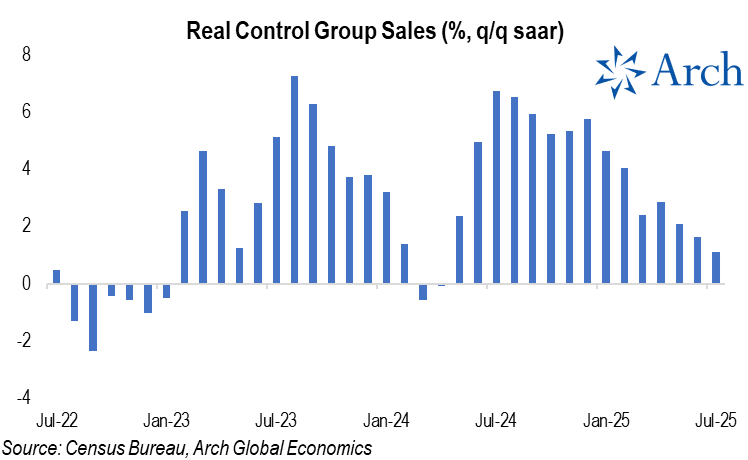
 There has been a clear rebound in initial claims by federal employees for unemployment insurance, which surged higher in July.
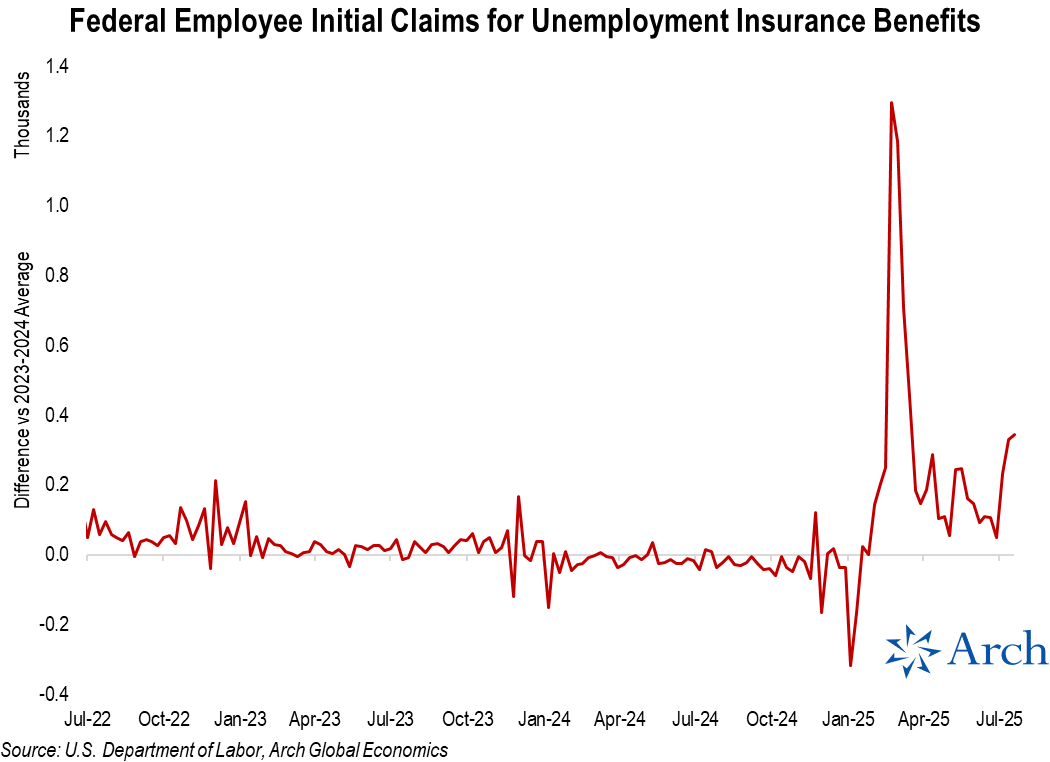
 The labor force participation rate has dropped from a recent peak of 62.8% back in Nov '23 to 62.2% in July '25.
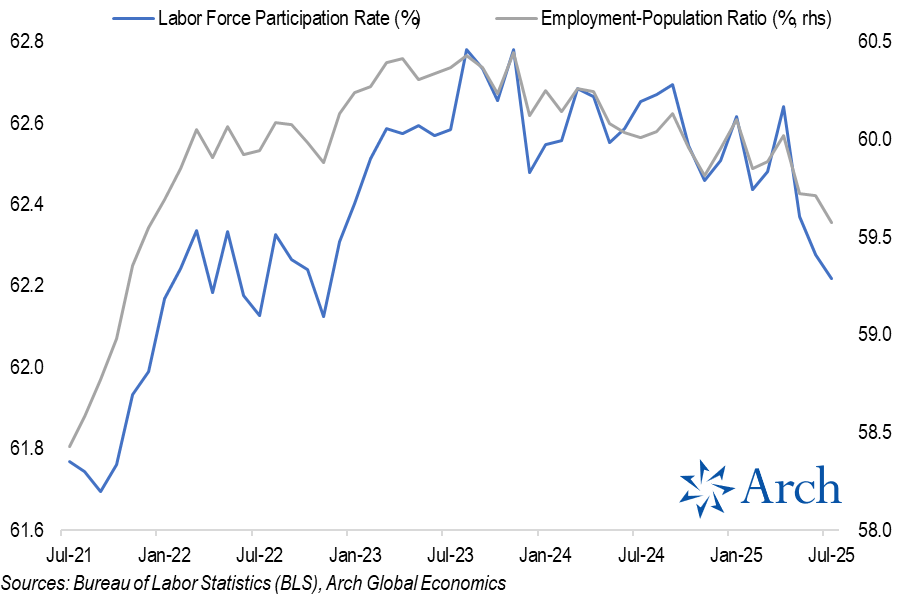
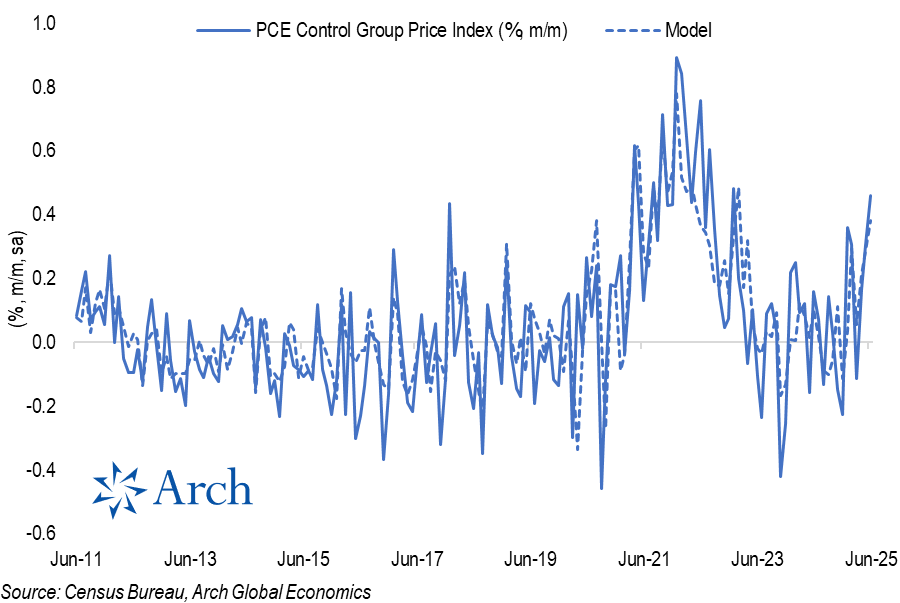 Given the upward revisions to May PCE and modest upside surprise for core inflation, control group inflation accelerated to 0.46% m/m in June, above my 0.38% model estimate and up from 0.31% in May.
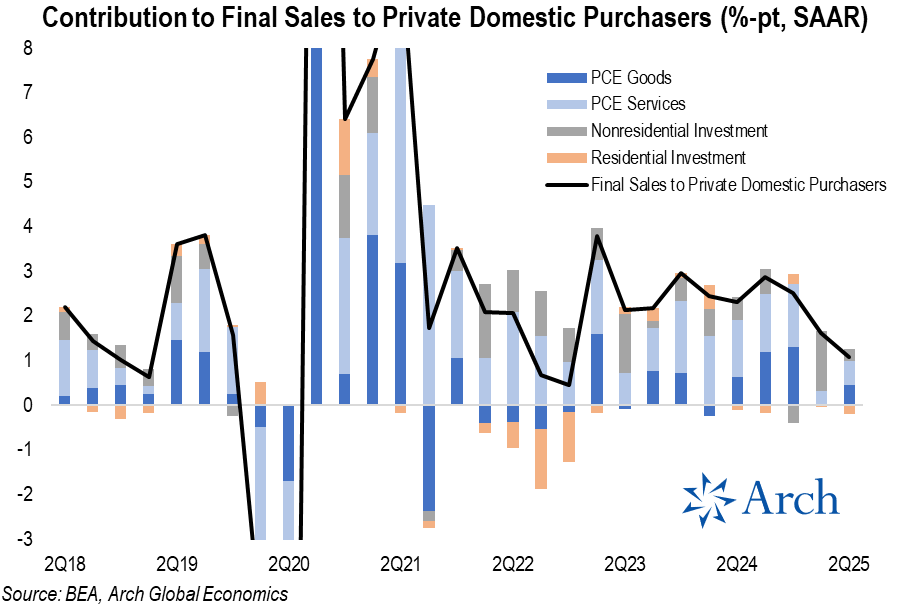 Headline GDP was flattered by a snap back in net exports as frontloading of imports to get ahead of tariffs in Q1 left a void in Q2.
 Here's a look at the simple model I used to estimate the PCE Control Group price index, which leverages CPI and PPI price indexes that correspond to Control Group spending categories like appliances, furniture / furnishing, construction materials, consumer electronics, recreational goods.
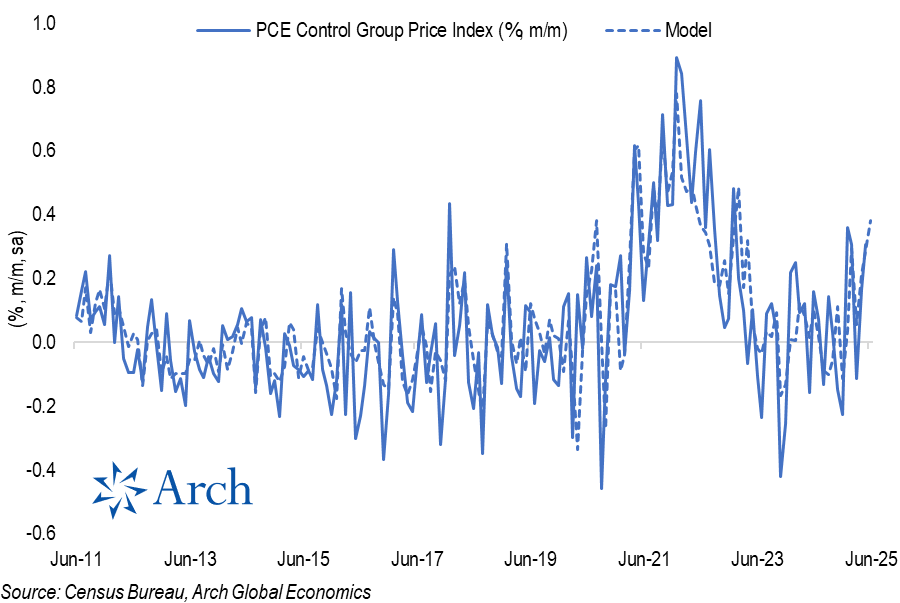
 Looking at the categories flagged as being most exposed to tariffs by two Fed staff economists earlier this year, you'll see a lot of the products in the Household Furnishings & Supplies category on this list 👇
 As noted at the top, there was a widespread rebound, with consumers' assessment of Current Economic Conditions and Expectations both rising, by a respective 4.8 and 10.5 points.
 Two things worth noting before going further: