🚨 The inflation fight is NOT over.
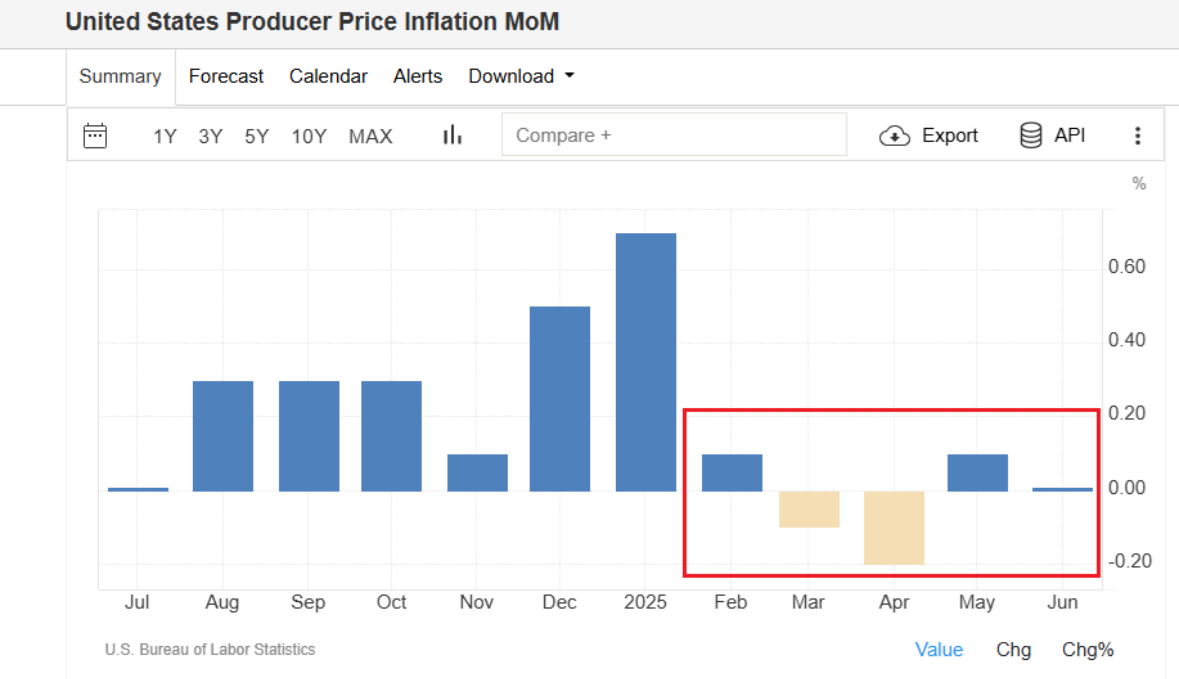
June’s Producer Price Index looks calm, flat at 0.0%.
But beneath the surface, inflation is shifting not vanishing.
(Save this thread)
June’s Producer Price Index looks calm, flat at 0.0%.
But beneath the surface, inflation is shifting not vanishing.
(Save this thread)
The Producer Price Index (PPI) measures what businesses are paid for the goods and services they sell, the prices before they reach you.
Think of it as inflation at the factory, warehouse, or service-provider level.
And in June, it looked dead flat.
Think of it as inflation at the factory, warehouse, or service-provider level.
And in June, it looked dead flat.
But inside that 0.0% lies a split:
• Goods got more expensive: +0.3%.
• Services got cheaper: –0.1%
So while the average stayed still, the parts moved in opposite directions. That’s what makes this month’s PPI so revealing.
• Goods got more expensive: +0.3%.
• Services got cheaper: –0.1%
So while the average stayed still, the parts moved in opposite directions. That’s what makes this month’s PPI so revealing.
This split matters.
Services have driven inflation for the past year. But now, goods inflation is creeping back and it’s the same place inflation started in 2021.
If that continues, it could mean another leg up in consumer prices.
Services have driven inflation for the past year. But now, goods inflation is creeping back and it’s the same place inflation started in 2021.
If that continues, it could mean another leg up in consumer prices.
What’s behind the rise in goods? Gasoline, electricity, poultry, meats, even communication equipment all up.
Final demand energy prices rose 0.6%, while food was up 0.2%.
The most dramatic move? Egg prices crashed 21.8%, volatility is back in food.
Final demand energy prices rose 0.6%, while food was up 0.2%.
The most dramatic move? Egg prices crashed 21.8%, volatility is back in food.
The “core” goods category which strips out food and energy also rose +0.3%, its biggest increase since February.
This is what economists watch most closely.
It’s less noisy, more persistent. And it’s quietly climbing again.
This is what economists watch most closely.
It’s less noisy, more persistent. And it’s quietly climbing again.
Services inflation cooled, largely because of one sector: travel.
Hotel and lodging prices plunged 4.1%, dragging the entire services category down.
Airline fares, deposit services, and retail margins also slipped. But one service jumped: portfolio management fees surged 2.2%.
Hotel and lodging prices plunged 4.1%, dragging the entire services category down.
Airline fares, deposit services, and retail margins also slipped. But one service jumped: portfolio management fees surged 2.2%.
So while the average business isn’t raising prices, there’s a rotation happening.
Goods inflation is heating up. Services inflation is cooling off.
But here’s the problem the “cooling” isn’t broad-based. It’s concentrated in travel and seasonal categories. That makes it fragile.
Goods inflation is heating up. Services inflation is cooling off.
But here’s the problem the “cooling” isn’t broad-based. It’s concentrated in travel and seasonal categories. That makes it fragile.
The core PPI (excluding food, energy, and trade margins) stayed flat in June.
But year-over-year, it’s still running +2.5%.
That’s above the Fed’s 2% target and a sign that sticky inflation pressures haven’t gone away. They’ve just moved.
But year-over-year, it’s still running +2.5%.
That’s above the Fed’s 2% target and a sign that sticky inflation pressures haven’t gone away. They’ve just moved.
To understand where prices are headed next, we have to look deeper into intermediate demand.
That’s the stuff businesses buy from each other: raw materials, freight, components, and services that go into making final goods.
This is the pipeline of inflation.
That’s the stuff businesses buy from each other: raw materials, freight, components, and services that go into making final goods.
This is the pipeline of inflation.
In June, unprocessed goods (like cattle, coal, and gas) rose +0.7%, their biggest jump in five months.
Natural gas alone surged 5.9%, and power prices for utilities jumped 12.1%.
These are input costs and when they rise, they eventually show up downstream.
Natural gas alone surged 5.9%, and power prices for utilities jumped 12.1%.
These are input costs and when they rise, they eventually show up downstream.
Processed goods (like plastics and fertilizer) rose +0.1%, a third straight monthly increase.
Services for intermediate demand (like freight, legal, and financial services) dipped –0.1%, but that’s mainly because deposit services tanked 5.4%.
Services for intermediate demand (like freight, legal, and financial services) dipped –0.1%, but that’s mainly because deposit services tanked 5.4%.
Freight forwarding, though, exploded +8.0% in one month.
That’s a major red flag. Freight costs often lead goods inflation because when it’s expensive to move stuff, the final price tag climbs too.
That’s a major red flag. Freight costs often lead goods inflation because when it’s expensive to move stuff, the final price tag climbs too.
Let’s track how inflation moves through economy using PPI’s 4 production stages
Stage 1: Raw materials
Stage 2: Inputs to processors
Stage 3: Parts & components
Stage 4: Final producers, like retailers and factories
Rising prices early on = inflation coming. Falling prices late = inflation fading
Stage 1: Raw materials
Stage 2: Inputs to processors
Stage 3: Parts & components
Stage 4: Final producers, like retailers and factories
Rising prices early on = inflation coming. Falling prices late = inflation fading
In June:
Stage 1: –0.1%
Stage 2: +0.2%
Stage 3: –0.2%
Stage 4: flat
No consistent direction. Inflation isn’t flowing through smoothly, it’s churning and churn means uncertainty. Pricing power is returning to some sectors, while others are cutting.
Stage 1: –0.1%
Stage 2: +0.2%
Stage 3: –0.2%
Stage 4: flat
No consistent direction. Inflation isn’t flowing through smoothly, it’s churning and churn means uncertainty. Pricing power is returning to some sectors, while others are cutting.
The big takeaway? Inflation isn’t dead, it’s rotating.
We’re moving from a world of services-driven inflation to a more mixed picture where goods, energy, and transportation are starting to reaccelerate.
And that creates a tough dilemma for the Fed.
We’re moving from a world of services-driven inflation to a more mixed picture where goods, energy, and transportation are starting to reaccelerate.
And that creates a tough dilemma for the Fed.
If they look at the 0.0% headline, they might feel confident about holding rates.
But if they look underneath at freight, gas, core goods, they’ll see signs that inflation could reheat.
That’s why this PPI report matters more than it seems.
But if they look underneath at freight, gas, core goods, they’ll see signs that inflation could reheat.
That’s why this PPI report matters more than it seems.
Don’t let the flat headline fool you.
The cost of doing business is rising again and that means consumer prices could follow in the coming months.
Inflation may be quiet but it’s not done.
The cost of doing business is rising again and that means consumer prices could follow in the coming months.
Inflation may be quiet but it’s not done.
If you found these insights valuable: Sign up for my FREE newsletter! thestockmarket.news
I hope you've found this thread helpful.
Follow me @_Investinq for more.
Like/Repost the quote below if you can:
Follow me @_Investinq for more.
Like/Repost the quote below if you can:
https://x.com/_investinq/status/1945474629901910121?s=46
• • •
Missing some Tweet in this thread? You can try to
force a refresh