This is actually happening on Bitcoin
Buckle up.
A thread 🧵
Buckle up.
A thread 🧵

2/ What if I told you there’s 1 macro force that’s appeared before every major move Bitcoin has made over the last decade?
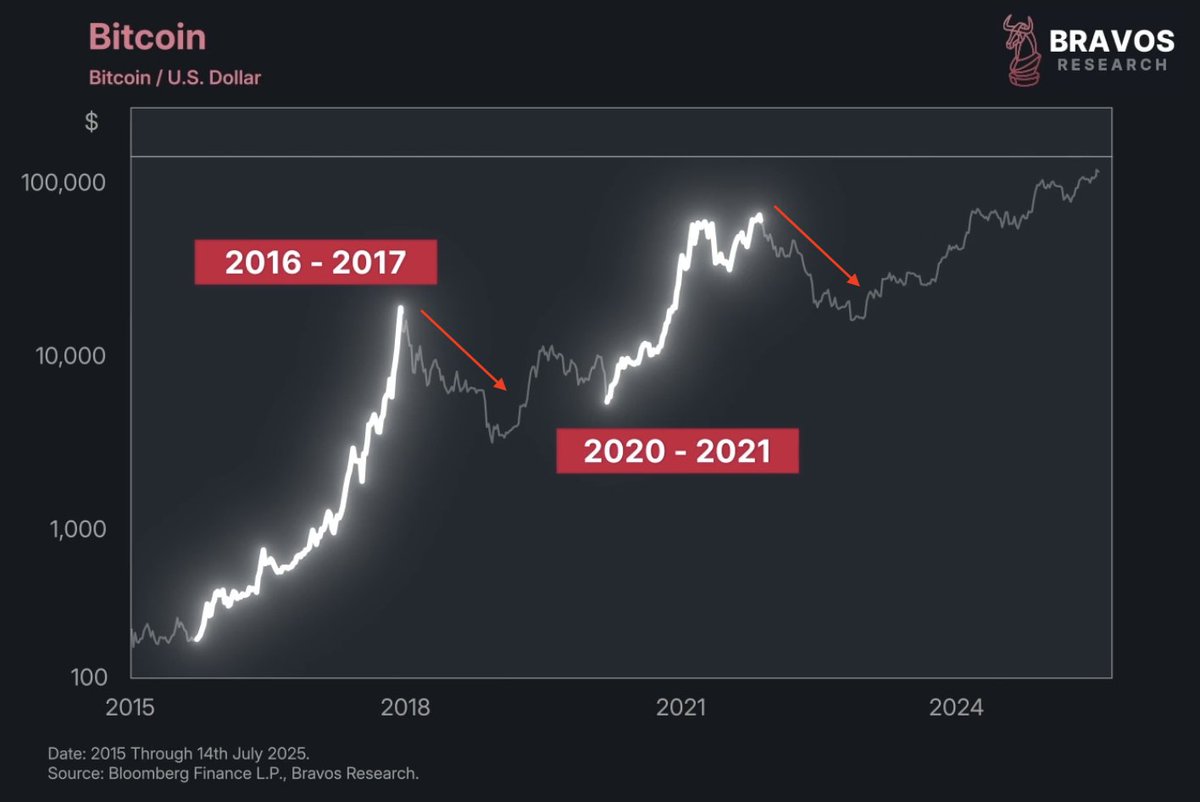
It showed up before Bitcoin’s 5,000% rally in 2016–2017
Before the 1,000% surge in 2020–2021
And right before the 70% crashes in 2018 and 2022
It showed up before Bitcoin’s 5,000% rally in 2016–2017
Before the 1,000% surge in 2020–2021
And right before the 70% crashes in 2018 and 2022
3/ It’s a force every investor knows exists, but very few actually know how to use
It’s called global liquidity
And believe it or not, it’s flashing another major signal right now that could tell us where Bitcoin is headed by August of this year
It’s called global liquidity
And believe it or not, it’s flashing another major signal right now that could tell us where Bitcoin is headed by August of this year

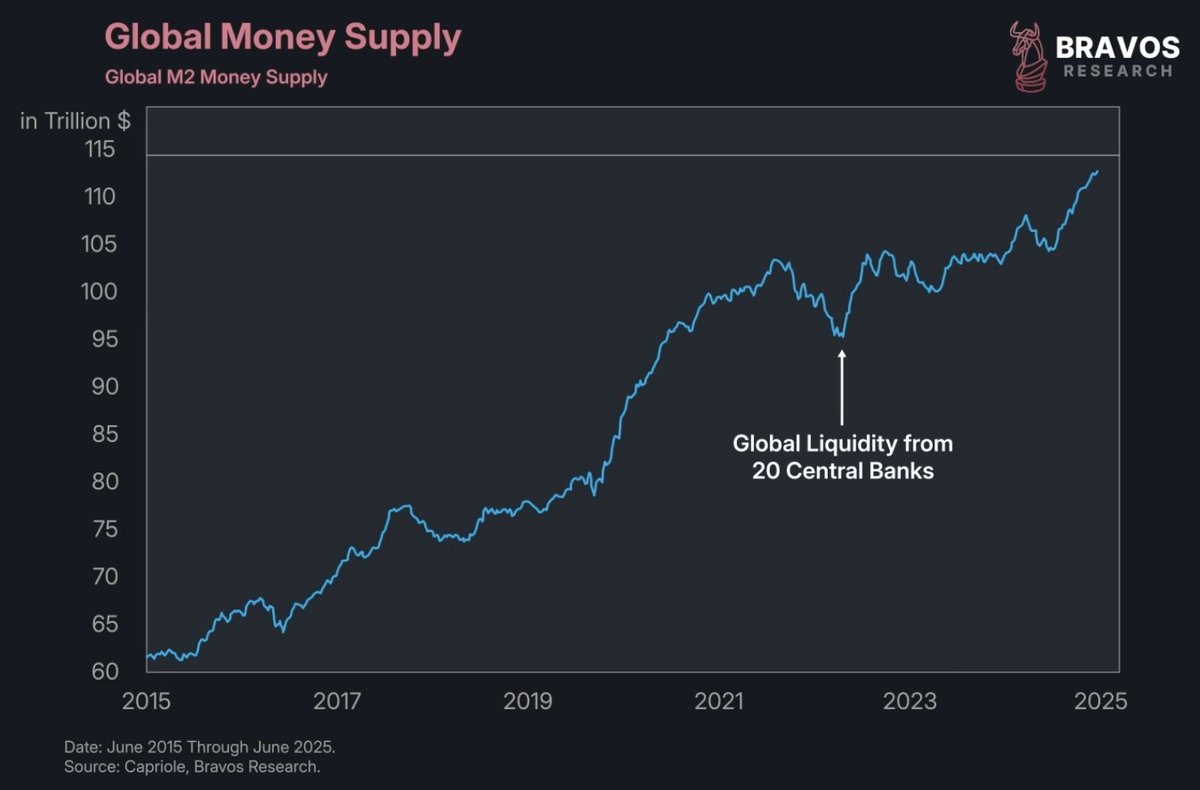
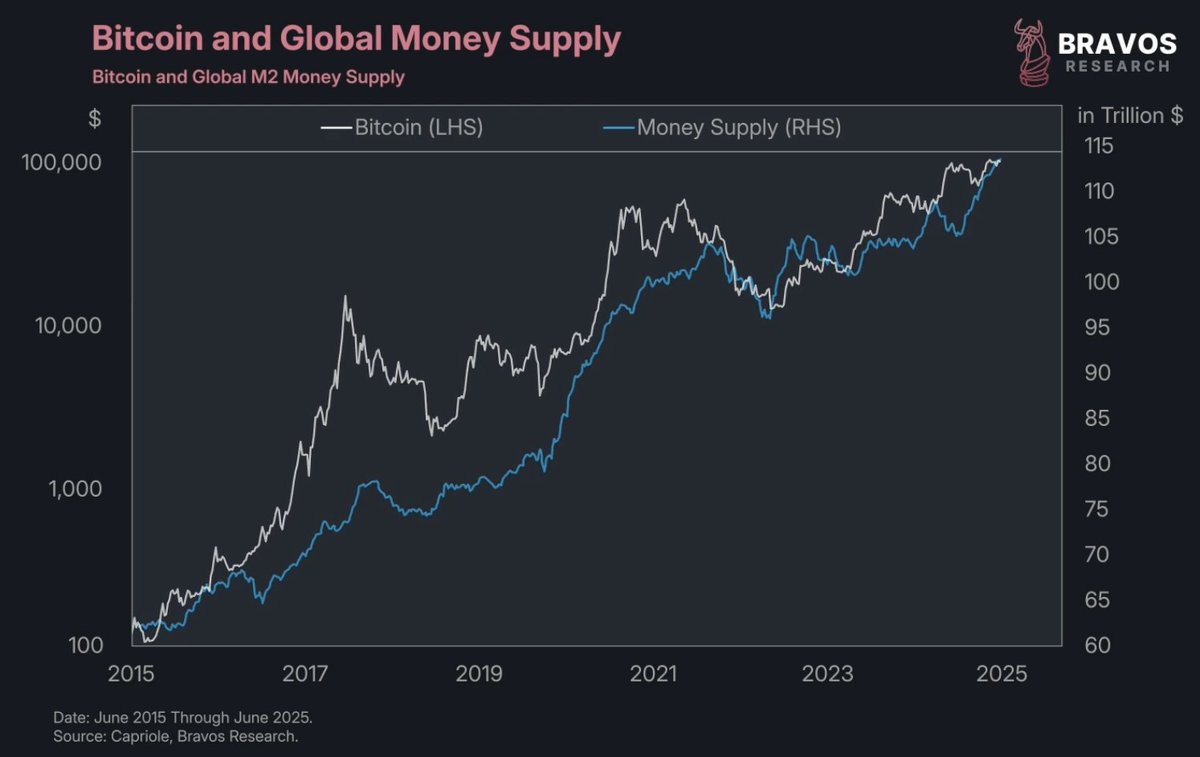
4/ We can track global liquidity using this chart of global M2 money supply
Which reflects the liquidity provided by the world’s 20 largest central banks
Right now, that money supply is breaking out to the highest level ever recorded
Which reflects the liquidity provided by the world’s 20 largest central banks
Right now, that money supply is breaking out to the highest level ever recorded
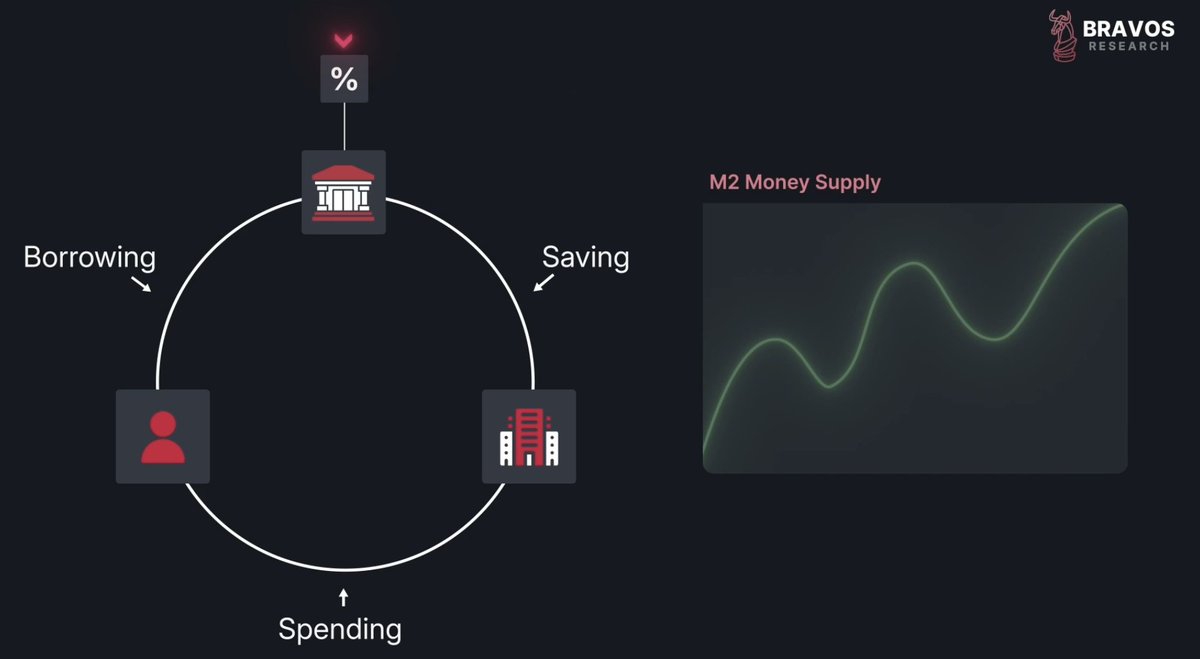
5/ Global liquidity is largely driven by central bank interest rates
When central banks cut rates, borrowing gets cheaper
That leads to more lending and spending
Which pumps more money into the system
Causing M2 money supply to rise
When central banks cut rates, borrowing gets cheaper
That leads to more lending and spending
Which pumps more money into the system
Causing M2 money supply to rise
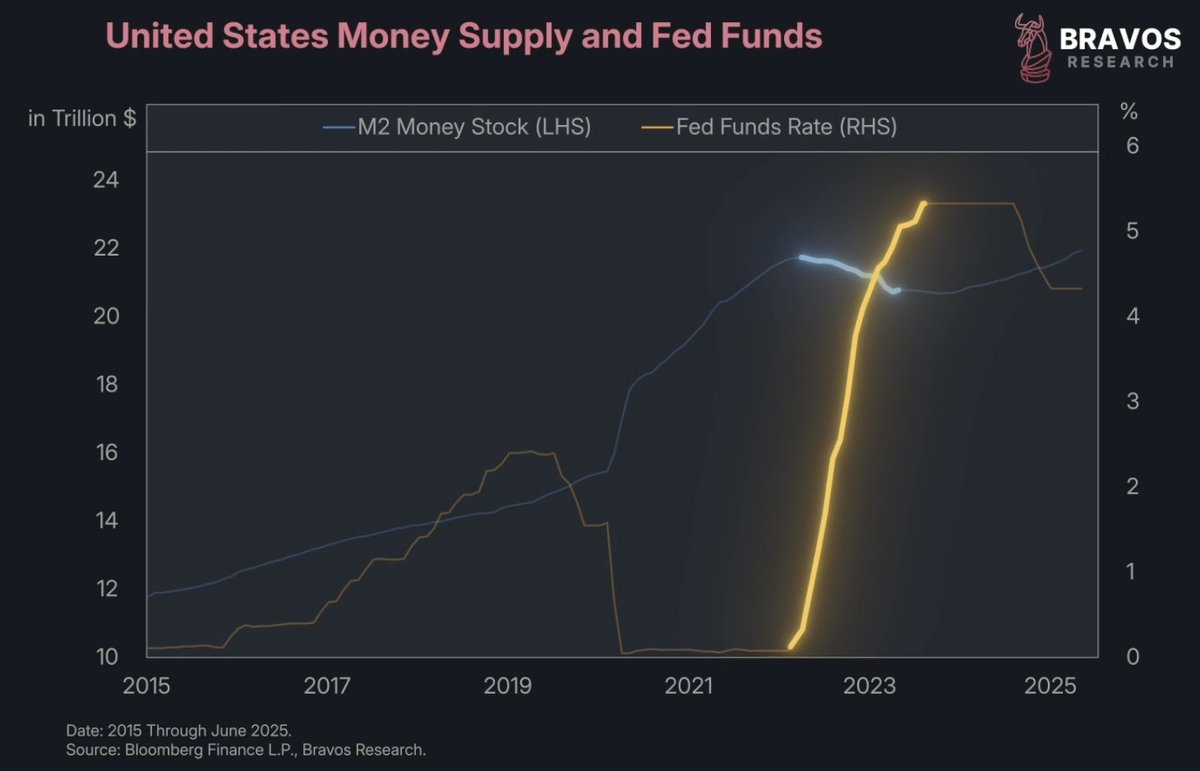
6/ For example, after peaking in 2022, the US money supply started falling
And when we put the Fed Funds Rate on top, we see this decline in money supply coincided with the Fed aggressively raising rates and tightening conditions
And when we put the Fed Funds Rate on top, we see this decline in money supply coincided with the Fed aggressively raising rates and tightening conditions
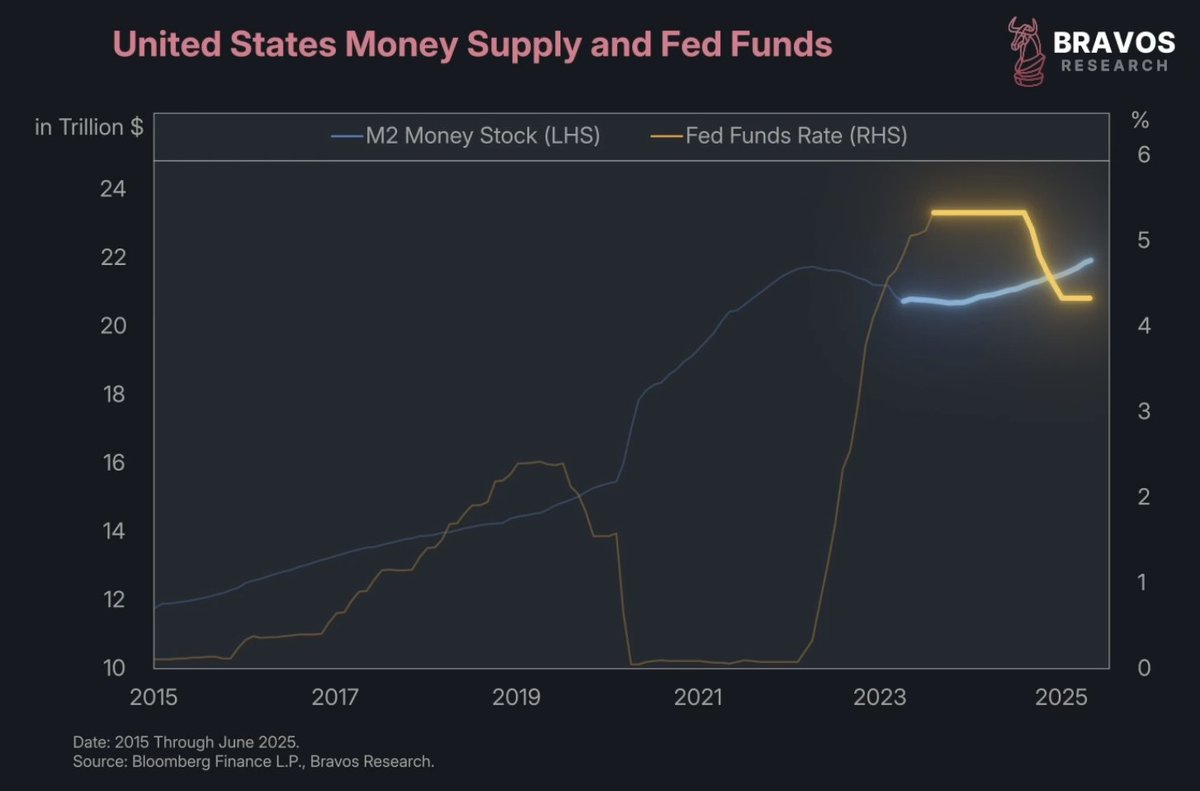
7/ But from Aug 2023 onwards, the Fed paused its hikes and then shifted towards rate cuts
As a result, US money supply began climbing and just hit new highs
This principle applies not just for the US but for central banks around the world
As a result, US money supply began climbing and just hit new highs
This principle applies not just for the US but for central banks around the world
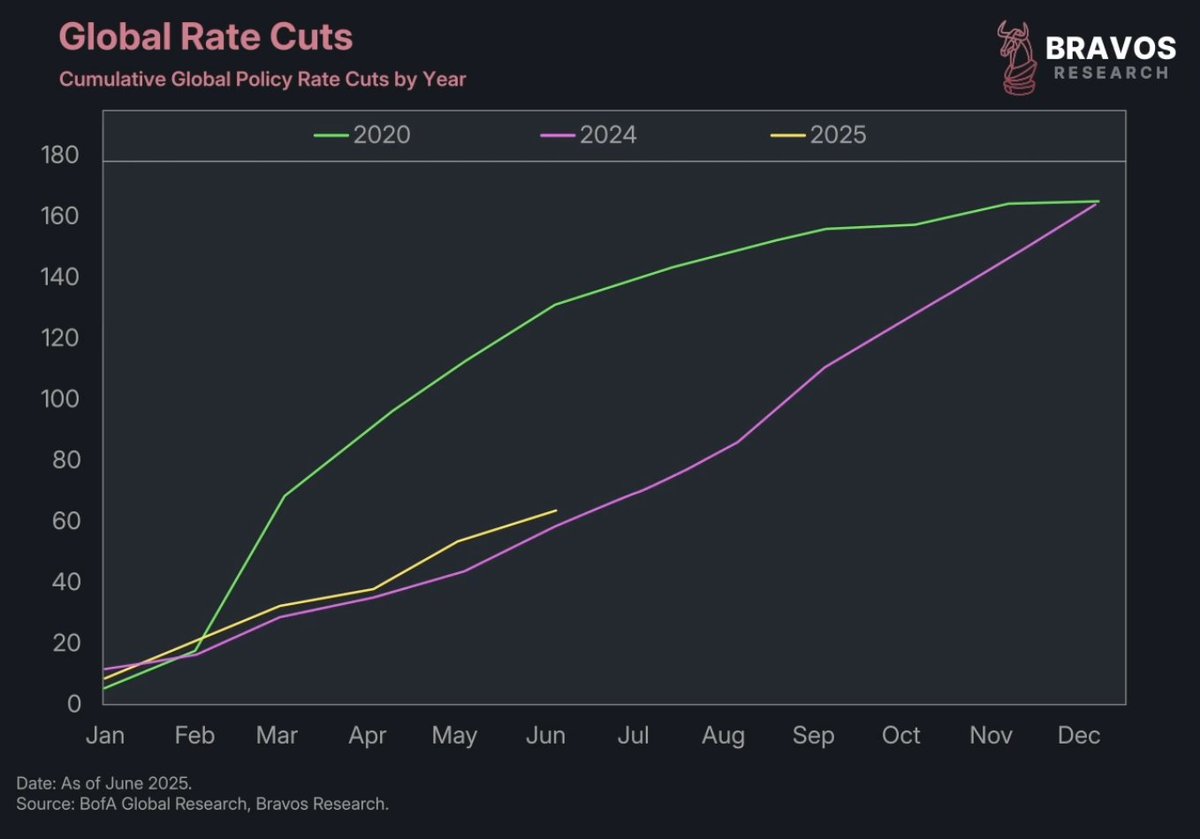
8/ Today, global central banks have cut rates 64 times in the past 6 months
This is an even faster pace than 2024
The last time we saw cuts this aggressive was back in 2020 during the pandemic
So how does this affect Bitcoin?
This is an even faster pace than 2024
The last time we saw cuts this aggressive was back in 2020 during the pandemic
So how does this affect Bitcoin?
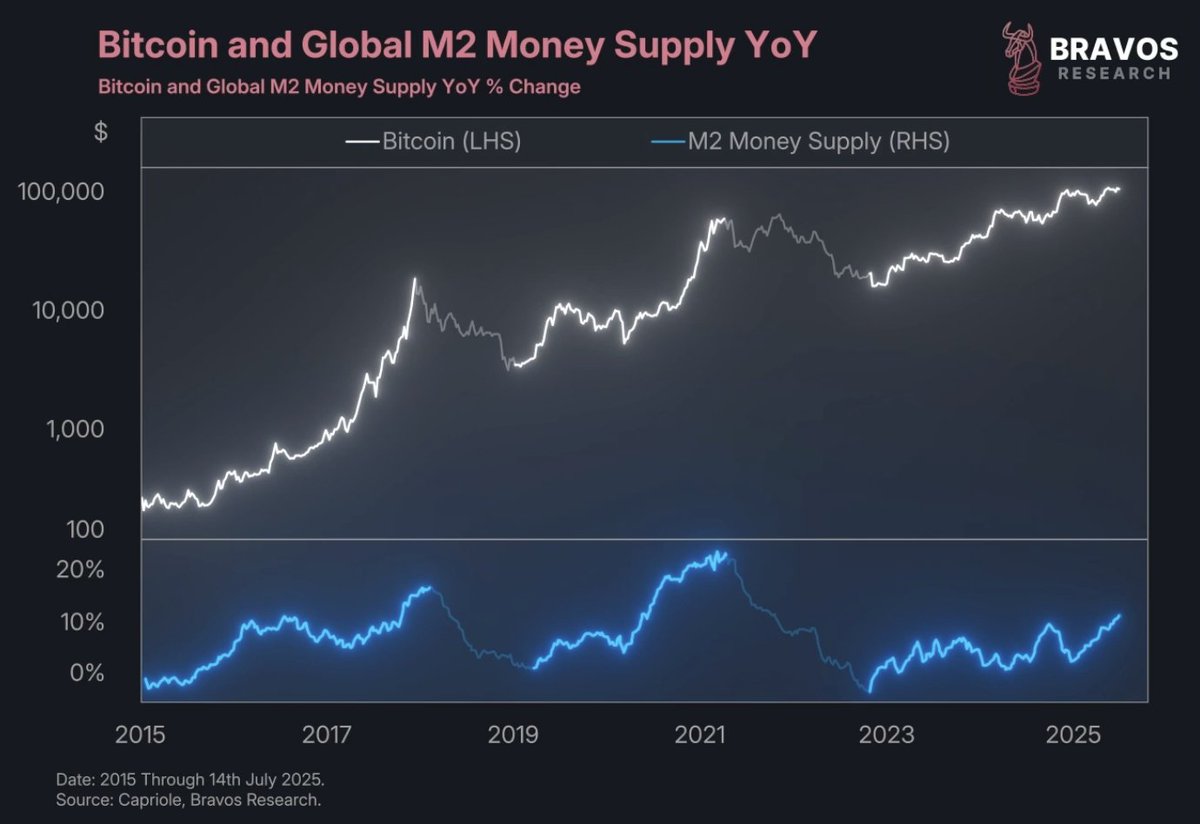
9/ When we put Bitcoin’s price with global money supply, a clear relationship emerges
It’s not a perfect one-to-one, but Bitcoin generally moves in the same direction as global liquidity
It’s not a perfect one-to-one, but Bitcoin generally moves in the same direction as global liquidity
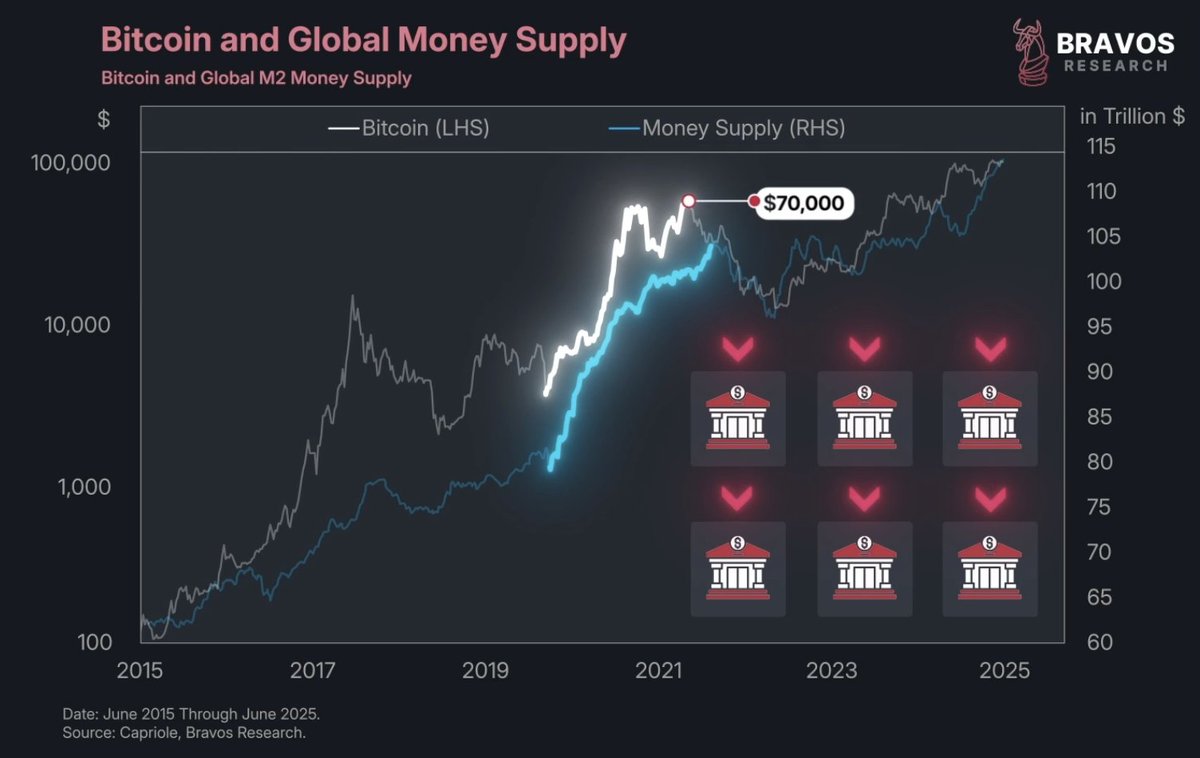
10/ Take 2020, for example
After the pandemic hit, central banks cut rates and money supply exploded
In response, Bitcoin surged from under $5,000 to nearly $70,000 in just 1 year
After the pandemic hit, central banks cut rates and money supply exploded
In response, Bitcoin surged from under $5,000 to nearly $70,000 in just 1 year
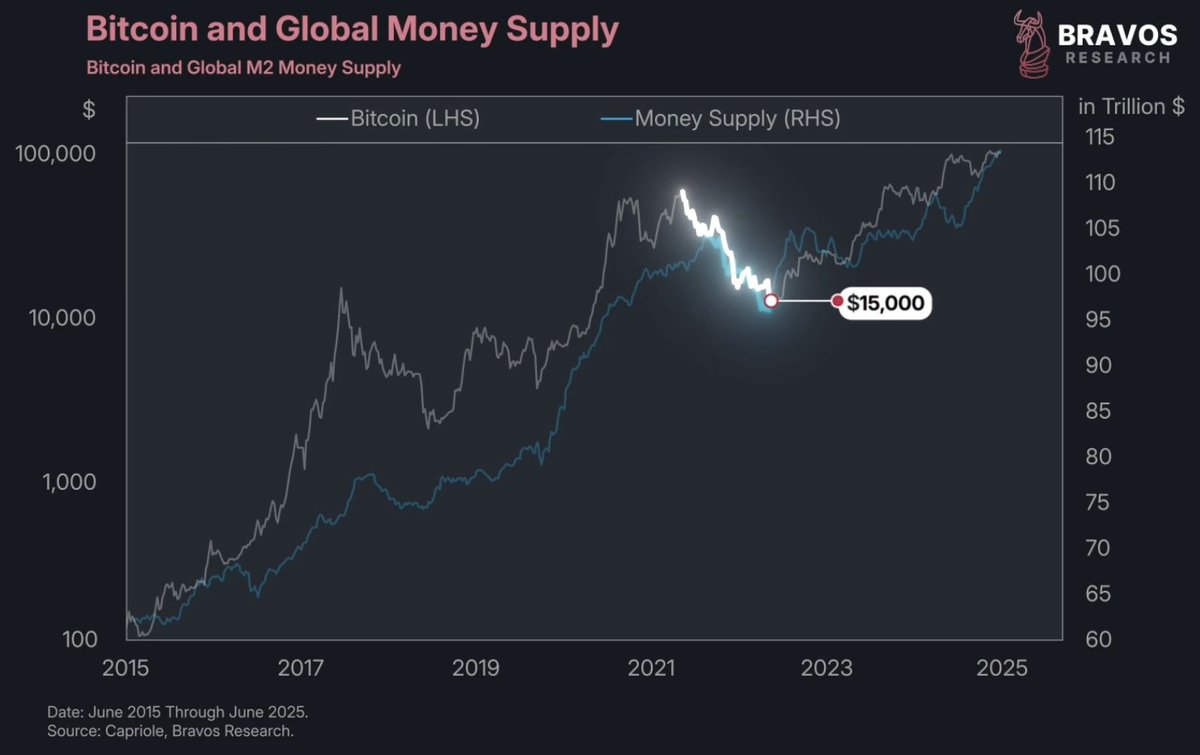
11/ In contrast, 2022 saw liquidity shrink as rate hikes kicked in
And Bitcoin fell from $70,000 to $15,000
So, when liquidity expands, Bitcoin and other risk assets rally
When it contracts, they tend to struggle
And Bitcoin fell from $70,000 to $15,000
So, when liquidity expands, Bitcoin and other risk assets rally
When it contracts, they tend to struggle
12/ These are the type of Crypto insights we regularly use in our strategy at Bravos Research
Access all our Premium Videos, strategy breakdowns, and real-time alerts at:
bit.ly/BravosResearch
Access all our Premium Videos, strategy breakdowns, and real-time alerts at:
bit.ly/BravosResearch
13/ Now, Bitcoin currently has a 0.51 correlation coefficient with global money supply
A correlation coefficient measures how closely the movement of two variables track each other
Hypothetically, a correlation of 1 would mean the two variables are doing exactly the same thing
A 0 correlation would mean no relationship at all
A correlation coefficient measures how closely the movement of two variables track each other
Hypothetically, a correlation of 1 would mean the two variables are doing exactly the same thing
A 0 correlation would mean no relationship at all
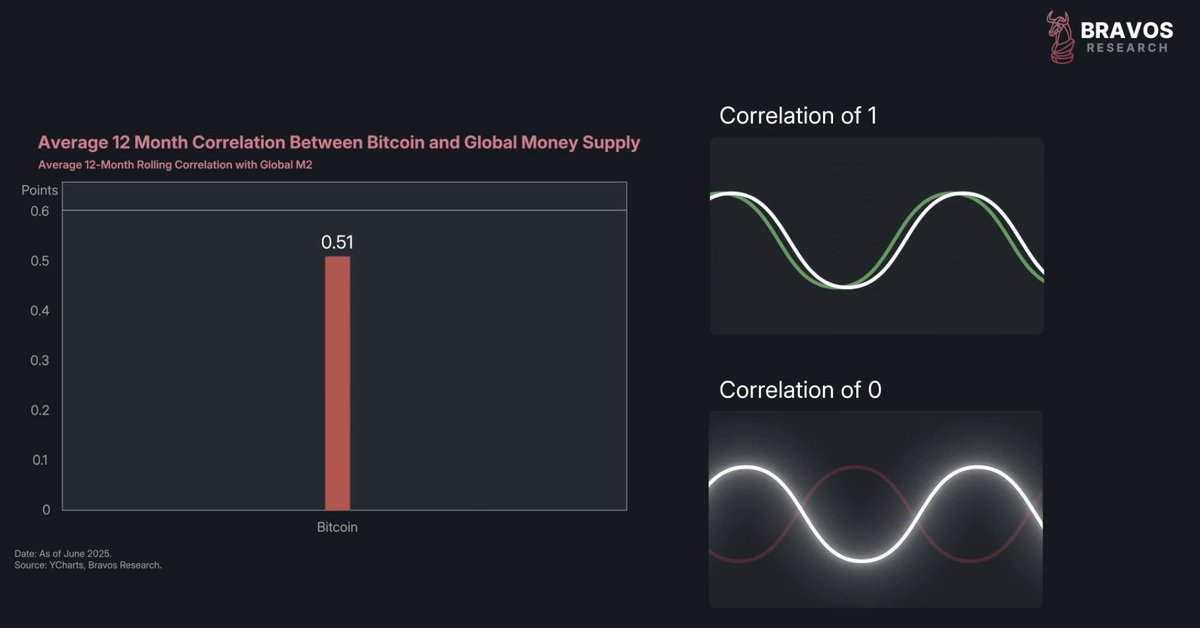
14/ That 0.51 figure is higher than the correlation of global liquidity with gold, the S&P 500, emerging markets, or treasury bonds
It’s not perfect, but it’s a key factor influencing Bitcoin’s price
And there’s a fundamental reason for that
It’s not perfect, but it’s a key factor influencing Bitcoin’s price
And there’s a fundamental reason for that

15/ Bitcoin isn’t tied to earnings, cash flows, or dividends
It performs best when investors are chasing risk and returns
Something they do more of when liquidity is plentiful
It performs best when investors are chasing risk and returns
Something they do more of when liquidity is plentiful
16/ And since Bitcoin is borderless and globally accessible, it reacts not just to US liquidity
But to capital flows from around the world
That makes it more sensitive to global liquidity than most traditional assets
But to capital flows from around the world
That makes it more sensitive to global liquidity than most traditional assets
17/ So how much of an impact could this have today?
Well, so far we’ve only talked about the absolute level of global M2 money supply
But what markets really respond to is the rate of change - how fast liquidity is rising or falling
Well, so far we’ve only talked about the absolute level of global M2 money supply
But what markets really respond to is the rate of change - how fast liquidity is rising or falling
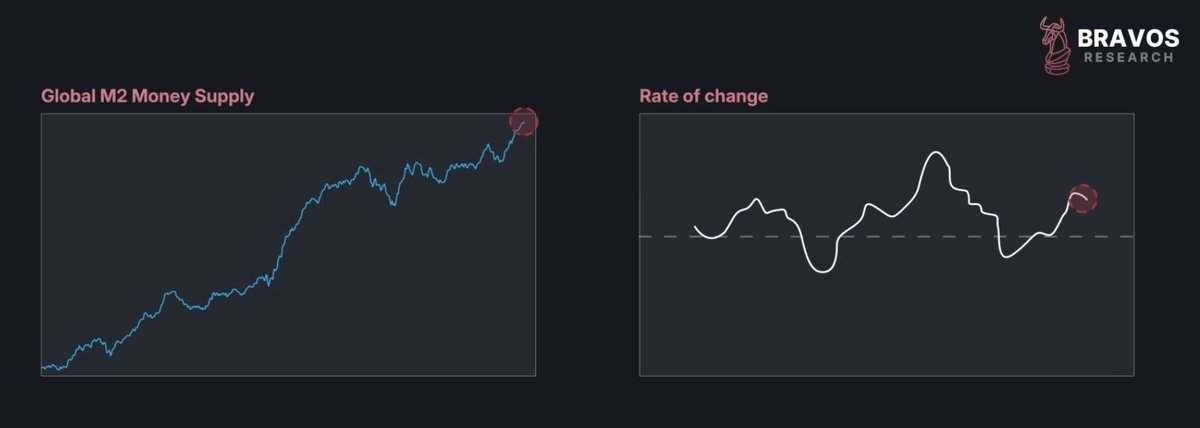
18/ That’s because investors don't just react to current conditions, they adjust their positioning based on how quickly those conditions are likely to change
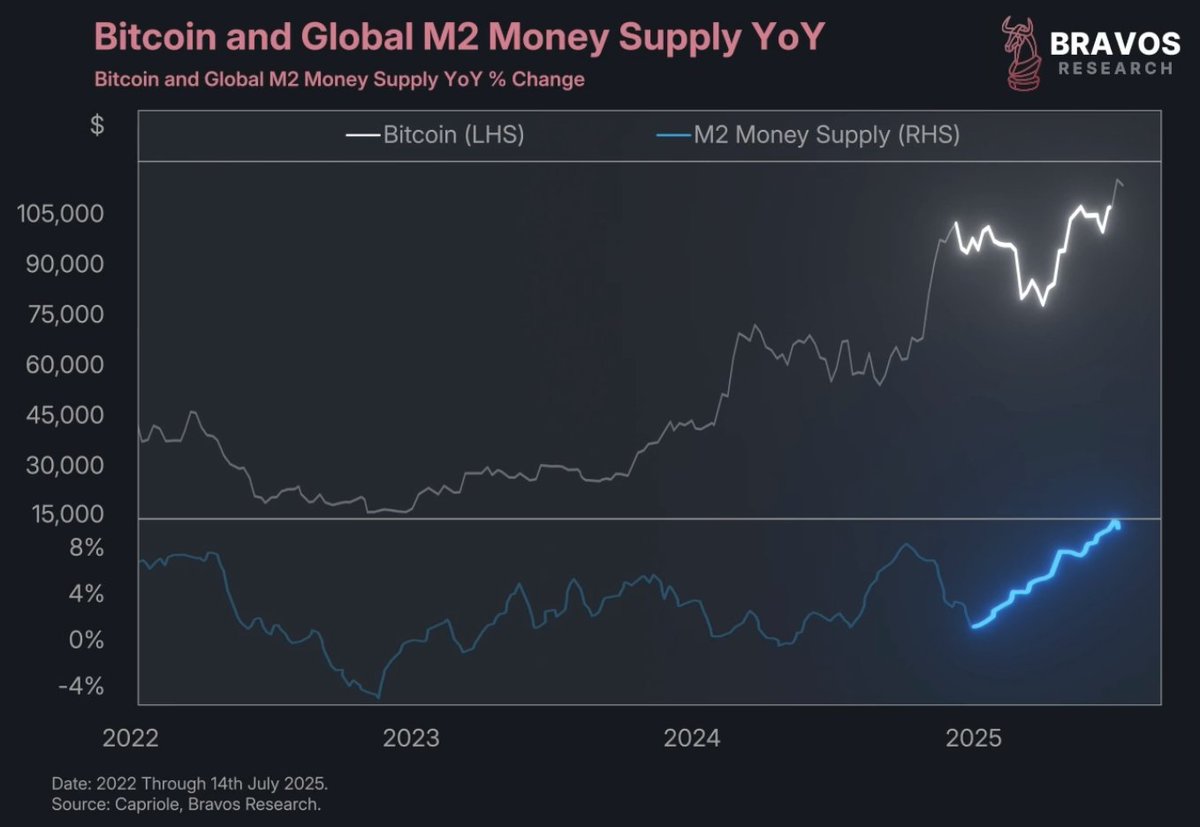
This chart shows the year-over-year change in global liquidity
This chart shows the year-over-year change in global liquidity
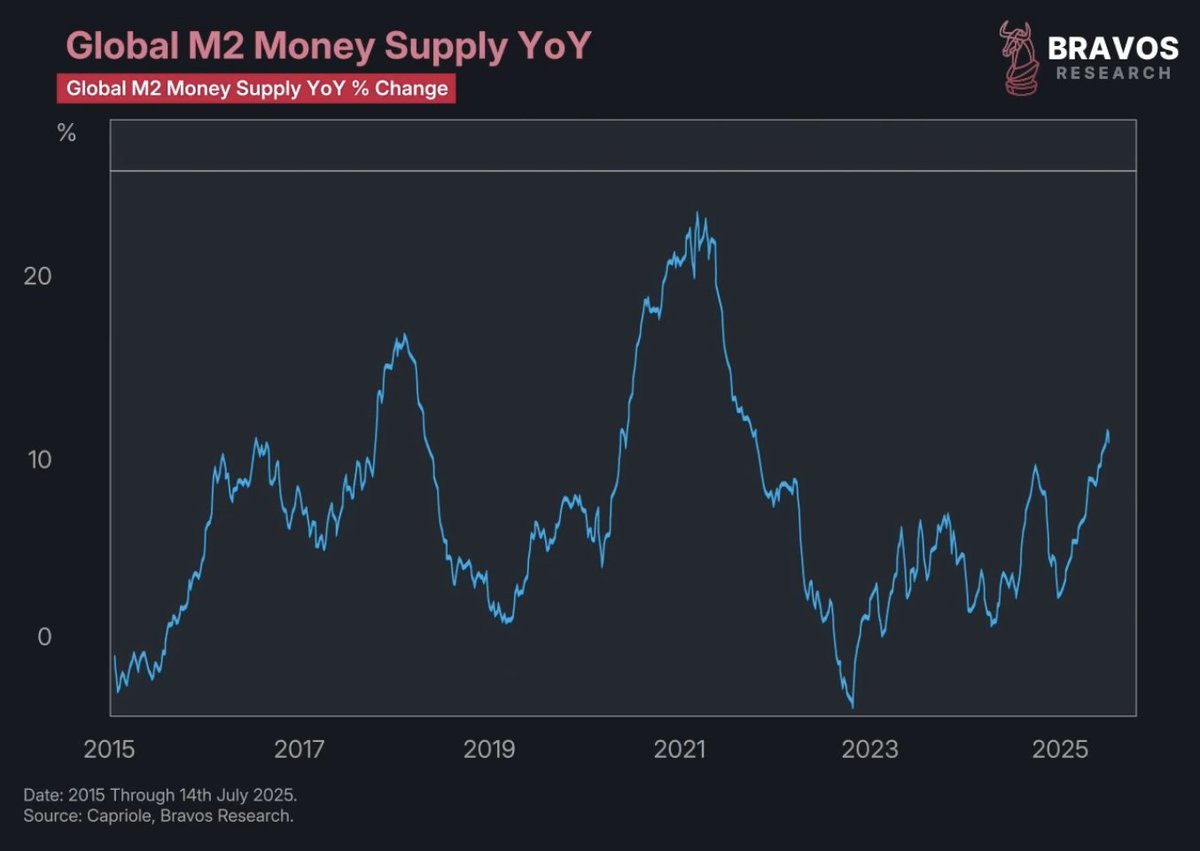
19/ When this chart is rising, it means liquidity is expanding
And those periods tend to align with some of the strongest Bitcoin rallies historically
And those periods tend to align with some of the strongest Bitcoin rallies historically
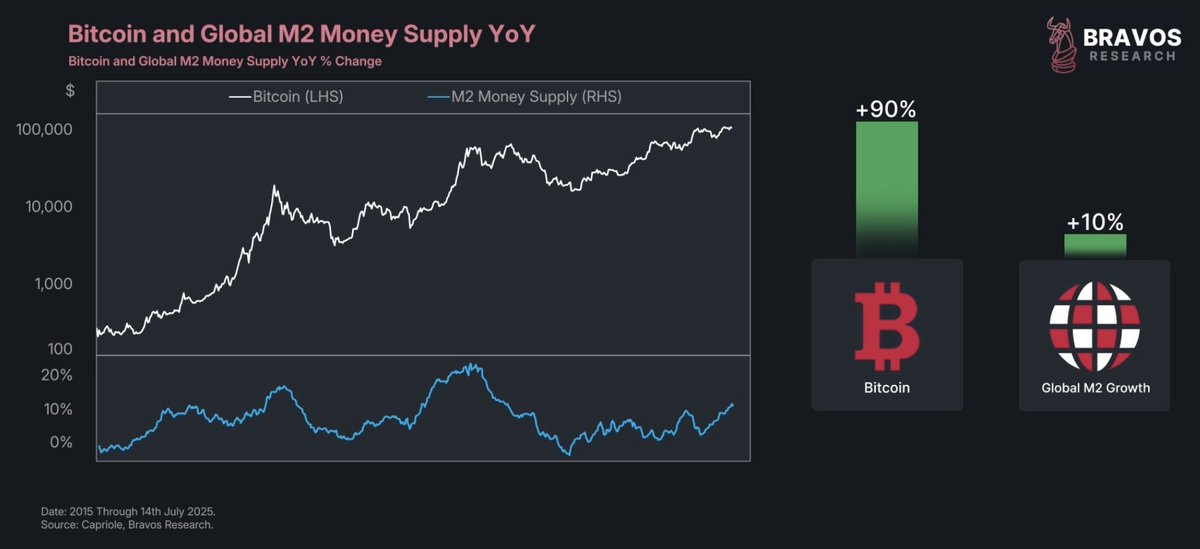
20/ Research shows Bitcoin has an 8.95 sensitivity to changes in global liquidity
That means a 10% rise in global M2 has historically led to a 90% gain in Bitcoin
That extreme sensitivity explains why Bitcoin booms when liquidity rises
And experiences very tough bear markets when global capital tightens
That means a 10% rise in global M2 has historically led to a 90% gain in Bitcoin
That extreme sensitivity explains why Bitcoin booms when liquidity rises
And experiences very tough bear markets when global capital tightens
21/ We’ve used this to our advantage multiple times at Bravos Research
Securing 14%, 30%, and even 39% on different Bitcoin trades in the past year
Get real-time crypto Trade Alerts at:
bit.ly/BravosResearch
Securing 14%, 30%, and even 39% on different Bitcoin trades in the past year
Get real-time crypto Trade Alerts at:
bit.ly/BravosResearch
22/ Zooming in, global liquidity has been steadily expanding in recent weeks
At first, Bitcoin didn’t react and stagnated near its all-time highs
That gave us a window to take another position at Bravos Research
Since then, Bitcoin has started to break out
And we believe this is just the beginning
At first, Bitcoin didn’t react and stagnated near its all-time highs
That gave us a window to take another position at Bravos Research
Since then, Bitcoin has started to break out
And we believe this is just the beginning
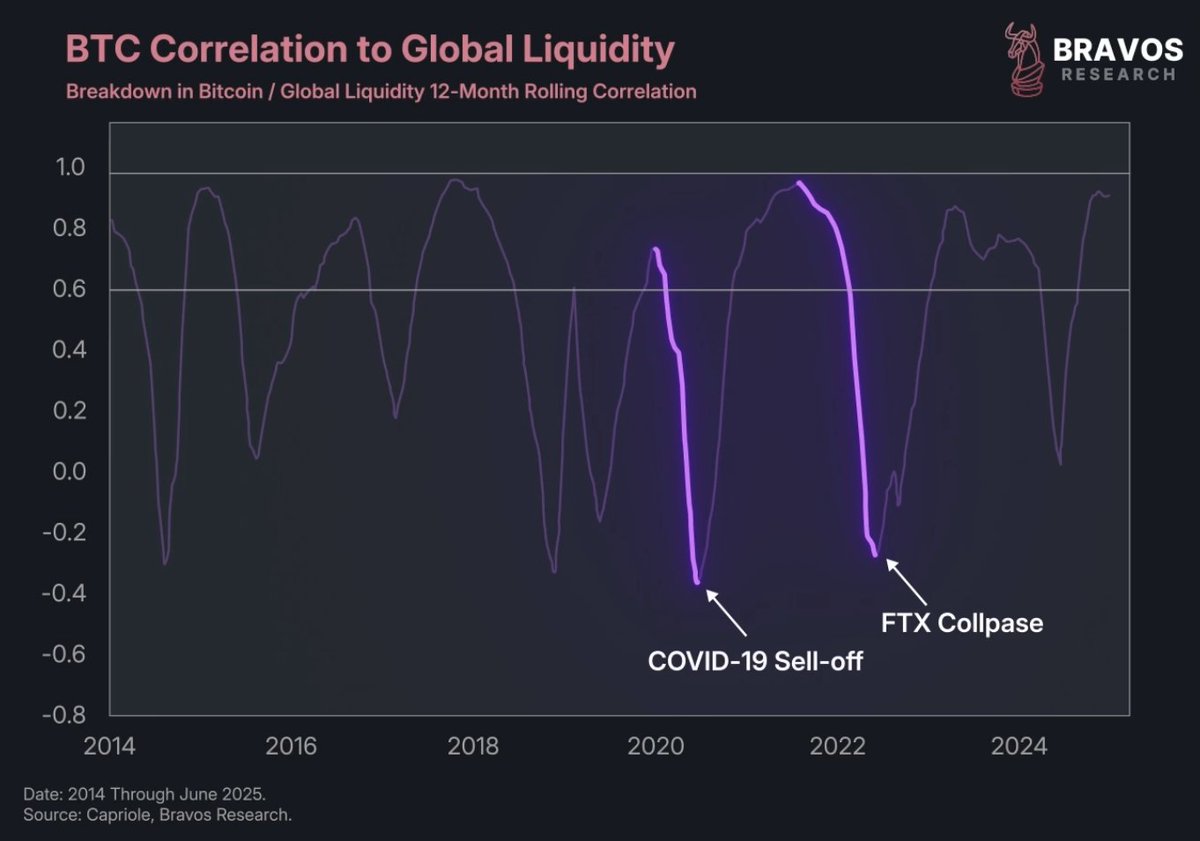
23/ Now, there have been moments when the Bitcoin–liquidity link broke down
Like during Covid-19 or the FTX collapse
In those cases, the correlation briefly turned negative and Bitcoin moved opposite to liquidity
Like during Covid-19 or the FTX collapse
In those cases, the correlation briefly turned negative and Bitcoin moved opposite to liquidity
24/ That’s the main risk to this trade: that some new event breaks the correlation again, sending Bitcoin lower despite rising liquidity
But, if the relationship holds then what kind of move should we expect?
But, if the relationship holds then what kind of move should we expect?
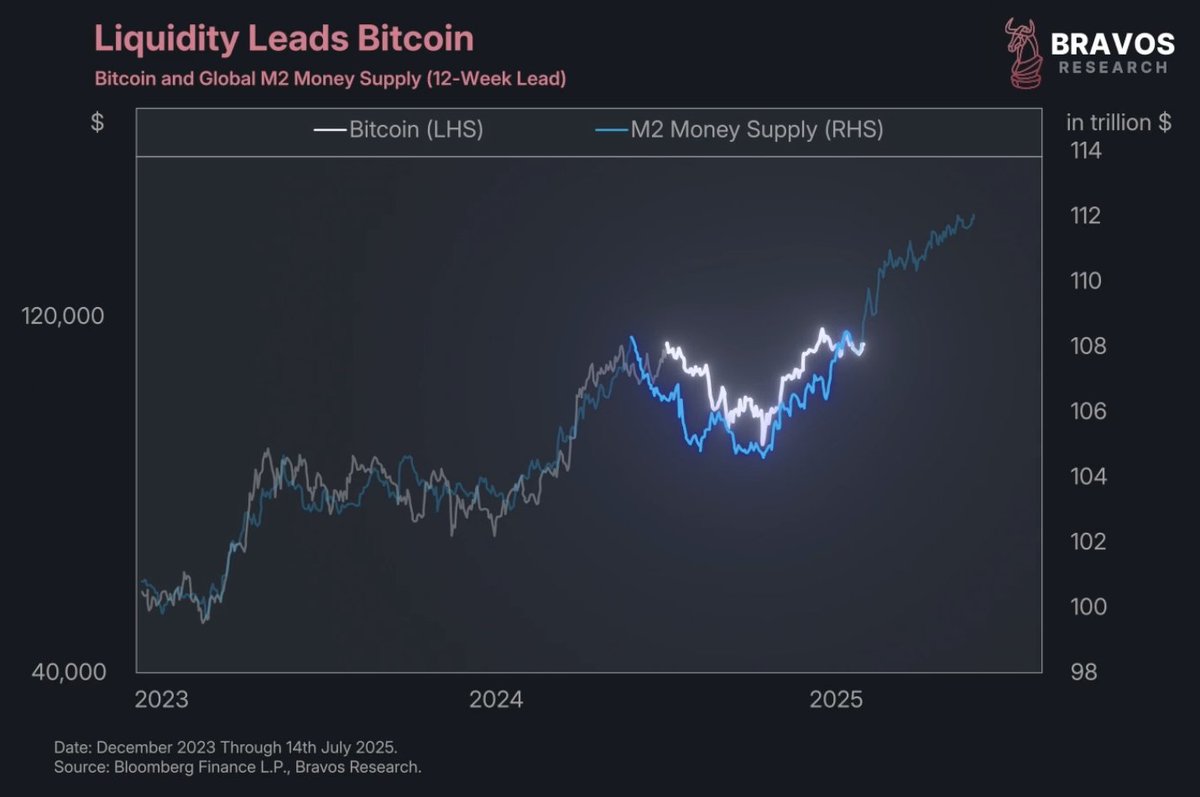
25/ When we plot Bitcoin’s price against global liquidity and shift the liquidity line forward by 3 months, a pattern emerges
Bitcoin doesn’t just follow liquidity, it follows with a lag
Bitcoin doesn’t just follow liquidity, it follows with a lag
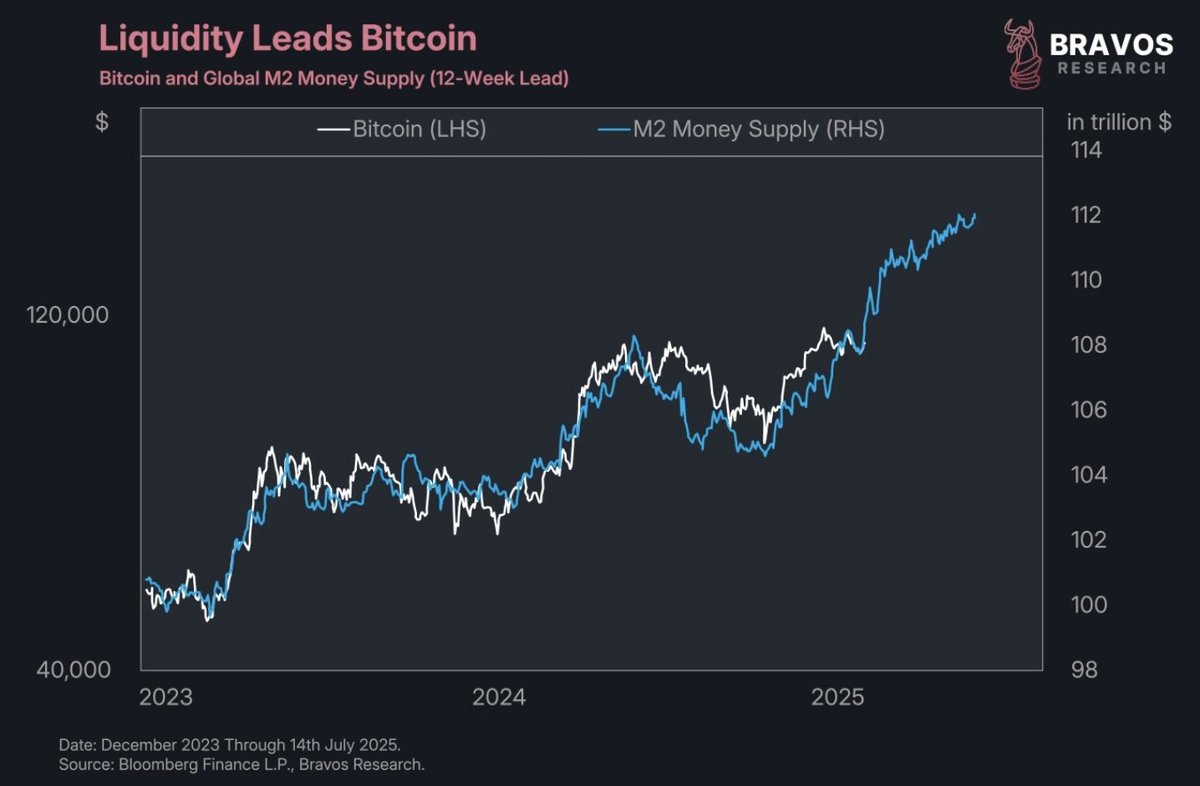
26/ We first pointed this out in April when Bitcoin was around $80,000
And many were calling for a bear market
But global liquidity told us Bitcoin would bottom and rally
And that’s exactly what happened
And many were calling for a bear market
But global liquidity told us Bitcoin would bottom and rally
And that’s exactly what happened
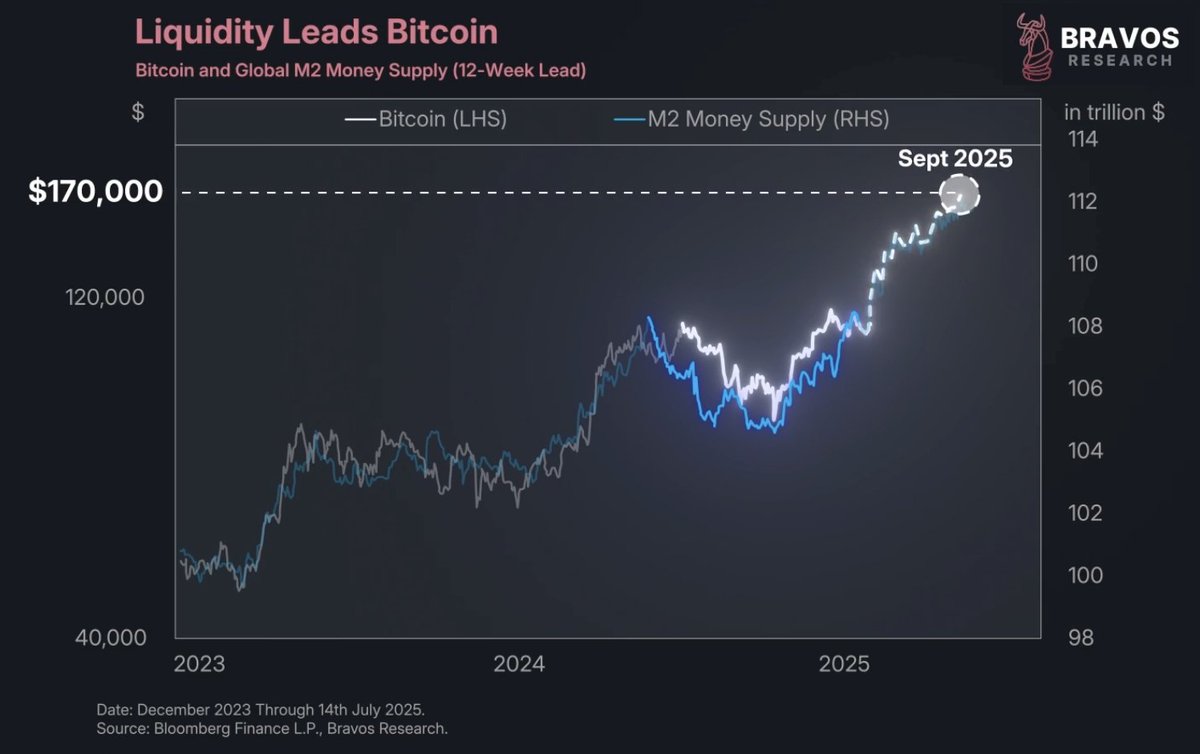
27/ If the relationship continues to hold, global liquidity is signaling that Bitcoin could rally to $170,000 by September 2025
Keep in mind though, the correlation between Bitcoin and liquidity is 0.51, not 1
So this isn’t an exact forecast
Keep in mind though, the correlation between Bitcoin and liquidity is 0.51, not 1
So this isn’t an exact forecast
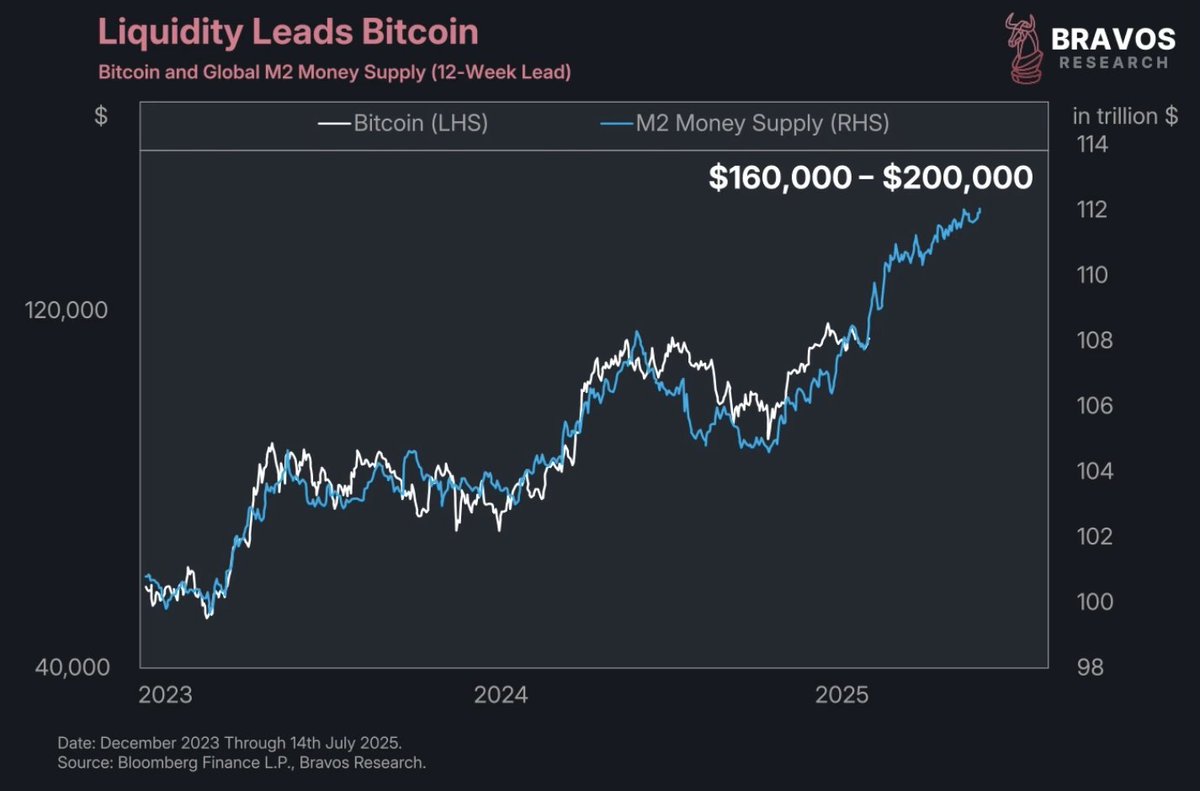
28/ That’s why we use a range-based target: $160,000 to $200,000 by year-end
Depending on how strong the broader crypto market gets
Depending on how strong the broader crypto market gets
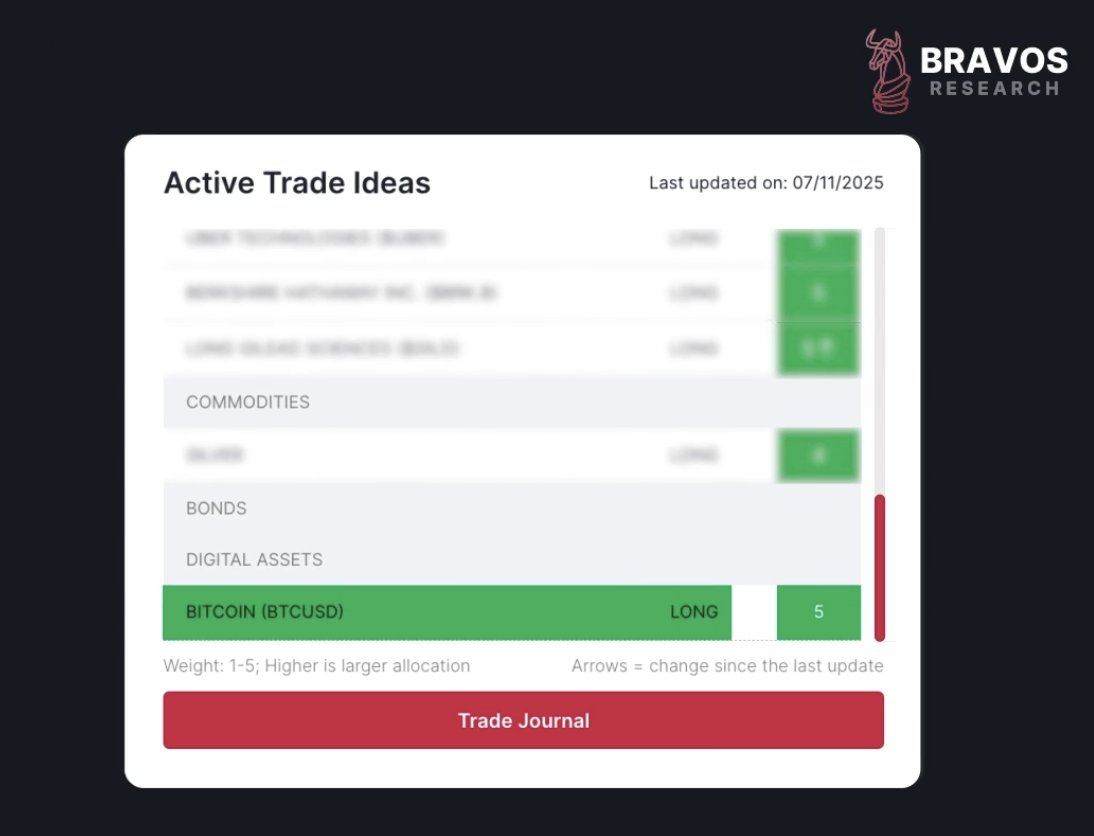
29/ This outlook is why we currently hold an active Bitcoin position on our site
We haven’t yet deployed capital into other crypto assets
But we’re watching closely and will consider new trades once we get further confirmation of a breakout across the crypto market
We haven’t yet deployed capital into other crypto assets
But we’re watching closely and will consider new trades once we get further confirmation of a breakout across the crypto market
30/ In 2024, our crypto trades delivered standout returns:
30% on Bitcoin, 63% on Solana, and 83% on Ethereum
And most of our losing trades were capped at under 5%
Get real-time Trade Alerts at:
bit.ly/BravosResearch
30% on Bitcoin, 63% on Solana, and 83% on Ethereum
And most of our losing trades were capped at under 5%
Get real-time Trade Alerts at:
bit.ly/BravosResearch
31/ Thanks for reading!
If you enjoyed this thread, please ❤️ and 🔁 the first tweet below
And follow @bravosresearch for more market insights, finance and investment strategies
If you enjoyed this thread, please ❤️ and 🔁 the first tweet below
And follow @bravosresearch for more market insights, finance and investment strategies
https://x.com/bravosresearch/status/1945509117386522945
• • •
Missing some Tweet in this thread? You can try to
force a refresh