TSMC 2Q25; Beats the high-end of rev guidance, despite FX impact, GM close to high-end of the guidance and OPM > high-end guidance.
2Q25 vs 2Q24
Revenue: $30.070B (+44%)
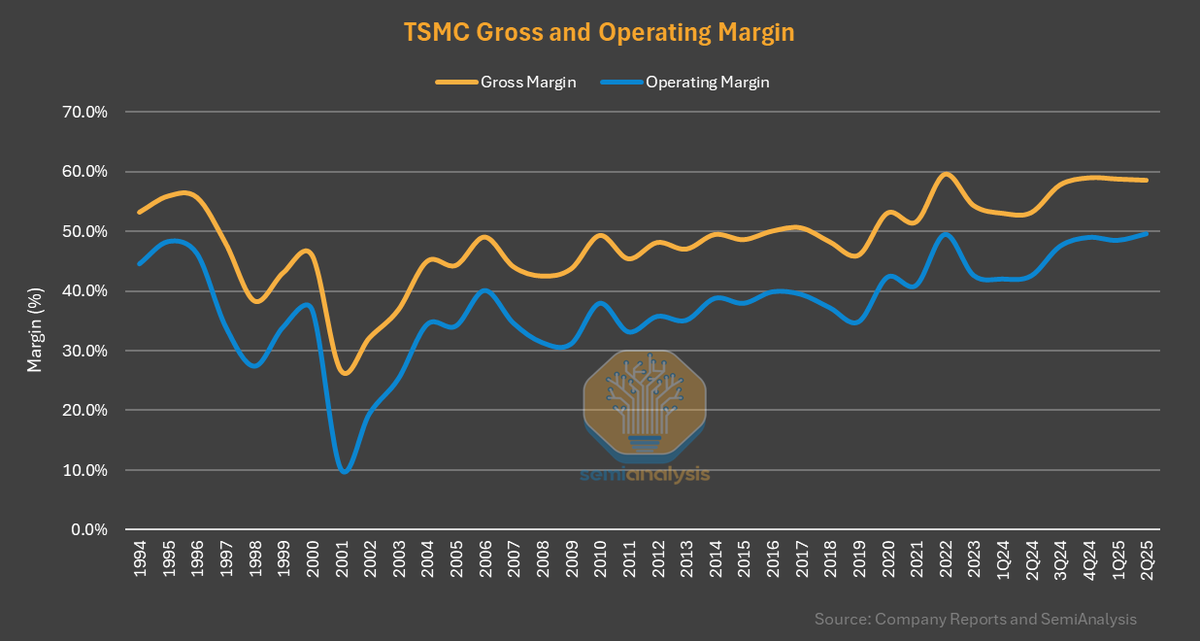
Gross Margin: 58.6% (53.2%)
Operating Margin: 49.6% (42.5%)
CapEx: $9.6B (+51%)
Wafer Shipments: 3.718 m (+19%)
Wafer ASP: $7027 (+21%)
Advanced node revenue (N7 and below) up 19% q/q and 59% y/y to $19.3B. N3: +29% q/q; N5:+18%; N7: +10%. Android drove N3 despite Apple seasonality.
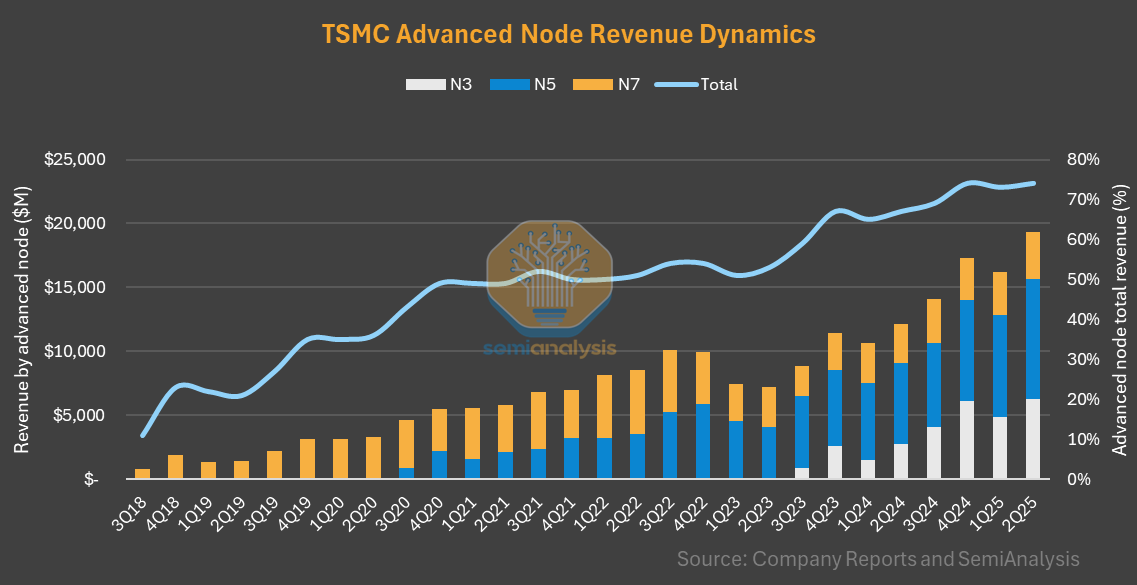
All end markets up. HPC drove $3B incremental rev while smartphone drove almost $1B. HPC drove 67% of incremental rev and up 20% q/q and 67% y/y. Auto all-time-high for the 2nd straight quarter.
Gross margin strength (58.6%) continued despite FX headwind. Pricing power, utilization, and better cost structure likely helped. Multiple headwinds. N3 dilution, N2 ramp, overseas fabs, inflationary costs, utility rate hikes etc.
Higher utilization is clearly visible in big jump wafer shipments. Boosted GM.
3Q GM to be affected by FX and more pronounced overseas fabs. Dilution due to overseas fabs: next 5 year 2-3 percentage points (early yrs) and in the later period 3-4 percentage points.
All of TSMC revenue and 75% of COGS denominated in USD. 100% sensitivity between NTD and USD. 1% FX affects 0.4% GM.
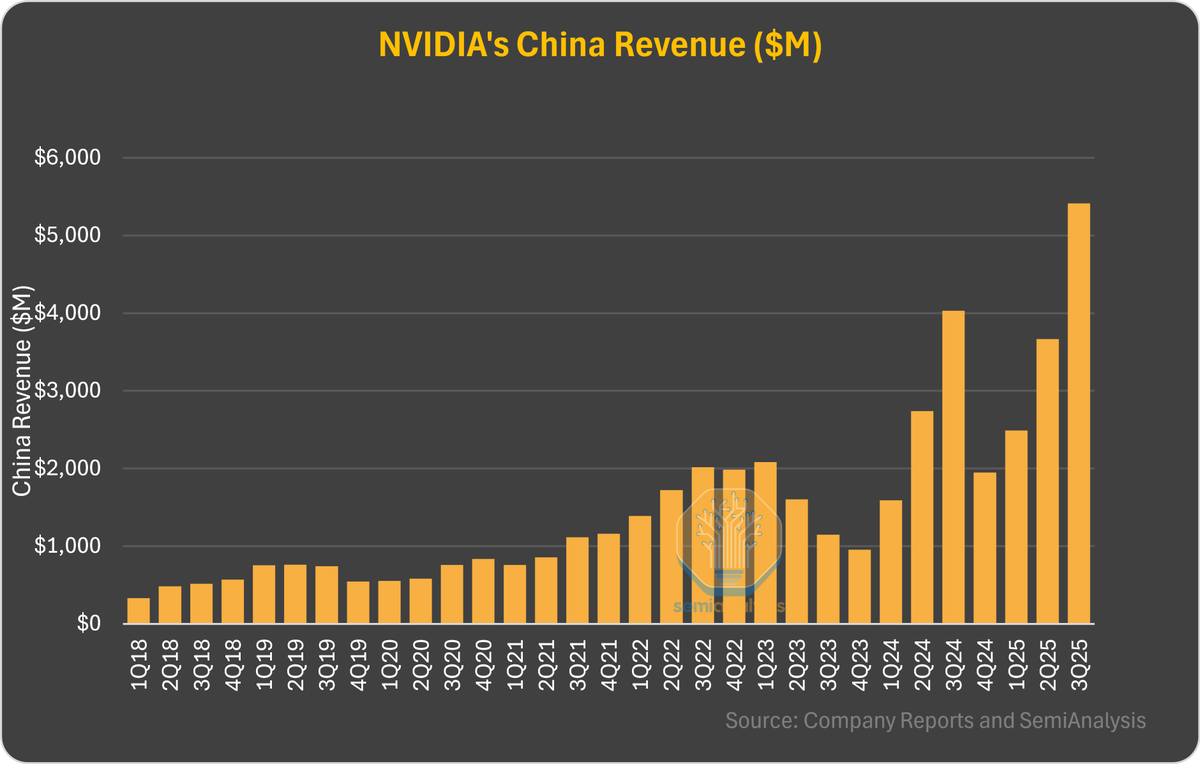
No change in customer behavior so far. China subsidies short-term upside to demand. Raises 2025 guidance to 30% from earlier mid-20s %.
Arizona mass production started in 4Q24 on N4 with yields comparable to Taiwan fabs. 2nd fab (N3/N2) will be advanced by multiple quarters (original schedule in 2028). Fab 3 will also likely be expedited.
Reiterates 30% of 2nm capacity will be Arizona (after the completion of 6 fab cluster).
European fab ESMC ramp schedule will be based on customers' need and market conditions. 11 wafer fabs and 4 advanced packaging facility in Taiwan over the next few years.
N2 on track. N2 tape-outs to outnumber N5 and N3 in the same period in the first 2 years. HVM in 2H25. N2P in 2H26. A16 dedicated to HPC (7-10% density gain vs N2P).
A14 HVM in 2028 and backside power version of A14 in 2029.
Strong demand from DC AI. Smartphone/PC AI chip die sizes are increasing by 5-10%.
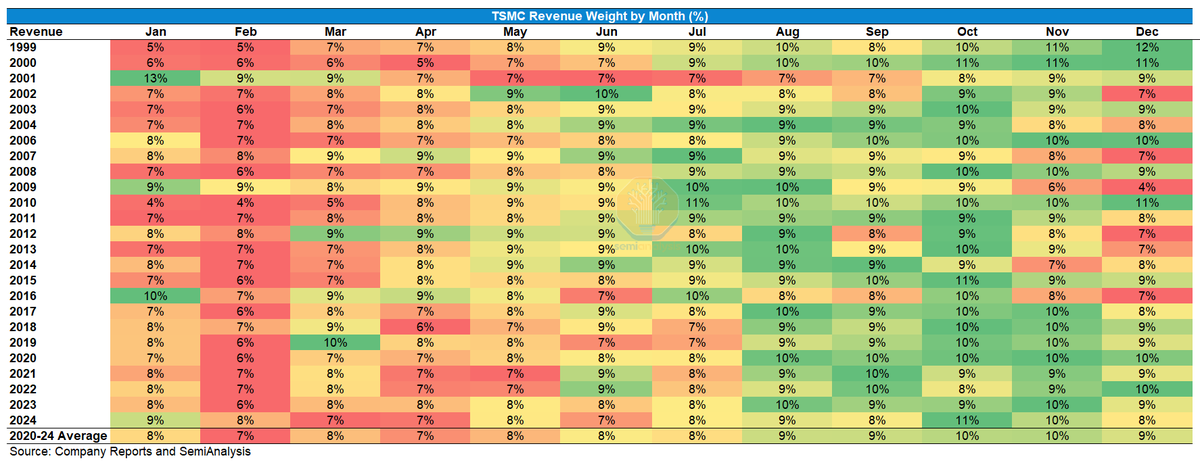
Implied 4Q revenue will decline 10% q/q but up 8% y/y. 2nd time in the last 10 years. In 2022, 4Q revenue declined q/q.
53% gross margin and higher target still intact. Not yet ready to increase forecast due to H20 comeback.
N2 ramp profile will be similar to N3. N2 constrained by capacity. Revenue contribution will be bigger vs N3 due to higher pricing.
N5 capacity tight and N3 even tighter. 85-90% toll commonality between leading-nodes. N7 capacity is used to support N5 demand. Also, converting N5 to N3. Will continue to do so.
1% efficiency gains due to AI means $1B for TSMC. Talked about this in previous earnings calls.
N2 profitability is better than N3. It took N3 10-12 quarters vs 8-10 quarters before. Sees N2 going back to old days.
Sees it is unlikely Capex dollars dropping by a big amount any given year given TSMC's size.
• • •
Missing some Tweet in this thread? You can try to
force a refresh
TSMC monthly revenue trend observations.
- October is the greenest and Feb is the reddest when it comes to monthly revenue weights
- Aug to Dec above average in terms of revenue weight while Feb to May below average
- 45/55 split between 1H/2H (last 5 yr average)
- In terms of month on month growth, March and August often see strong DD % growth
- December inevitably sees MSD% m/m decline despite as shipments cool off
- In the last 5 years, on ana average January saw 9% month on month growth
2Q is the reddest quarter. While 3Q is the greenest. Some anomalies exist like 2009-14 when Q2 was the greenest.
NVIDIA's forward days of inventory stand at 69 days (healthy) by the end of 3QFY25, meaning it can flush the current inventory on hand quickly (no surprise). Its outstanding inventory purchase & long-term supply obligations inched up again to $29B. This is where HBM procurement sits. Prepaid supply & capacity agreements stood at $5.2B. Multi-yr cloud service agreements grew 15% q/q to $11.3B.
DC revenue grew q/q for every single quarter since 1QFY15 (except for 3 quarters). Networking is down this quarter but will be up next quarter.
China revenue hit a record high (+48% q/q & +34% y/y). +34% vs previous peak.
Qualcomm 1QCY23
- Revenue down -2 % q/q and -17% y/y to $9.2b (closer to the high-end of the guidance)
- QCT (semiconductor) revenue up 0.6% q/q and down -17% y/y;
-Premium Android, Apple pre-purchases drive handset growth $QCOM
- 6th straight quarter of double-digit y/y growth for auto
- Inventory issues continued in handset & IoT
- QCT EBT takes a hit again but came in at the high end of the guidance
- Android and auto to stay flat in 2QCY23 while IoT to see mid-single-digit growth vs 1QCY23
- 2QCY23 guidance suggests revenue will decline 2% q/q and 17% y/y (more pronounced than usual due to Apple purchase patterns)
- Qualcomm guides CY23 3G/4G/5G shipments could decline high-single-digit % y/y
- Despite the smartphone unit decline, the premium tier holds up well
Qorvo 4QFY23:
- Revenue down -15% q/q and -33% y/y to $633m
- Smartphone RFFE revenue from Android up q/q but will decline in the June quarter
- Smartphone RFFE revenue down -46% y/y to $418m
- Android revenue was up sequentially as guided, driven by Samsung $QRVO
- Not seeing any pickup from China reopening (consistent with $QCOM)
- March was the bottom for China Android and will grow sequentially in June quarter
- 40% attach rate in Android 5G & expects it to grow double-digit CAGR
- 10 percentage points of GM hit due to underutilization
- 2023 smartphone shipments to be down but 5G shipments will be up 5-10%
- Apple (37%) and Samsung (12%) two biggest customers in FY23
- 1QFY24 (June) revenue to grow sequentially (mid-pt)
- Content share gain opportunities at Apple with BAW
AMD 1Q23:
- Revenue down -4.4% q/q and -9.1% y/y to $5.35b (above the mid-pt of the guidance)
- Classic AMD revenue down -10% q/q to $3.8b
- Client and data center down q/q and y/y while gaming and embedded grew; semi-custom did well in a seasonally down quarter, surprisingly
- Flat q/q guidance for 2Q23; 2H > 1H in revenue in 2023; DC will see double-digit y/y growth in 2023
- DC & client will grow sequentially in 2Q while gaming and embedded will be down
- Within DC, cloud was strong y/y in 1Q. Enterprise weak. Cloud is a low-margin business. $AMD
- 2H enterprise recovery hopes and better cloud performance vs 1H
- Strong growth in DC in 2H, driven by Genoa, Bergamo and MI300; Meaningful DC GPU revenue in 2024; DC GPU a long-term opportunity
- Feels good about product strength and roadmap
- Open to Hyperscaler semi-custom
SK Hynix 1Q23:
- Revenue down for the 3rd straight quarter. Will decline further in 1Q23
- negative margins
- Revenue down -35% q/q & -58% y/y to $3.8b
- 2023 CapEx : -50%+ y/y
- All end markets declined
- Revenue bottomed in 1Q and will grow in 2Q
- Inventory will peak in 2Q
- 2H revenue to be greater than 1H
- DRAM bit shipments down -20% q/q while NAND down by mid-teen %
- PC, smartphone and data center weakness
- DRAM industry saw -ve margins in 1Q23
- 2024 industry production capacity is limited due to 2023 CapEx cuts, meaning when the demand returns, ASPs will shoot up. Some consumer companies are stocking memory in anticipation of recovery
- Reduced wafer starts on legacy products and high-inventory products