Smart Money Concepts (SMC) — Trade Like Institutions 🧠🧵
Tired of late entries, fake breakouts & random indicators?
Time to learn Smart Money Concepts (SMC) — the trading style used by institutions, banks & prop firms.
In this advanced thread:
✅ What is SMC
✅ All key concepts
✅ Strategies & setups
✅ SL, targets, examples
✅ FVG, OB, Liquidity, BOS
👇
#Wipro
1) What is Smart Money Concepts (SMC)?
SMC is a price action-based trading approach that focuses on:
📌 How big players (institutions, banks) move markets
📌 Finding liquidity zones
📌 Spotting manipulation traps
📌 Entering where smart money enters — not where retail chases
✅ No indicators
✅ Pure logic, structure, and clean entries
SMC is a price action-based trading approach that focuses on:
📌 How big players (institutions, banks) move markets
📌 Finding liquidity zones
📌 Spotting manipulation traps
📌 Entering where smart money enters — not where retail chases
✅ No indicators
✅ Pure logic, structure, and clean entries
2) Key Pillars of SMC
Here are the core concepts every trader must master:
1️⃣ Market Structure
2️⃣ Break of Structure (BOS)
3️⃣ Liquidity (Equal Highs/Lows)
4️⃣ Order Blocks (OB)
5️⃣ Fair Value Gaps (FVG)
6️⃣ Mitigation Blocks
7️⃣ Internal Structure / Chalk
8️⃣ Displacement Moves
9️⃣ Entry Models (Type 1 & 2)
Let’s break each down 👇
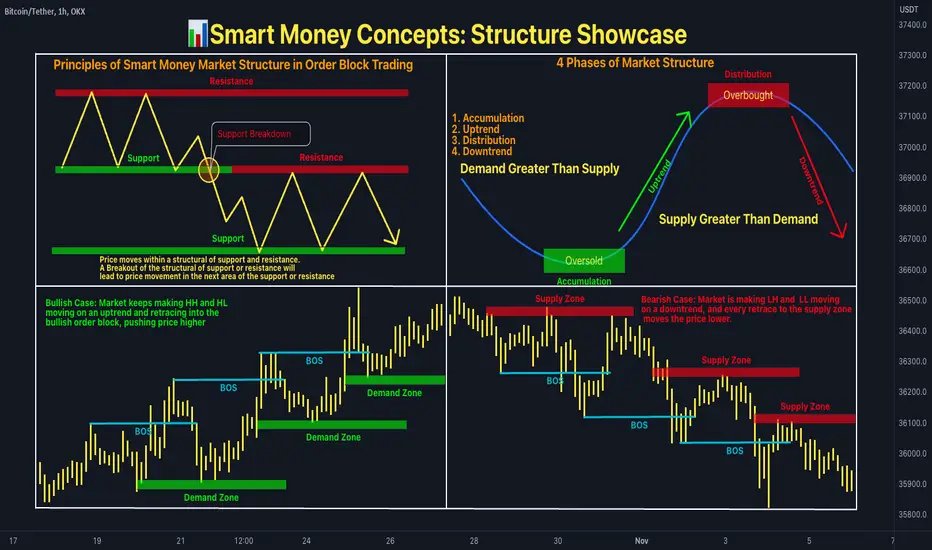
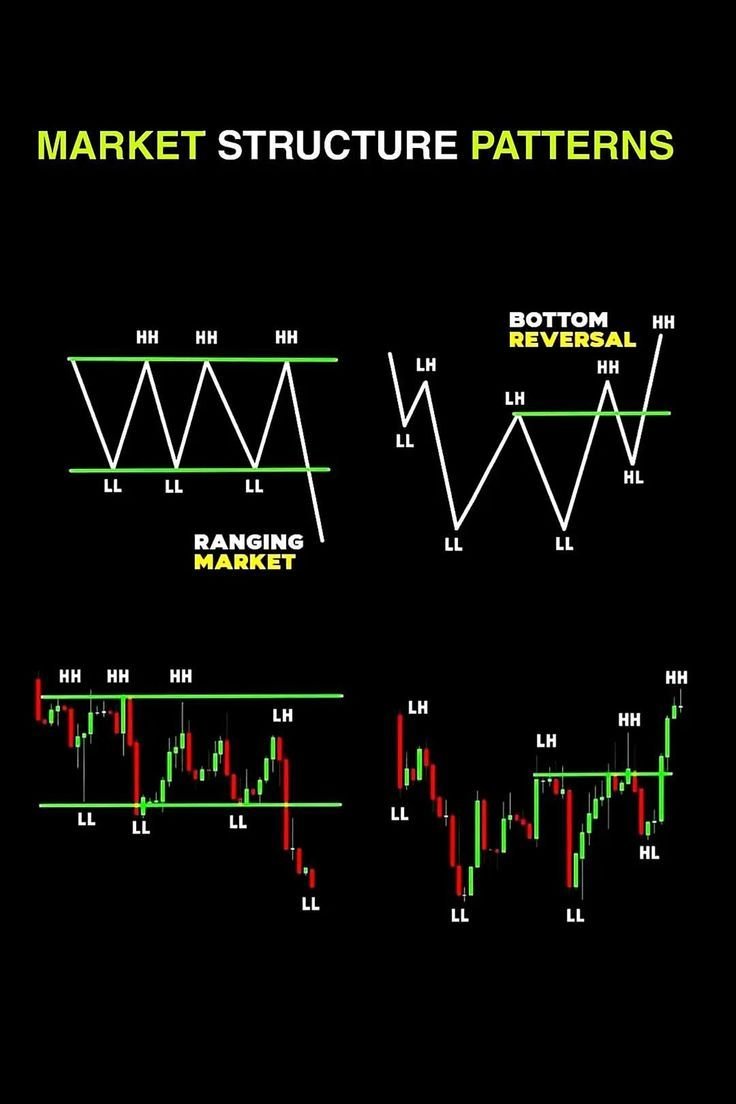
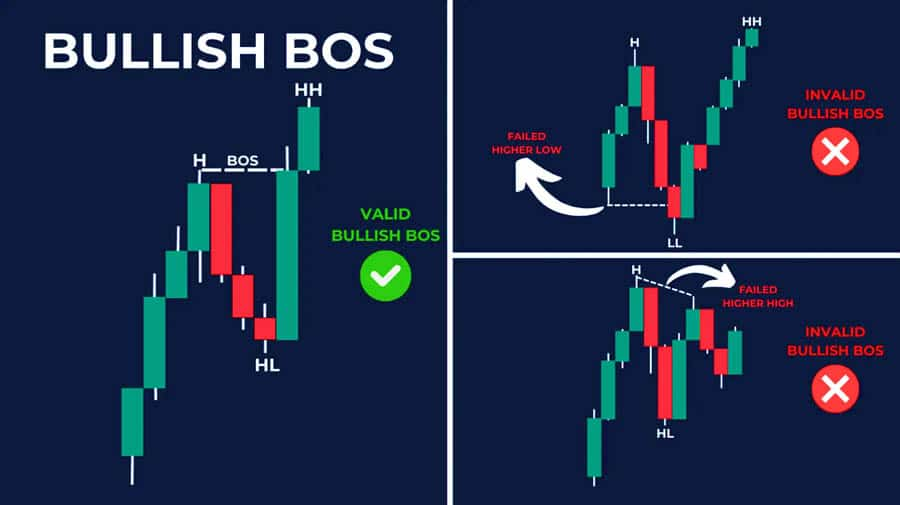
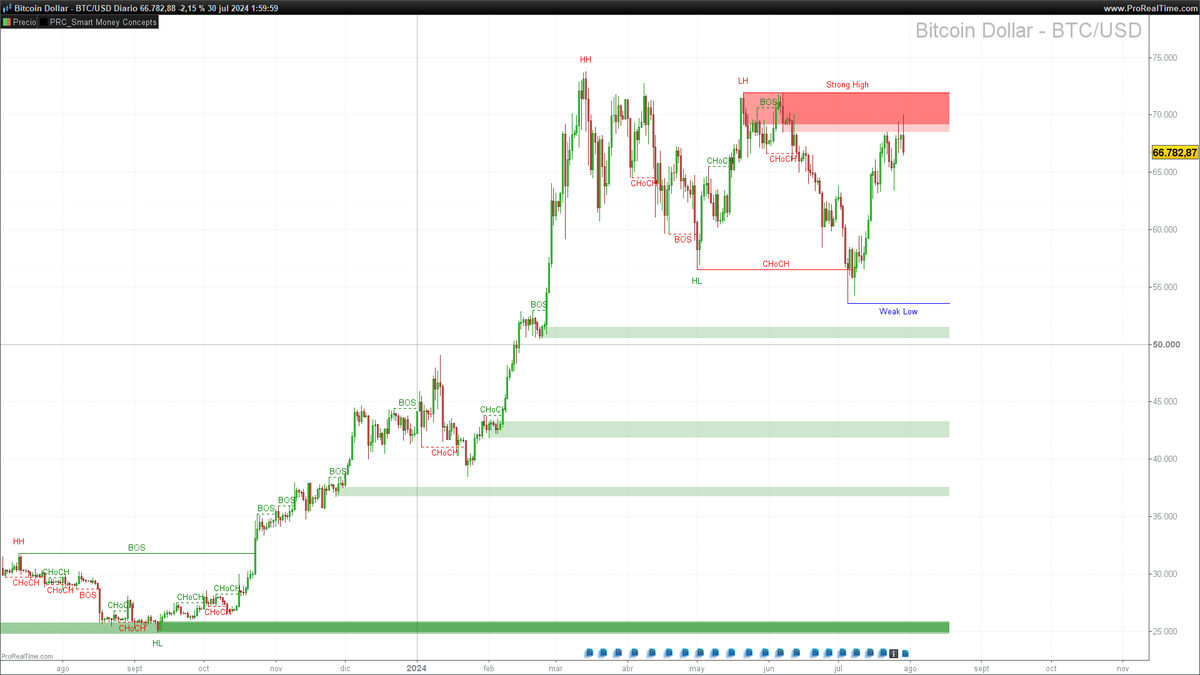
3) Market Structure (HH, LL)
📌 Price moves in swings — Higher Highs (HH) & Higher Lows (HL)
📌 Or Lower Highs (LH) & Lower Lows (LL)
✅ Bullish market: HH → HL → HH
✅ Bearish market: LL → LH → LL
SMC focuses on structure shifts — where smart money changes direction.
📌 Price moves in swings — Higher Highs (HH) & Higher Lows (HL)
📌 Or Lower Highs (LH) & Lower Lows (LL)
✅ Bullish market: HH → HL → HH
✅ Bearish market: LL → LH → LL
SMC focuses on structure shifts — where smart money changes direction.
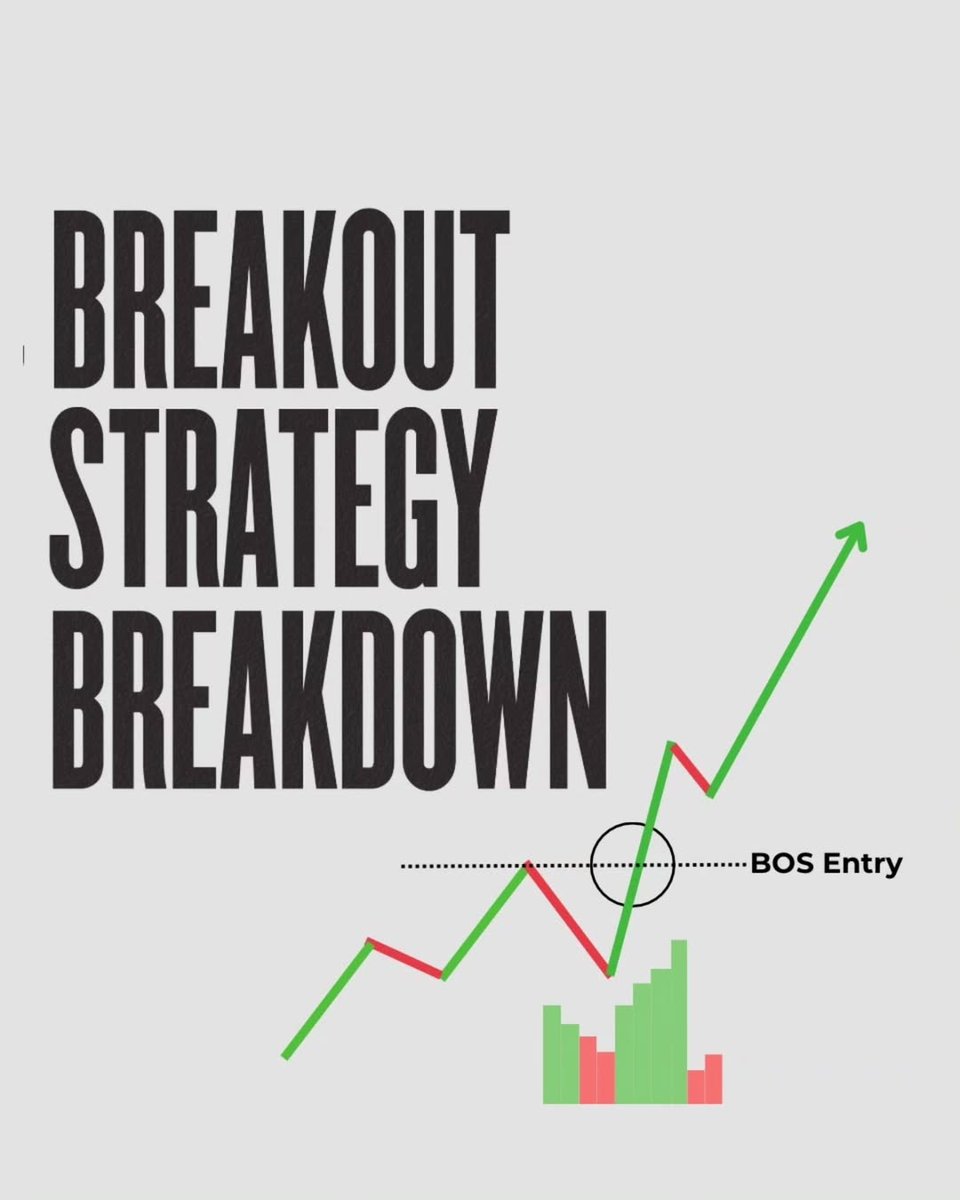
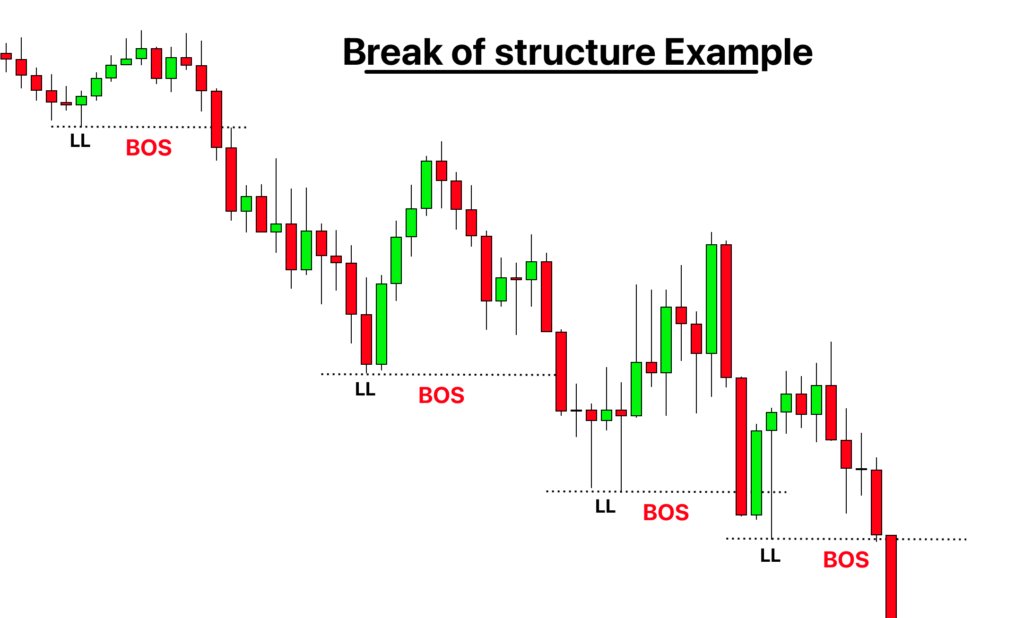
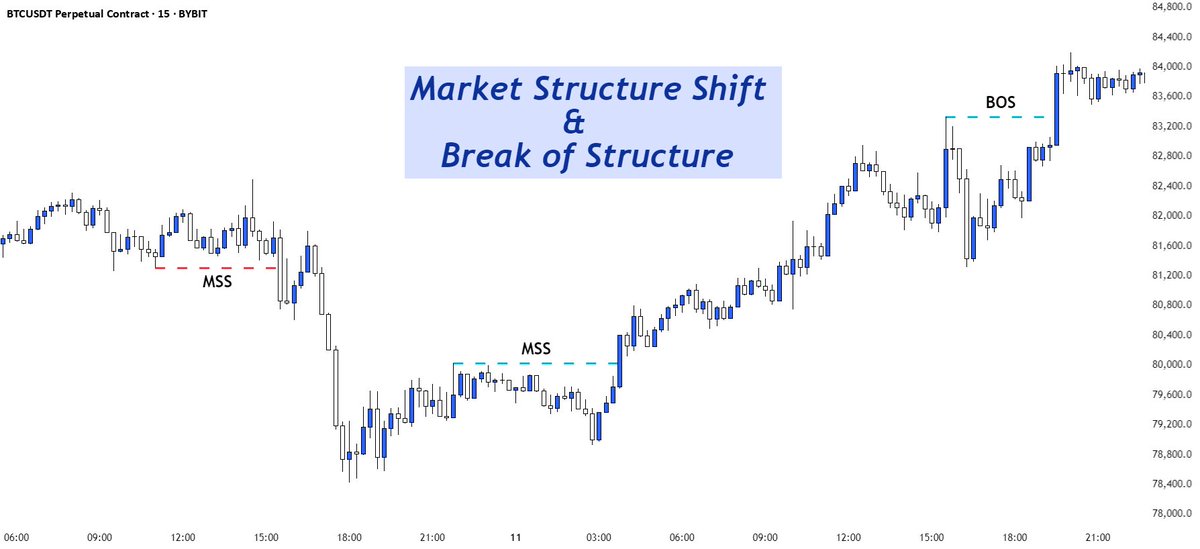
4) Break of Structure (BOS)
When price breaks previous HH or LL → it signals a shift in control.
📍 BOS to upside = Trend change to bullish
📍 BOS to downside = Trend turning bearish
You NEVER enter before BOS.
You wait → then trade the retracement.
When price breaks previous HH or LL → it signals a shift in control.
📍 BOS to upside = Trend change to bullish
📍 BOS to downside = Trend turning bearish
You NEVER enter before BOS.
You wait → then trade the retracement.
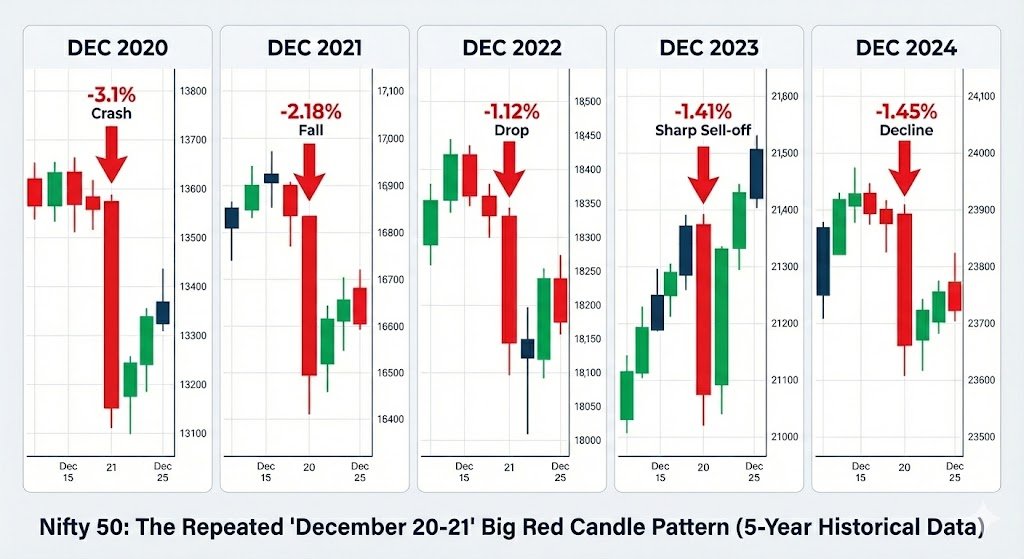
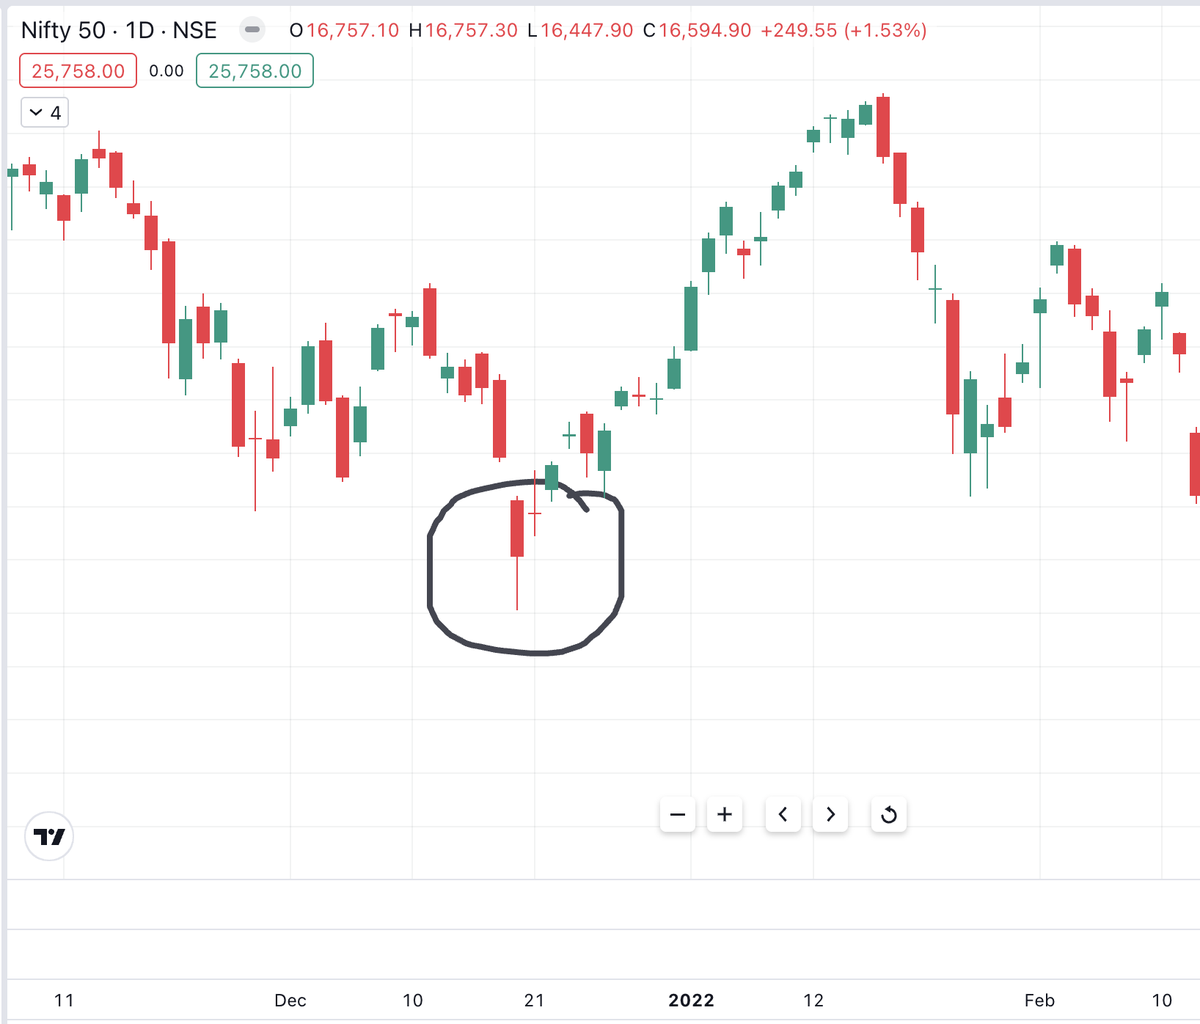
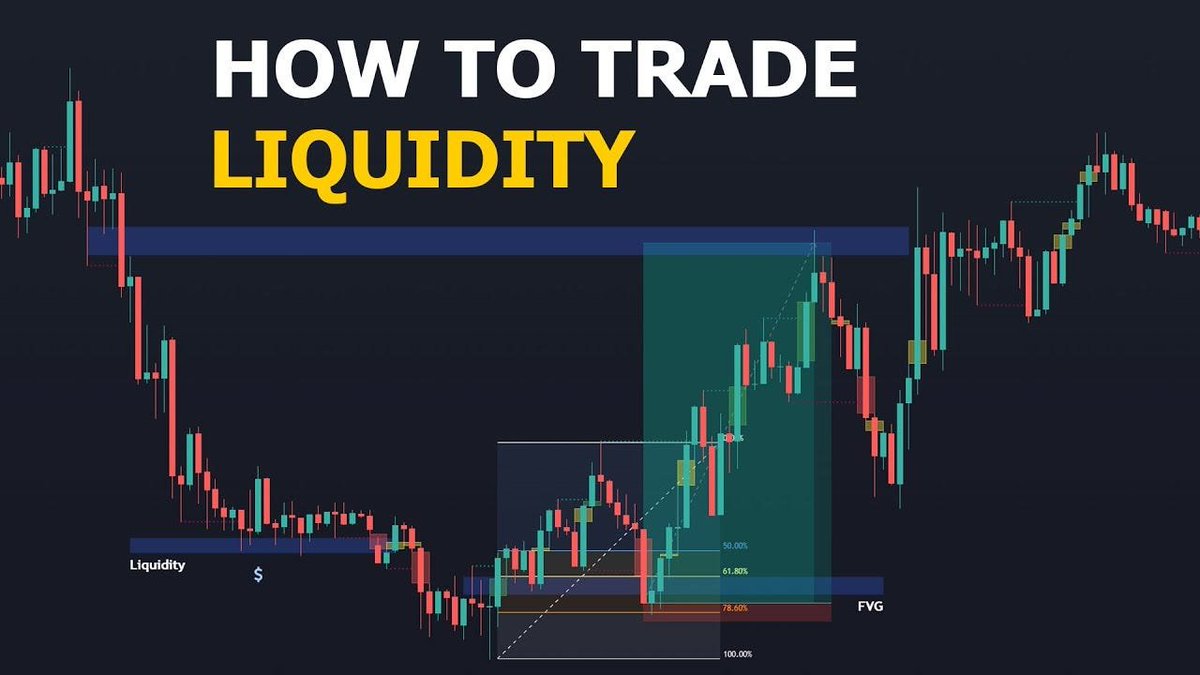
5) Liquidity — Fuel for Smart Money
📌 Liquidity = Buy/sell orders waiting above/below swing points
✅ Equal Highs = Buy-side liquidity
✅ Equal Lows = Sell-side liquidity
Institutions create fake breakouts to grab these orders, then reverse.
SMC traders wait for the trap, then ride the reversal.
📌 Liquidity = Buy/sell orders waiting above/below swing points
✅ Equal Highs = Buy-side liquidity
✅ Equal Lows = Sell-side liquidity
Institutions create fake breakouts to grab these orders, then reverse.
SMC traders wait for the trap, then ride the reversal.
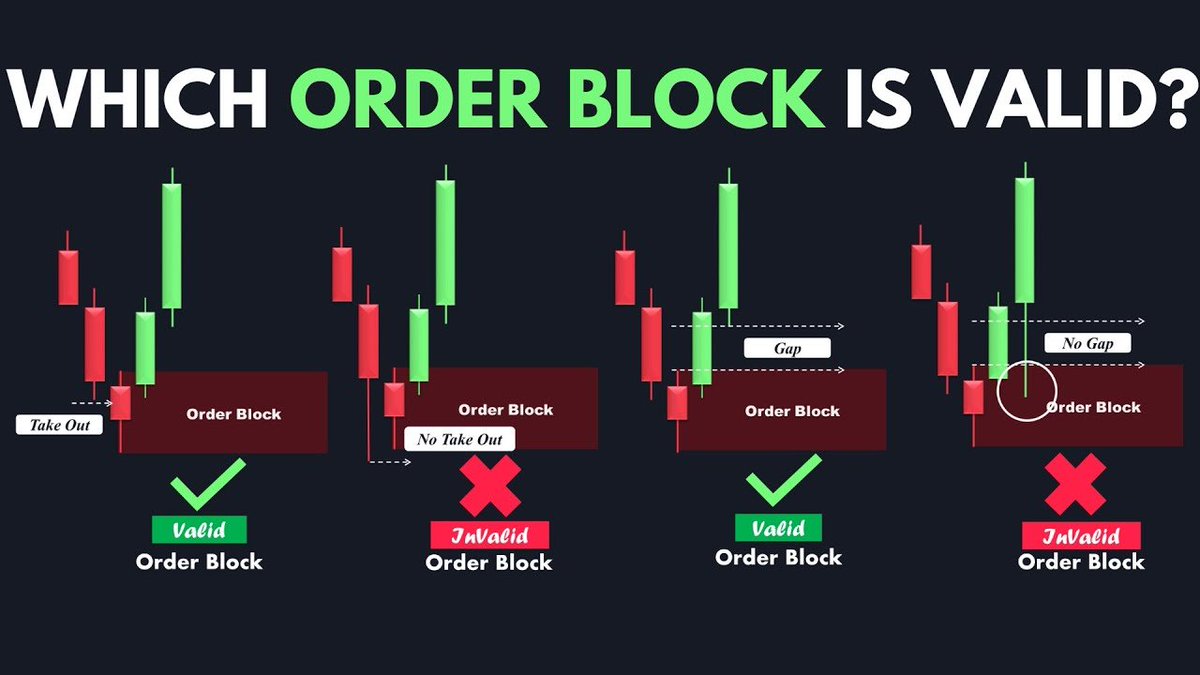
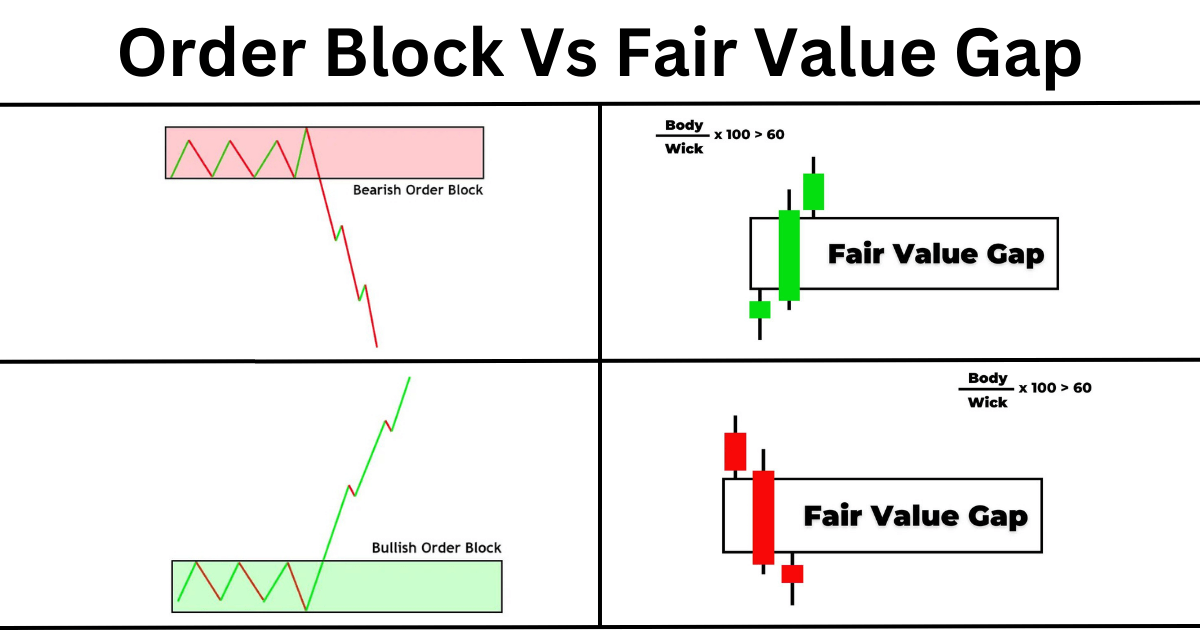
6) Order Blocks (OB)
An Order Block is the last bullish or bearish candle before a major move.
📌 Bullish OB = Last down candle before big up move
📌 Bearish OB = Last up candle before big drop
Price often returns to OB to fill unfilled orders → sniper entry zone
An Order Block is the last bullish or bearish candle before a major move.
📌 Bullish OB = Last down candle before big up move
📌 Bearish OB = Last up candle before big drop
Price often returns to OB to fill unfilled orders → sniper entry zone
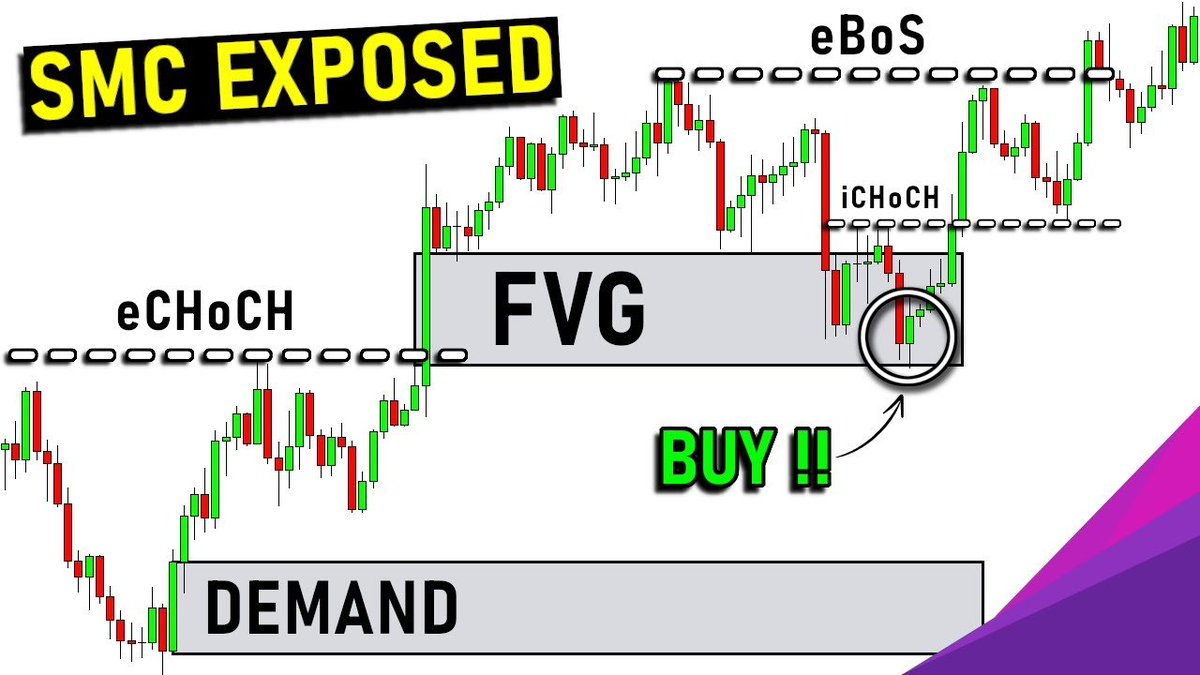
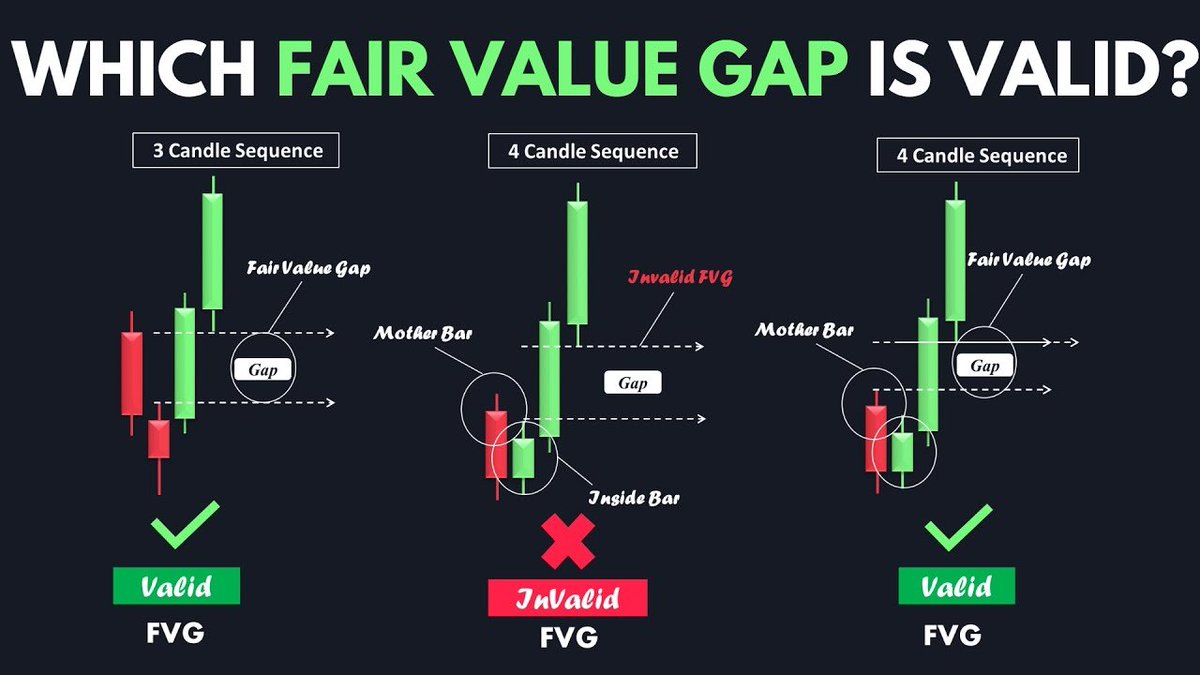
7) Fair Value Gap (FVG)
FVG = Price imbalance
📌 When price moves too quickly → leaves a gap between candles 1 & 3
✅ Price often returns to FVG → fills the gap → then continues
Used to:
✅ Confirm smart money presence
✅ Get clean low-risk entries
FVG = Price imbalance
📌 When price moves too quickly → leaves a gap between candles 1 & 3
✅ Price often returns to FVG → fills the gap → then continues
Used to:
✅ Confirm smart money presence
✅ Get clean low-risk entries
8) Internal Structure (Chalk)
Chalk = Change of Character
📌 Before BOS on higher TF, watch for internal structure shift
→ This helps you enter early
Example:
Price makes LLs
Then breaks minor HHs
→ Internal shift = Smart Money loading
→ Prepare for entry
Chalk = Change of Character
📌 Before BOS on higher TF, watch for internal structure shift
→ This helps you enter early
Example:
Price makes LLs
Then breaks minor HHs
→ Internal shift = Smart Money loading
→ Prepare for entry
9) Entry Models (Type I & II)
🅰️ Entry Model 1
BOS confirmed
Wait for retrace to OB/FVG
Rejection candle forms
→ Enter with SL below zone
🅱️ Entry Model 2
Internal structure changes (Chalk)
BOS pending
→ Early entry with tight SL
Use Entry Model 2 when you want to front-run structure shift.
🅰️ Entry Model 1
BOS confirmed
Wait for retrace to OB/FVG
Rejection candle forms
→ Enter with SL below zone
🅱️ Entry Model 2
Internal structure changes (Chalk)
BOS pending
→ Early entry with tight SL
Use Entry Model 2 when you want to front-run structure shift.
10) Complete SMC Trade Strategy
🔧 Setup:
Identify trend & HTF BOS
Watch for liquidity sweep (equal highs/lows)
Spot OB or FVG
Wait for price to return
Look for rejection or internal BOS
Enter with SL below zone
Target BOS or next OB/liquidity
✅ R:R = 1:3 to 1:10 possible
🔥 Works in all markets — options, futures, forex, crypto
🔧 Setup:
Identify trend & HTF BOS
Watch for liquidity sweep (equal highs/lows)
Spot OB or FVG
Wait for price to return
Look for rejection or internal BOS
Enter with SL below zone
Target BOS or next OB/liquidity
✅ R:R = 1:3 to 1:10 possible
🔥 Works in all markets — options, futures, forex, crypto
11) SL, Target & Trade Management
✅ Stop Loss:
Below OB
Outside FVG
Or under mitigation candle
✅ Target:
Previous swing high/low
Next liquidity pool
1.272 or 1.618 Fibonacci extension
✅ Trail SL:
After R:R 1:2 hit
Trail with structure breaks
✅ Stop Loss:
Below OB
Outside FVG
Or under mitigation candle
✅ Target:
Previous swing high/low
Next liquidity pool
1.272 or 1.618 Fibonacci extension
✅ Trail SL:
After R:R 1:2 hit
Trail with structure breaks
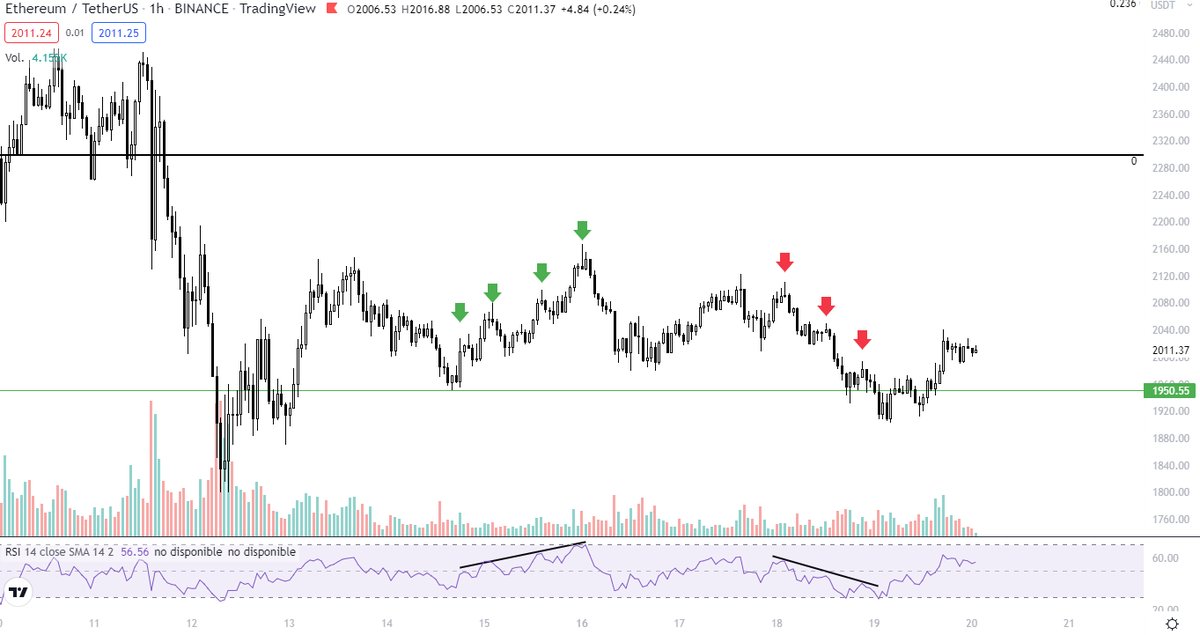
12) Real Example (BankNifty 5m)
1️⃣ Price makes equal highs = Buy-side liquidity
2️⃣ Spike above highs → Fake breakout
3️⃣ Bearish OB forms + FVG
4️⃣ BOS to downside
5️⃣ Price returns to OB zone
6️⃣ Bearish engulfing + volume drop
7️⃣ Enter short → Buy 49600PE @ ₹90
8️⃣ SL: ₹115
9️⃣ Target: ₹150 🔥
Pure Smart Money Logic → Low risk, high reward
13) Indicators to Combine (Optional)
Though SMC is indicator-free, you can add:
✅ VWAP → Confirm fair value zones
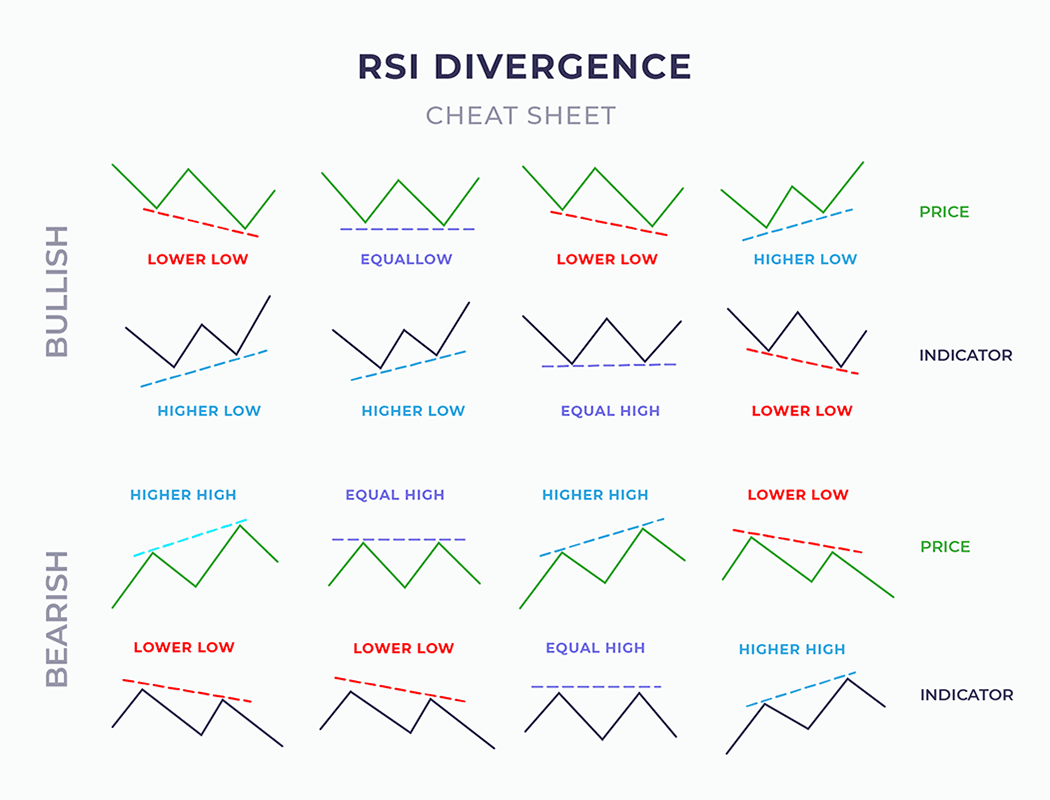
✅ RSI Divergence → Support reversal signals
✅ Volume → Confirm institutional activity
✅ CPR → Confluence with OB/FVG zones
Though SMC is indicator-free, you can add:
✅ VWAP → Confirm fair value zones
✅ RSI Divergence → Support reversal signals
✅ Volume → Confirm institutional activity
✅ CPR → Confluence with OB/FVG zones
• • •
Missing some Tweet in this thread? You can try to
force a refresh