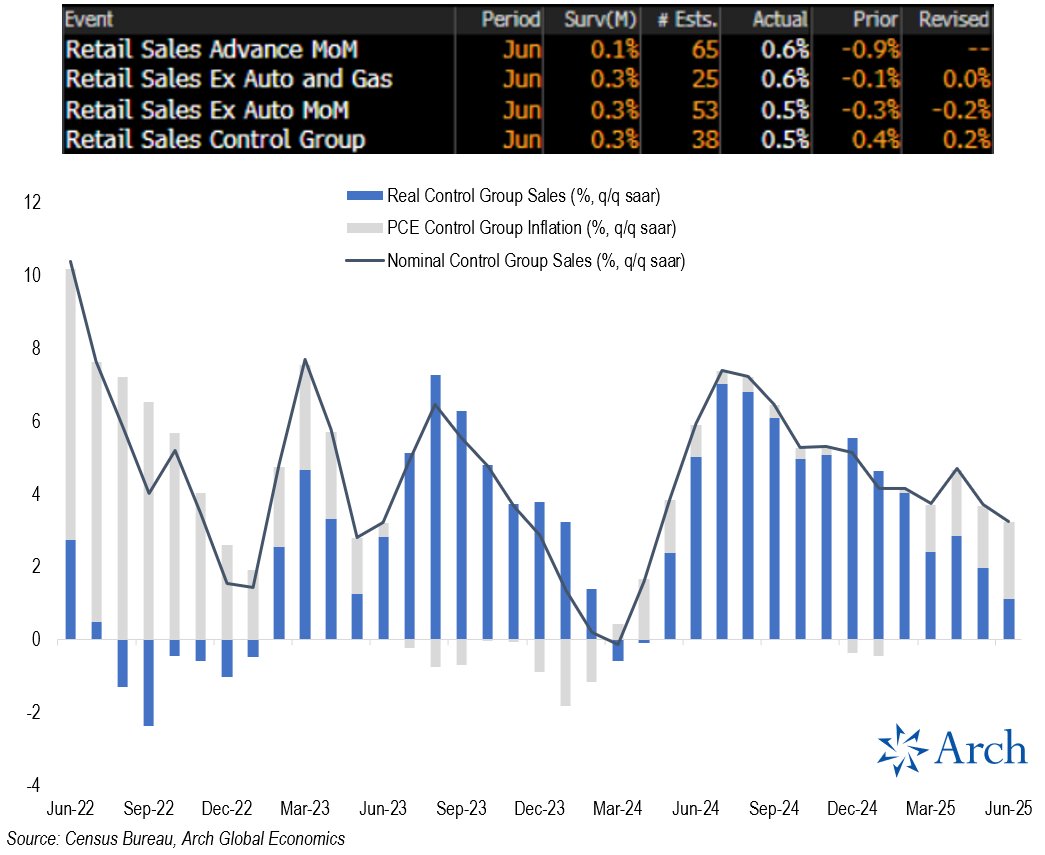
June Retail Sales beat expectations up 0.6% m/m (0.1% consensus), with Control Group (which feeds directly into GDP) also up 0.5% vs expectations for a 0.3% gain.
Very solid figures in nominal terms, but it's important to note that core goods inflation has picked up in recent months.
So, to understand if consumers are really ramping up spending or simply keeping up with higher prices, we need to adjust for inflation.
The trend is clear: consumers have been spending less and less in real (inflation-adjusted) terms over the course of 2025 as goods inflation has accelerated.
Some details in the 🧵 including a simple model for how much inflation has picked up for the Control Group.
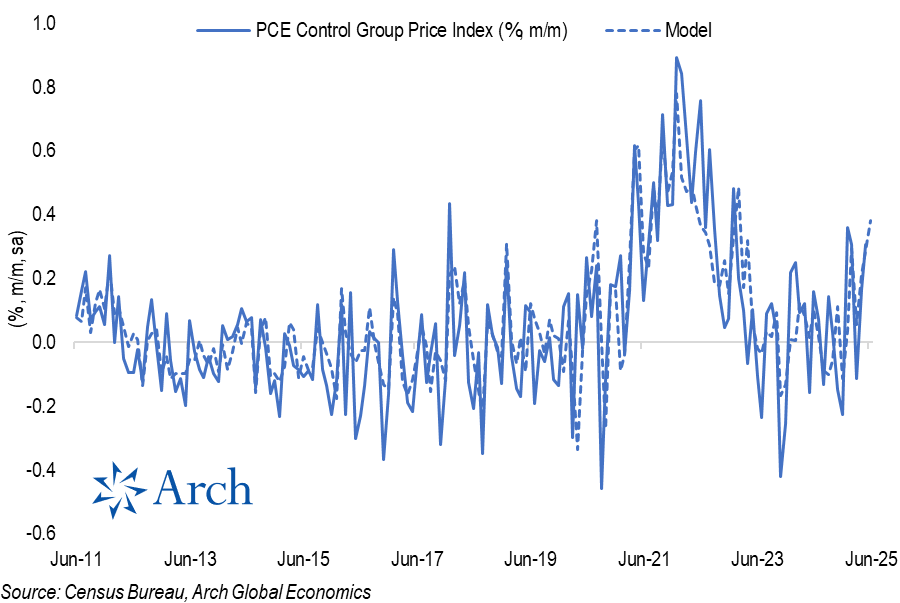
Here's a look at the simple model I used to estimate the PCE Control Group price index, which leverages CPI and PPI price indexes that correspond to Control Group spending categories like appliances, furniture / furnishing, construction materials, consumer electronics, recreational goods.
As I've noted in my recent posts regarding the CPI & PPI reports, prices for many of these goods have accelerated notably in recent months and the model picks this up nicely.
As I've noted in my recent posts regarding the CPI & PPI reports, prices for many of these goods have accelerated notably in recent months and the model picks this up nicely.
Here's what the monthly data looks like with the breakout for control group inflation vs real spending growth.
While the June real implied spending growth turned back slightly positive, it remains very weak.
While the June real implied spending growth turned back slightly positive, it remains very weak.

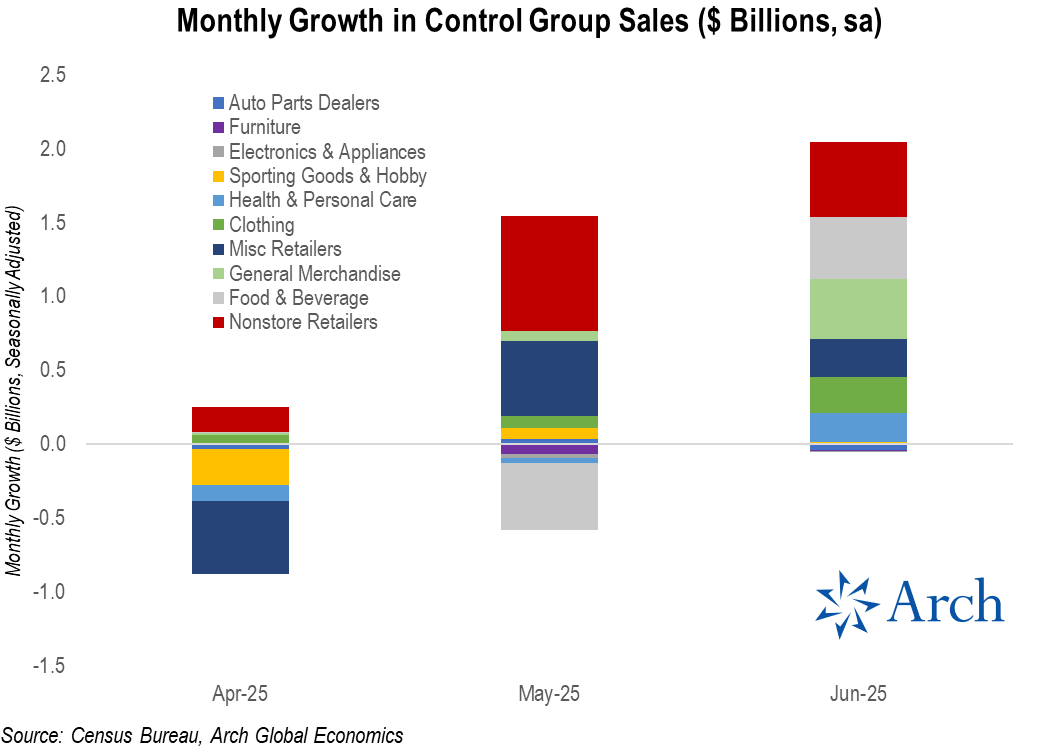
In nominal terms, the continued rebound in control group spending has come from nonstore retailers (i.e. online sales) along with a bounceback in food & beverage.
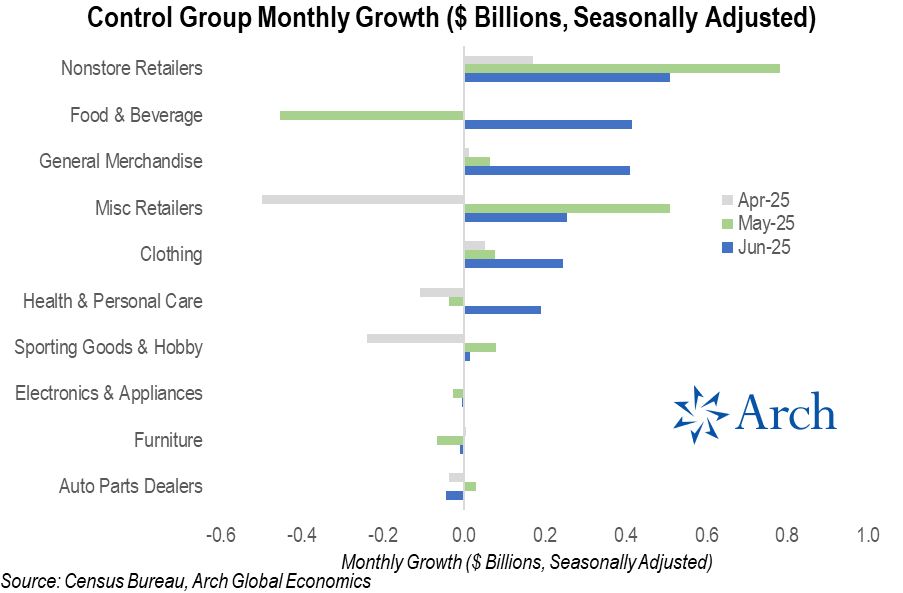
An alternative view of the recent 3 months of control group spending growth, to see how each category stacks up (literally)...
Today's retail sales report suggests the consumer is barely keeping up with price increases and certainly not accelerating spending meaningfully in real terms.
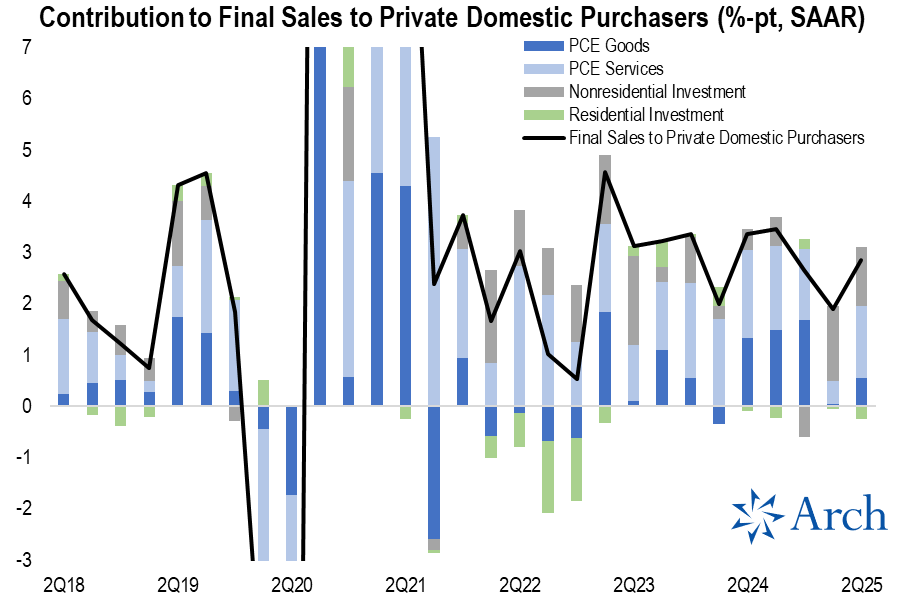
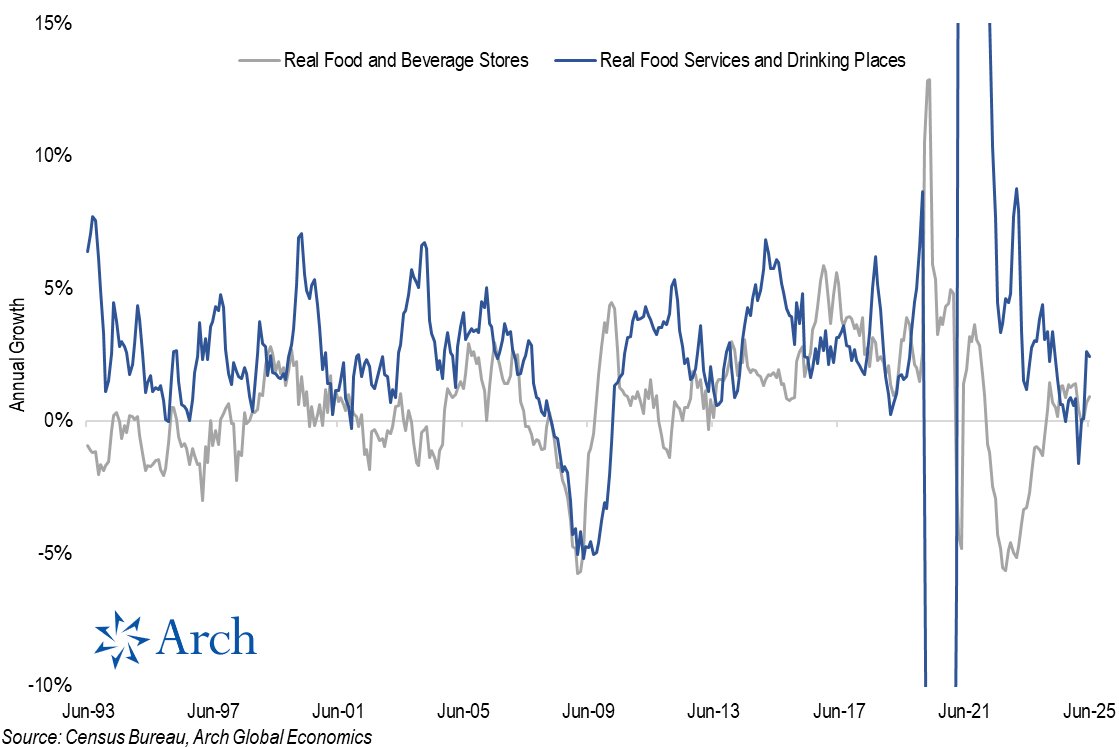
Retail sales overrepresents the goods side of consumption and there is evidence consumers are shifting spending to services.
Retail sales overrepresents the goods side of consumption and there is evidence consumers are shifting spending to services.
To that point, real restaurant spending has rebounded sharply on an annual basis, despite declining -5.7% on a monthly basis in June.
Overall, the consumer has not thrown in the towel and we'll need to watch what happens on the services side of the economy, but certainly the report wasn't as rosy as the headlines suggest.
• • •
Missing some Tweet in this thread? You can try to
force a refresh