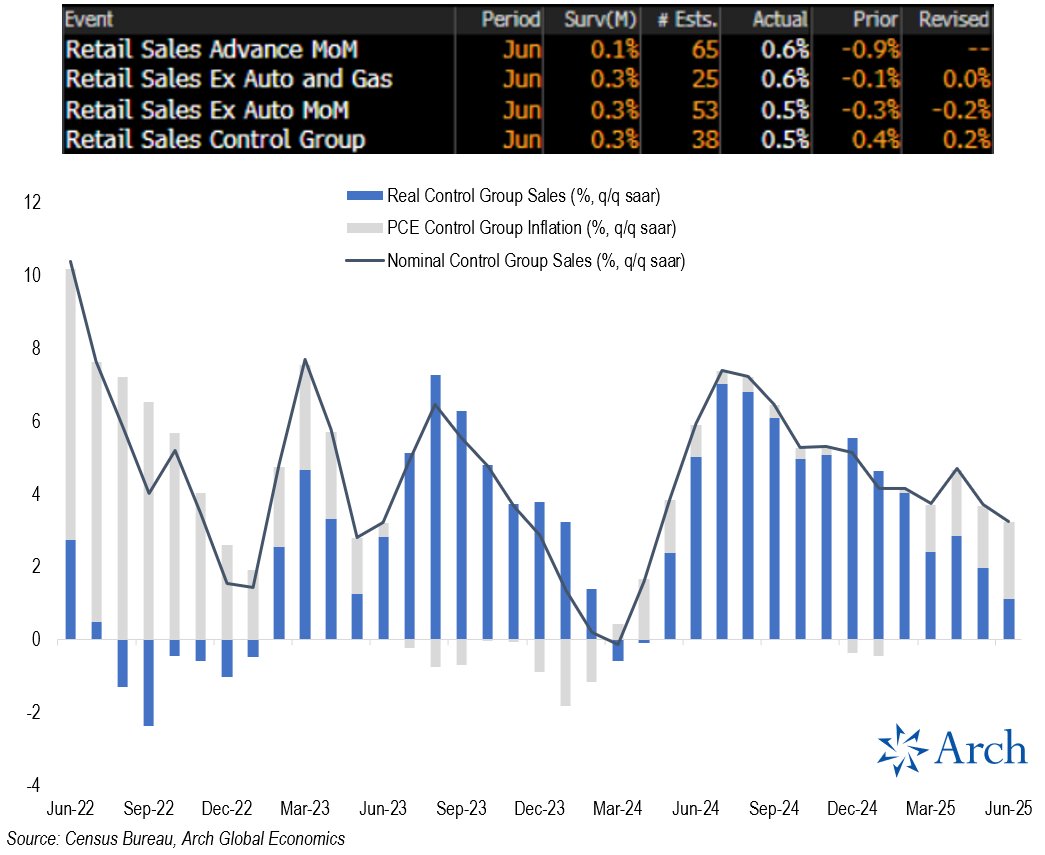
June Retail Sales beat expectations up 0.6% m/m (0.1% consensus), with Control Group (which feeds directly into GDP) also up 0.5% vs expectations for a 0.3% gain.
Very solid figures in nominal terms, but it's important to note that core goods inflation has picked up in recent months.
So, to understand if consumers are really ramping up spending or simply keeping up with higher prices, we need to adjust for inflation.
The trend is clear: consumers have been spending less and less in real (inflation-adjusted) terms over the course of 2025 as goods inflation has accelerated.
Some details in the 🧵 including a simple model for how much inflation has picked up for the Control Group.
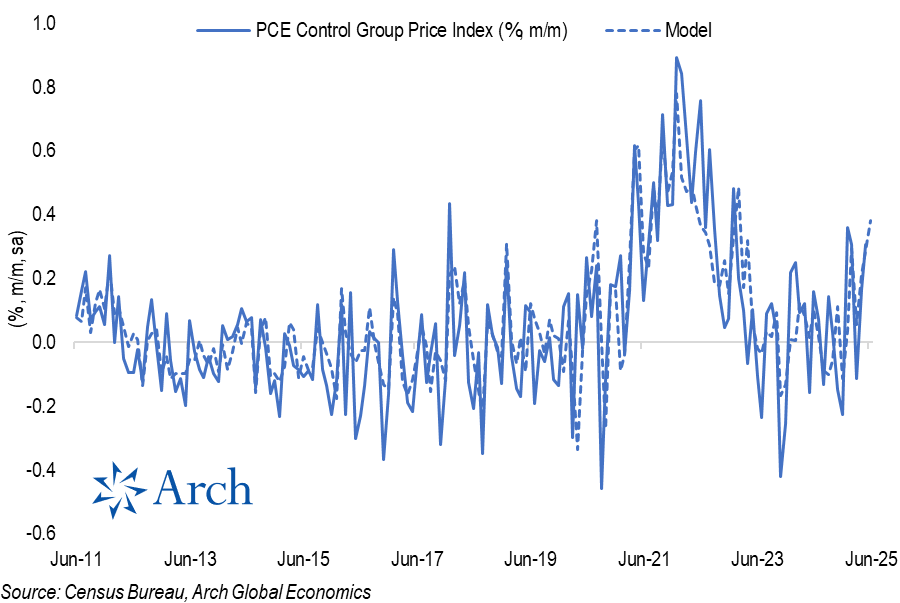
Here's a look at the simple model I used to estimate the PCE Control Group price index, which leverages CPI and PPI price indexes that correspond to Control Group spending categories like appliances, furniture / furnishing, construction materials, consumer electronics, recreational goods.
As I've noted in my recent posts regarding the CPI & PPI reports, prices for many of these goods have accelerated notably in recent months and the model picks this up nicely.
Here's what the monthly data looks like with the breakout for control group inflation vs real spending growth.
While the June real implied spending growth turned back slightly positive, it remains very weak.
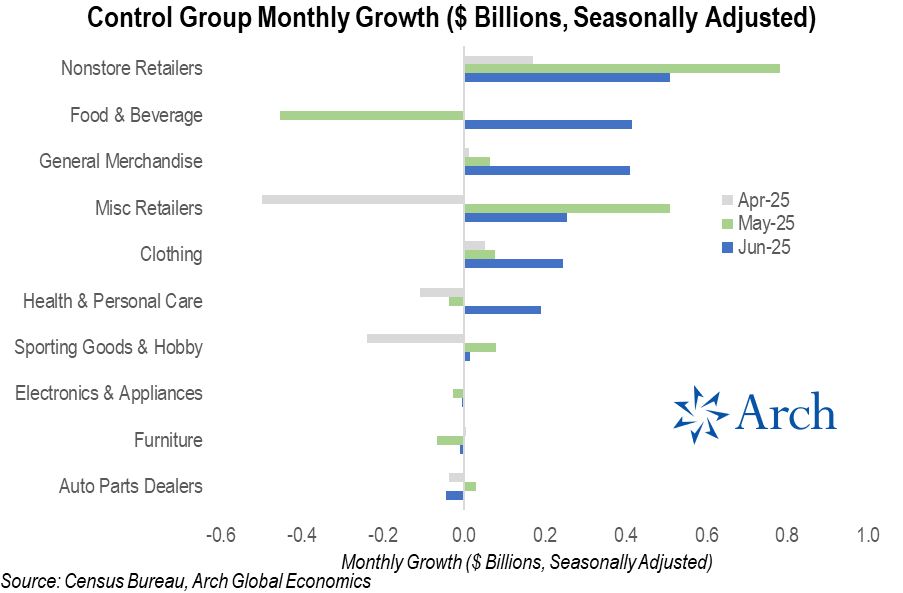
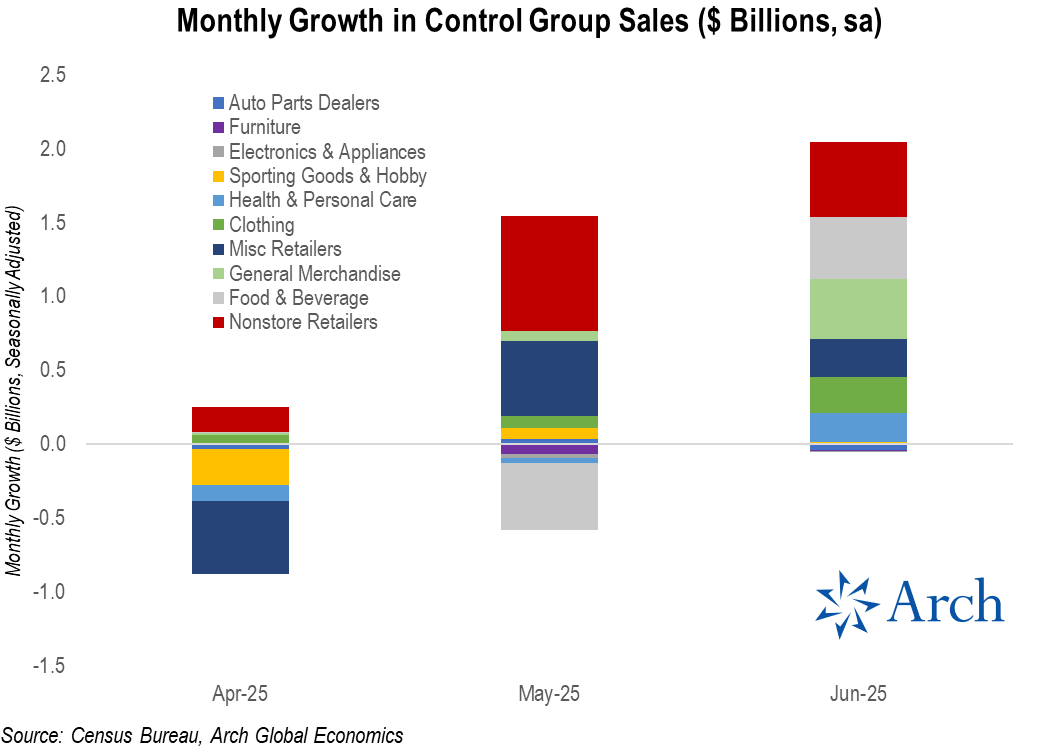
In nominal terms, the continued rebound in control group spending has come from nonstore retailers (i.e. online sales) along with a bounceback in food & beverage.
An alternative view of the recent 3 months of control group spending growth, to see how each category stacks up (literally)...
Today's retail sales report suggests the consumer is barely keeping up with price increases and certainly not accelerating spending meaningfully in real terms.
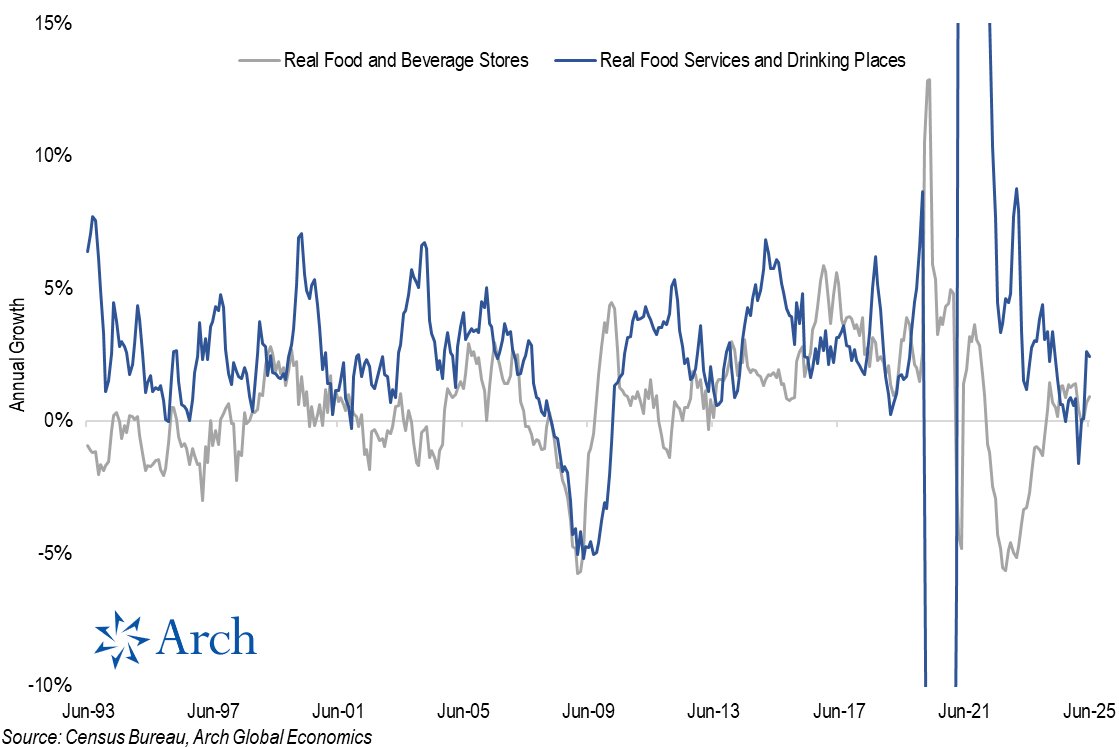
Retail sales overrepresents the goods side of consumption and there is evidence consumers are shifting spending to services.
To that point, real restaurant spending has rebounded sharply on an annual basis, despite declining -5.7% on a monthly basis in June.
Overall, the consumer has not thrown in the towel and we'll need to watch what happens on the services side of the economy, but certainly the report wasn't as rosy as the headlines suggest.
• • •
Missing some Tweet in this thread? You can try to
force a refresh
About that "no evidence of inflation" from tariffs...
If you know where to look, it seems pretty clear that inflationary pressures are building in the product categories most exposed to tariffs.
Case in point from today's June CPI report: Household Furnishings & Supplies, which saw prices jump nearly 1% m/m in June.
This was the sharpest monthly increase since the peak of the pandemic-driven inflation in early '22.
More evidence in the 🧵
Looking at the categories flagged as being most exposed to tariffs by two Fed staff economists earlier this year, you'll see a lot of the products in the Household Furnishings & Supplies category on this list 👇
UMich Consumer Sentiment jumped to 60.5 in June (prelim), a rebound from May's 52.2 which was its lowest level since 2022.
This is the first monthly gain for UMICH Consumer Sentiment in half a year and well above consensus expectations (53.6).
The rebound was broad-based across sentiment measures.
Is this a turning point in consumer moods or just a "relief rally"?
More in the 🧵
As noted at the top, there was a widespread rebound, with consumers' assessment of Current Economic Conditions and Expectations both rising, by a respective 4.8 and 10.5 points.
Despite the bounce, the current level is still below the prior 6m and 12m averages.
One of the biggest movers within the UMICH survey in 2025 has been inflation expectations, in particular the year-ahead.
The preliminary June reading marked the first convincing reversal of the prior surge in inflation expectations, which spiked sharply after Trump's inauguration.
Political ideology continues to skew perceptions massively, with Democrats now expecting inflation to exceed 10% by June 2026 vs only 1.5% for Republicans.
May PPI was softer than expected (+0.13% vs 0.22% consensus), but that doesn't mean tariff impacts aren't percolating.
PPI ex Food & Energy was also soft (+0.14% vs 0.28% cons) as PPI Services was particularly soft (+0.11% m/m) despite the rebound in trade margins.
Details on what's going on under the hood and what it all means for the Fed's preferred inflation measure (PCE) in the🧵
Two things worth noting before going further:
1) April was revised up to a less drastic downturn in producer prices (-0.24 vs -0.47%)
2) Tariffs aren’t included in PPI calculations directly
▪ PPI measures domestic producer prices; customs duties on imports are excluded
▪ But higher import costs can pass through via input prices and substitution effects
So if you're looking for early tariff pass-through, PPI won’t show the tariffs as a line item, but it may still whisper it through machinery, autos, and goods inflation over time.
Layoffs are steady at an uncomfortably elevated level near the upper end of recent years' range, but the number of people continuing to file claims is climbing sharply.
How does this make sense?
• Jobless claims were unchanged vs the prior week at 248k (242k consensus), but something else is worth taking note of...
• Continuing claims jumped over 50k to 1.95m (1.91m cons), the highest non-pandemic level since 2018.
More details in the 🧵
First, how can the unemployed population (i.e. continuing claims) rise without a corresponding rise in initial jobless claims?
This is a symptom of a cooling labor market, where people struggle to secure a new job after losing their old job.
We can see this building stress in the labor market by looking at the exhaustion rate for unemployment insurance (UI) benefits.
The exhaustion rate is the share of UI recipients who use up their full benefit period (typically 26 weeks) without finding a job.
Effectively, workers are increasingly not able to find a new job within 6 months of losing their prior job and running out of benefits.
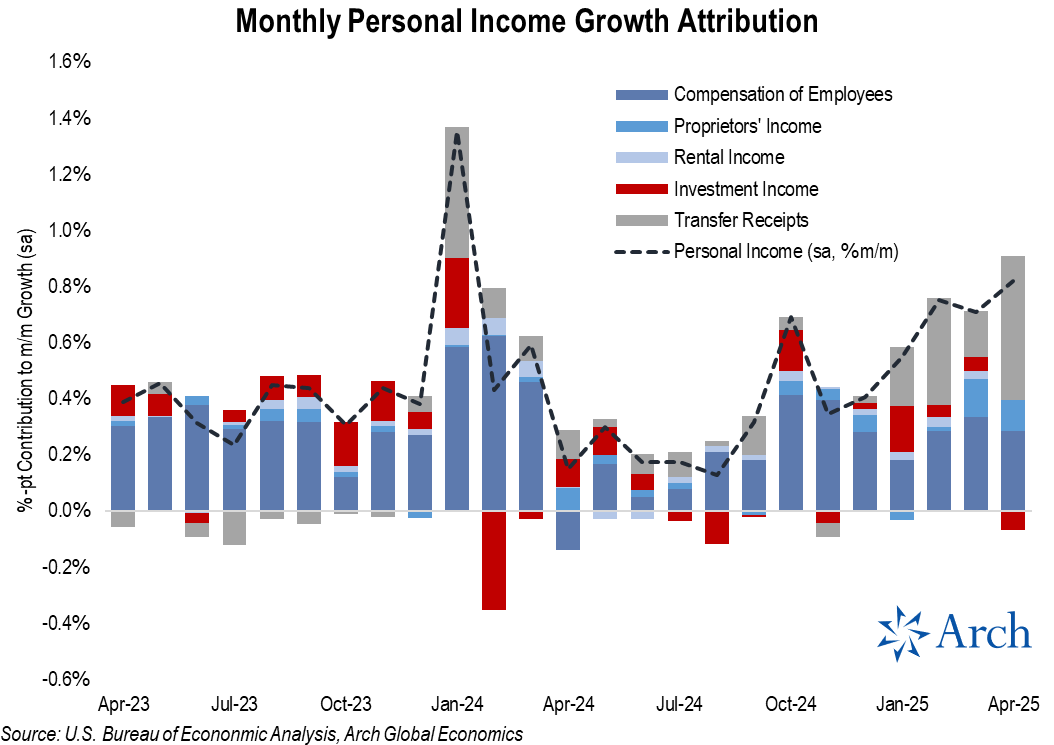
Seeing a lot of excitement about the strength in personal income growth through April (+0.8% m/m, sa).
The details of the report should temper that enthusiasm.
While growth in employee compensation and small business owner incomes were solid through April, the recent surge in income has come from transfer receipts (i.e. payments to individuals from the government and businesses).
More detail on what's behind the recent surge in the 🧵
Here's another way of looking at the contribution to monthly personal income growth... a smoothed 3-month average of the contribution.
Here, you can clearly see the surge in the red line, reflecting the tailwind to income growth coming from transfer receipts.
Here is where it's important to read the Technical Notes of data releases...
According to the BEA, "the increase in personal income in April reflected increases in in government social benefits to persons" led by an increase in Social Security payments associated with payments for the Social Security Fairness act.