CyFi Profile picture
Jul 18, 2025 6 tweets 3 min read Read on X
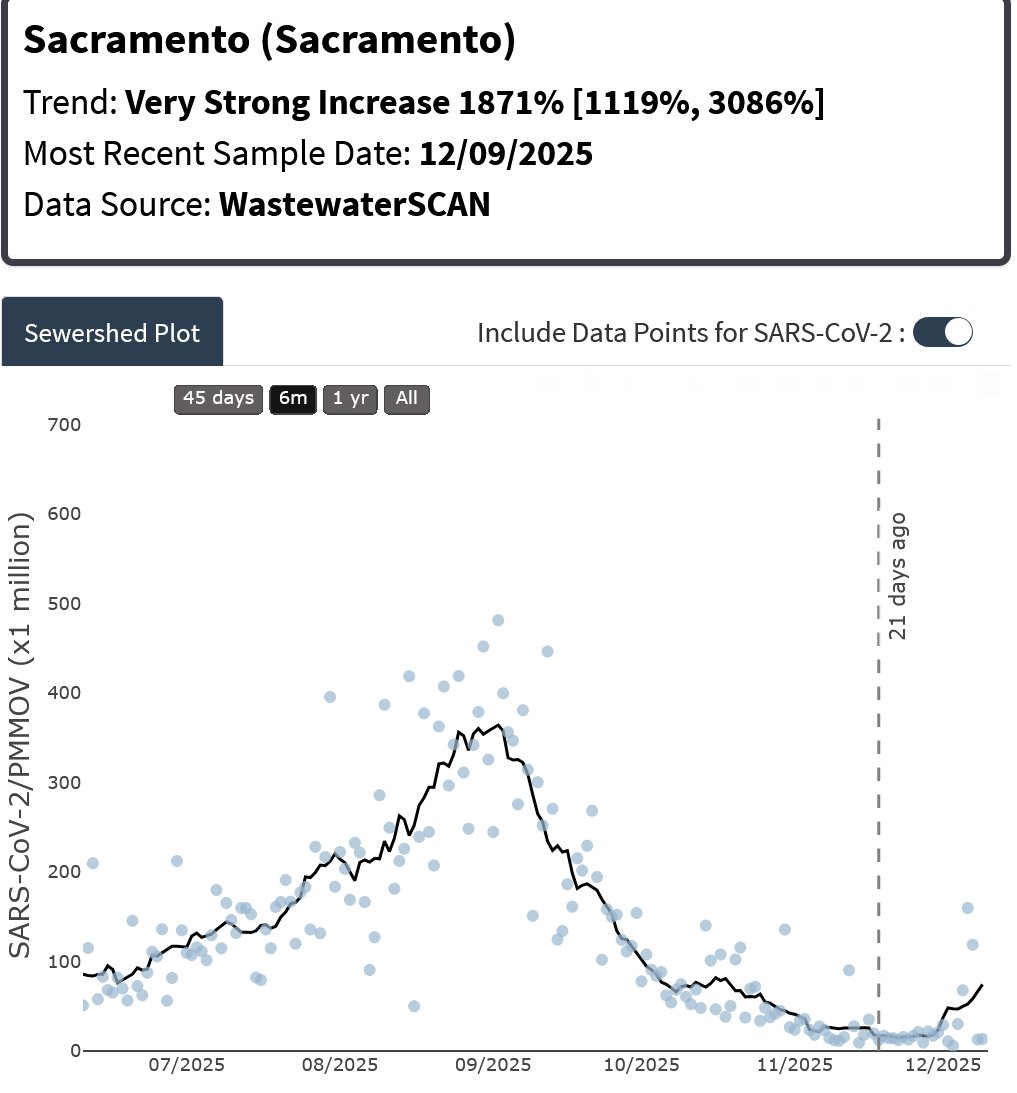
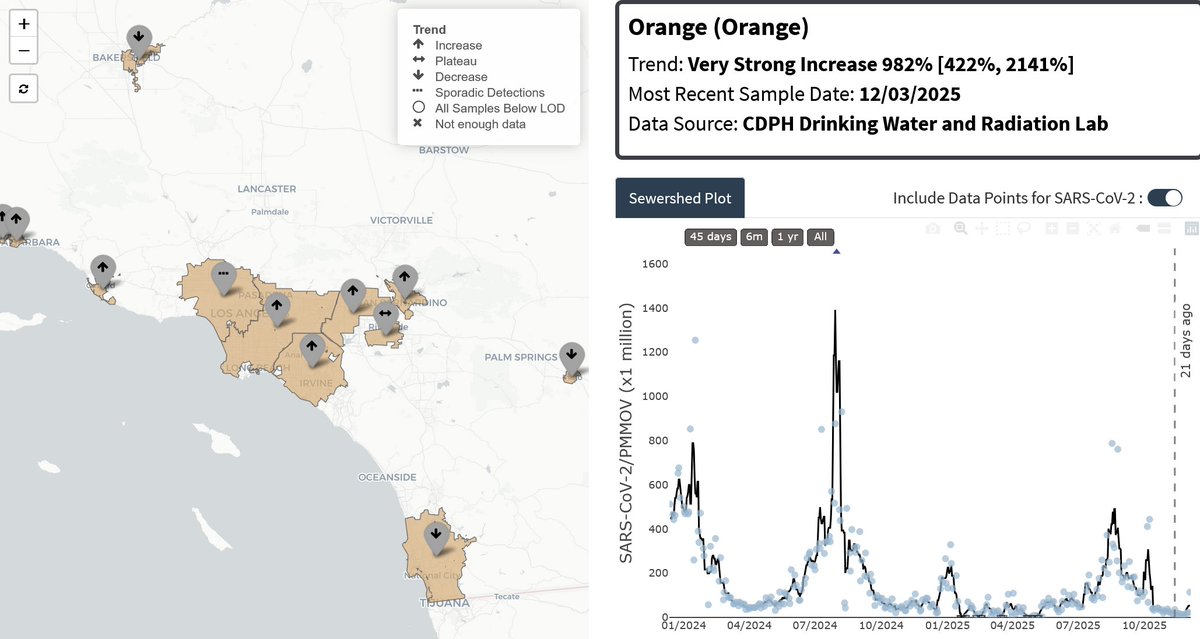
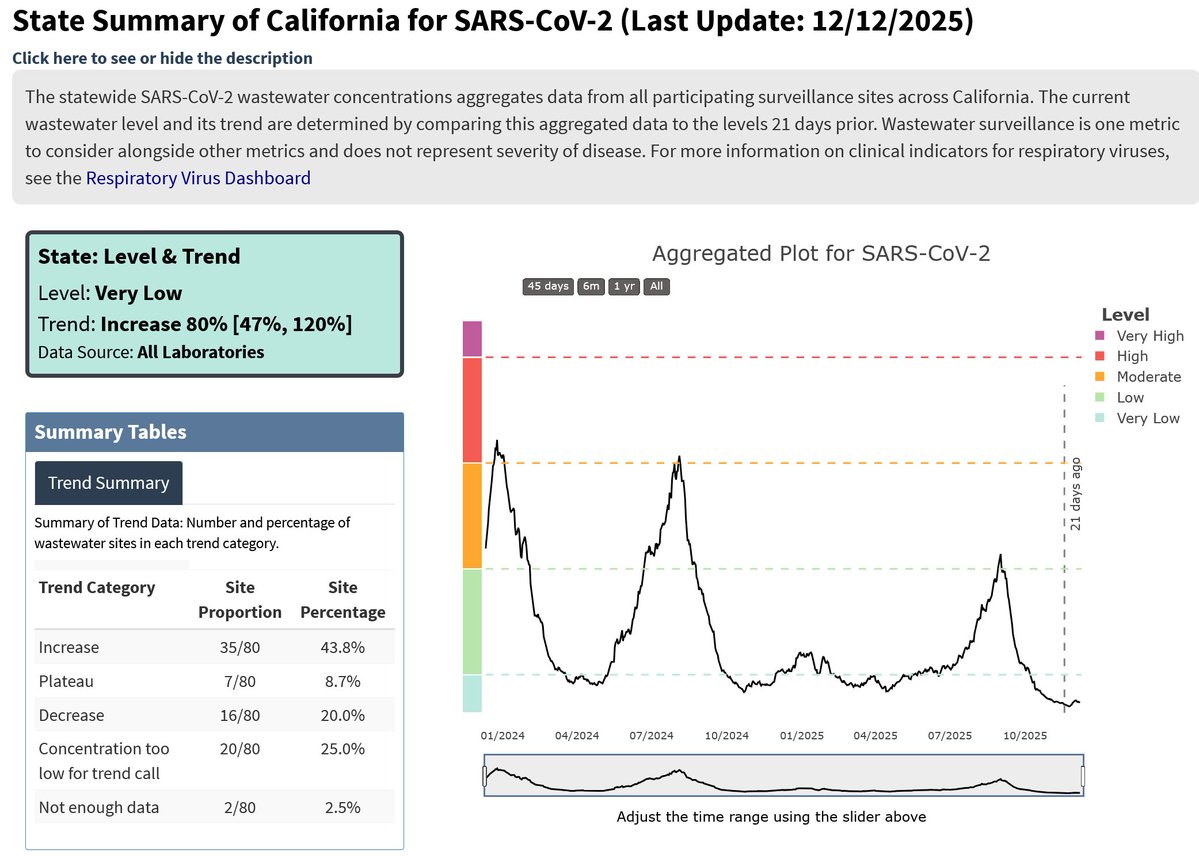
CALIFORNIA: All regions sans SOCAL are showing HIGH levels of SARS-CoV-2 in wastewater samples as of today's report.
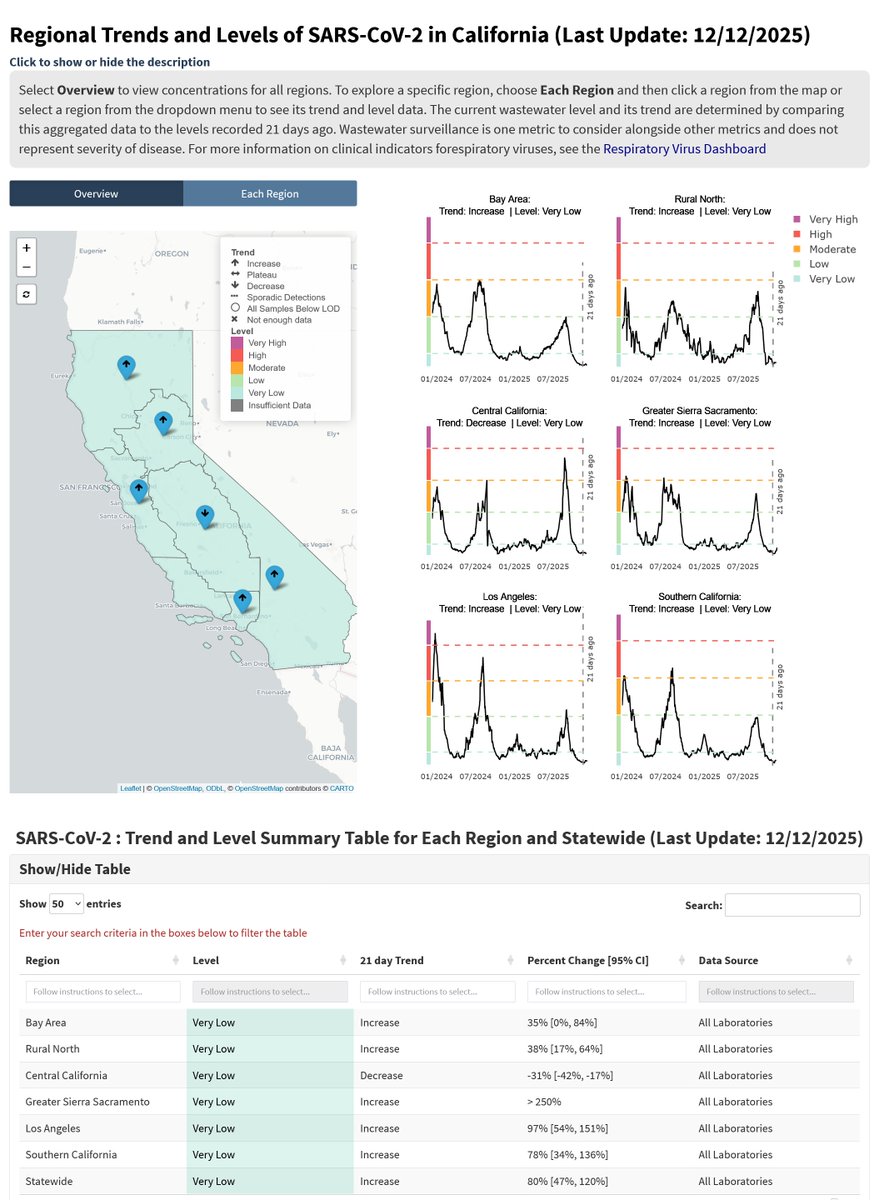
Trends for all sites at high, and medium are shown here.Image
Image
Image
Image
Southern CA, and last week's report.
Image
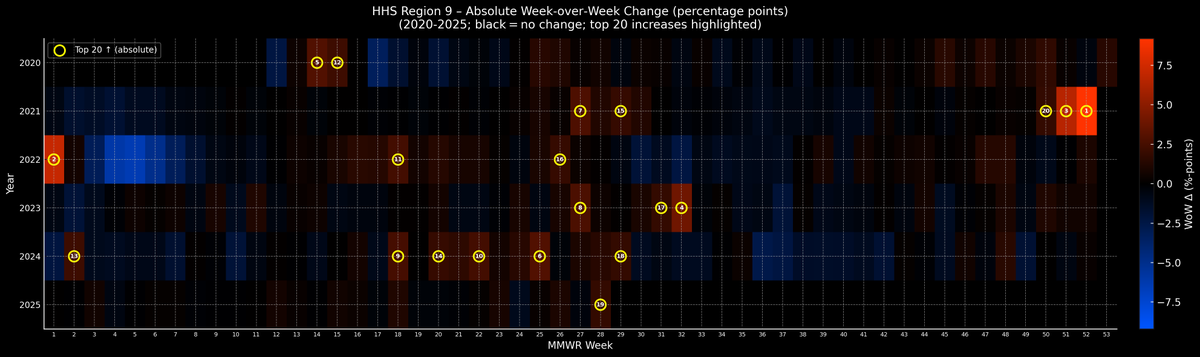
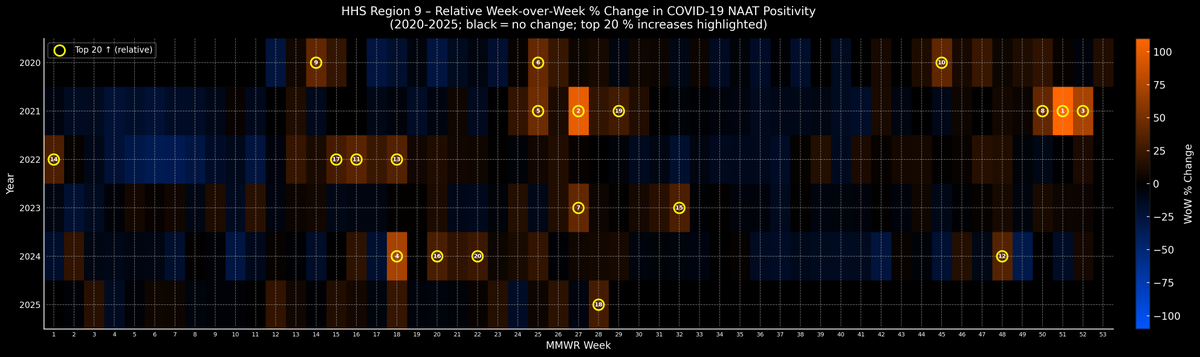
HHS Region 9 (CA, AZ, NV, HI) has 18th highest relative % increase in Covid positivity, and the 19th highest absolute increase for the entire pandemic, for the week ending July 12.Image
Image
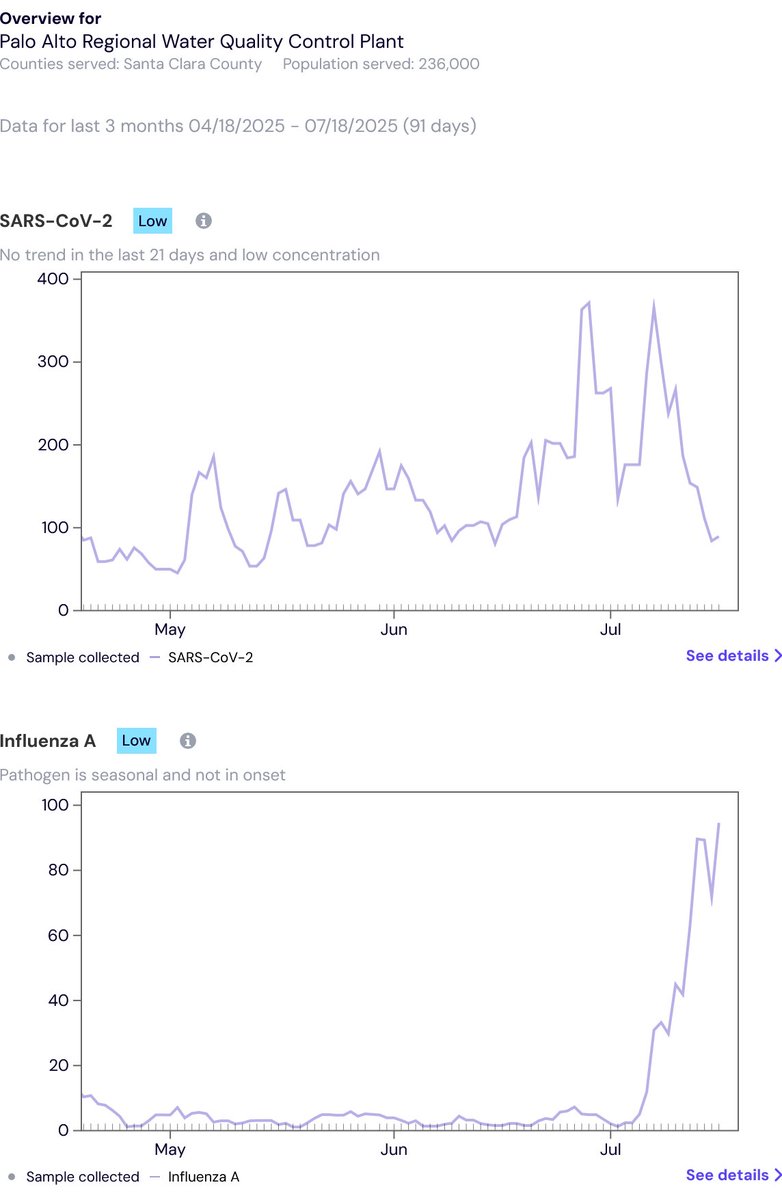
Flu A outbreak in Palo Alto in JULY! It's also spreading in other sites, this site is the highest. Image
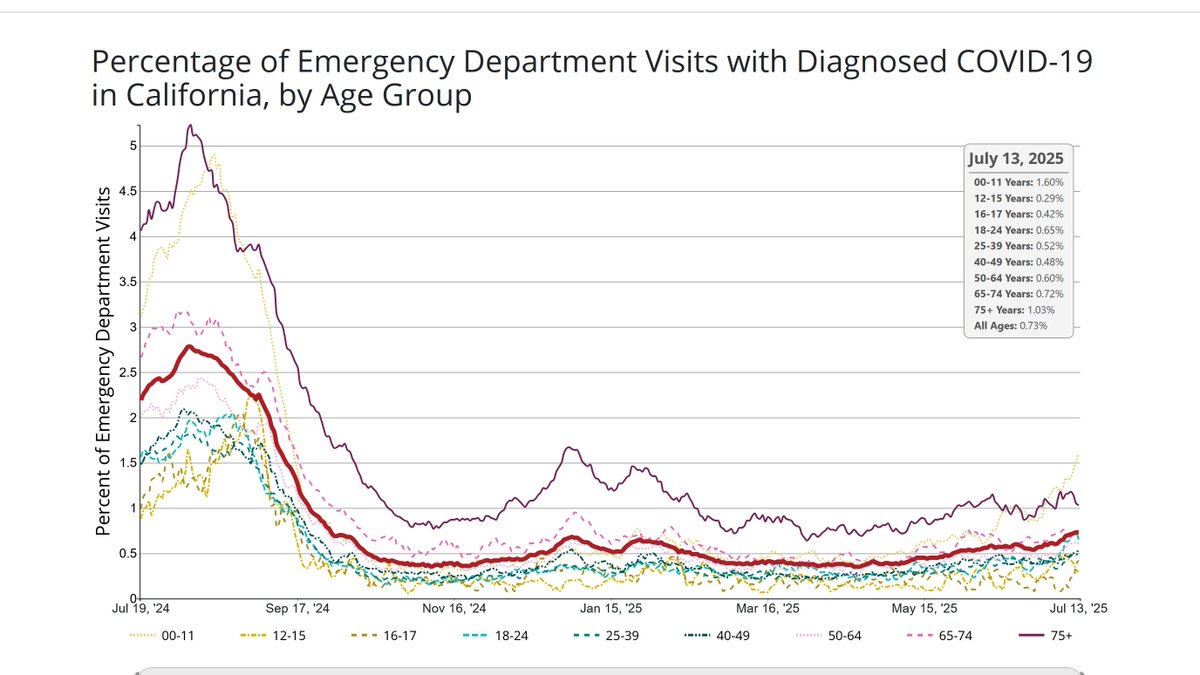
ED visits for ages 0-11 in CA are back to levels last seen ~March 15. Image

• • •

Missing some Tweet in this thread? You can try to force a refresh
 

Keep Current with CyFi

CyFi Profile picture

Stay in touch and get notified when new unrolls are available from this author!

Read all threads

This Thread may be Removed Anytime!

PDF

Twitter may remove this content at anytime! Save it as PDF for later use!

Try unrolling a thread yourself!

how to unroll video
  1. Follow @ThreadReaderApp to mention us!

  2. From a Twitter thread mention us with a keyword "unroll"
@threadreaderapp unroll

Practice here first or read more on our help page!

More from @CyFi10

Dec 12, 2025
BREAKING: California reports SARS-CoV-2 levels are 80% higher statewide in wastewater samples, the highest in 1 month.
Sacramento increased the most, followed by SoCal.
skylab.cdph.ca.gov/calwws/Image
Image
Image
Image
Increased sites in California shown here. Some sites are reported higher by state monitors than by WastewaterSCAN.
skylab.cdph.ca.gov/calwws/Image
Image
Read 5 tweets
Oct 4, 2025
BREAKING: California reports SARS2 levels in wastewater drop back to levels last seen July 10.
There is a major update with formerly "HIGH" levels are now changed to "LOW", and 2 new levels are added.
The Bay area has "Very Low" levels, with "low" elsewhere.New CA SARS dashboard
New CA SARS dashboard
Last week. See the stark changes.
Source. Sewersheds not yet updated, but should be very soon.
skylab.cdph.ca.gov/calwws/
Read 7 tweets
Aug 8, 2025
NEW: The CDC reports an INCREASE in Flu Like Illness for the US (from Covid)
Hawaii is at a 15 year seasonal record high for the 3rd week in a row. Wyoming also, for the 9th week in a row.
South Carolina and Delaware have 15 year seasonal record high spikes.
Ages 0-4 are most affected.
Elmira, NY is the hot spot, as of Aug 2.ILI ACTIVITY BY STATE/CITY/TERRITORY WITH WEEKLY CHANGE, AND CHANGE FROM 2019 SHOWN. SEASONAL RECORDS ALSO SHOWN.
ILI ACTIVITY BY METRO/MICRO REGION
ILI ACTIVITY BY AGE GROUP.
ILI ACTIVITY YOY
Covid Epidemic map As of Aug 5. Image
Florida Ages 0-11 Covid ED visits at the highest level in at least a year.
Read 10 tweets
Aug 7, 2025
BREAKING: CDC REPORTS US HAS LARGEST SURGE IN COVID POSITIVITY SINCE JAN 1, 2022!
7 REGIONS HAVE THE HIGHEST RATE, OR SPIKE SINCE SUMMER 2024, AND ALL INCREASED AS OF AUG 2.C19 POSITIVITY RATES AND TEST COUNTS - US
C19 POSITIVITY  YOY- US
HIGHEST WEEKLY SPIKES, AND HIGHEST COVID POSITIVITY RATES ARE DISPLAYED IN THE BARS. DATE OF THE MOST RECENT HIGHER WEEKLY SPIKE, OR POSITIVITY RATE SHOWN NEXT TO RECORD FLAGS. TEST COUNTS AND CHANGE FROM INITIAL RELEASE ARE SHOWN.  ONLY 2 REGIONS AT YOY POSITIVITY LOWS - 4 AND 7 DOWN FROM 4 REGIONS AND US LAST WEEK.
REGION MAP - US
I couldn't believe my eyes when I saw the record, but here's a visual of it.
Read 7 tweets
Jul 31, 2025
NEW: US CDC reports the highest 1 week COVID surge in positivity since Jan 2022 in Region 6, and 10; since Dec 2023 in Region 2 (tied), since Aug in Region 3, and July 2024 for the US as of July 26.
Positivity is highest since Sep in Region 4, 6, and 9; Region 10 is highest since Oct 5.C19 POSITIVITY YOY - US NATIONAL
C19 POSITIVITY BY WEEK AND TEST COUNTS
C19 POSITIVITY BY HHS REGION, AND US NATIONAL WITH TEST COUNTS AND RECORD POSITIVITY + SURGE FLAGS. LOWEST YOY ALSO NOTED.
US HHS REGION MAP
Heat map for Region 6 which had an extraordinary increase this week. Notably, the YoY positivity is lower than previous pandemic years.
Heat map for Region 2. The early July positivity 2nd place record surge has held even with more tests added.
Read 7 tweets
Jul 17, 2025
BREAKING: 🚨NY/NJ has highest 1-wk COVID positivity spike since wk ending Jan 1, 2022!
All regions increased. US & 8 regions saw 2025 record-high 1-wk spikes.
5 regions hit 2025 positivity highs.
Region 9 has largest wkly spike since Jun 2024.Image
Image
Image
Image
Dates inside the bars on the bar chart denote the last time there was an equal or higher spike / positivity rate as written.
Read 7 tweets

Did Thread Reader help you today?

Support us! We are indie developers!


This site is made by just two indie developers on a laptop doing marketing, support and development! Read more about the story.

Become a Premium Member ($3/month or $30/year) and get exclusive features!

Become Premium

Don't want to be a Premium member but still want to support us?

Make a small donation by buying us coffee ($5) or help with server cost ($10)

Donate via Paypal

Or Donate anonymously using crypto!

Ethereum

0xfe58350B80634f60Fa6Dc149a72b4DFbc17D341E copy

Bitcoin

3ATGMxNzCUFzxpMCHL5sWSt4DVtS8UqXpi copy

Thank you for your support!

Follow Us!

:(