Welcome to OPEX
Should you trust the rally?
Let's take a look
(1/n)
Should you trust the rally?
Let's take a look
(1/n)
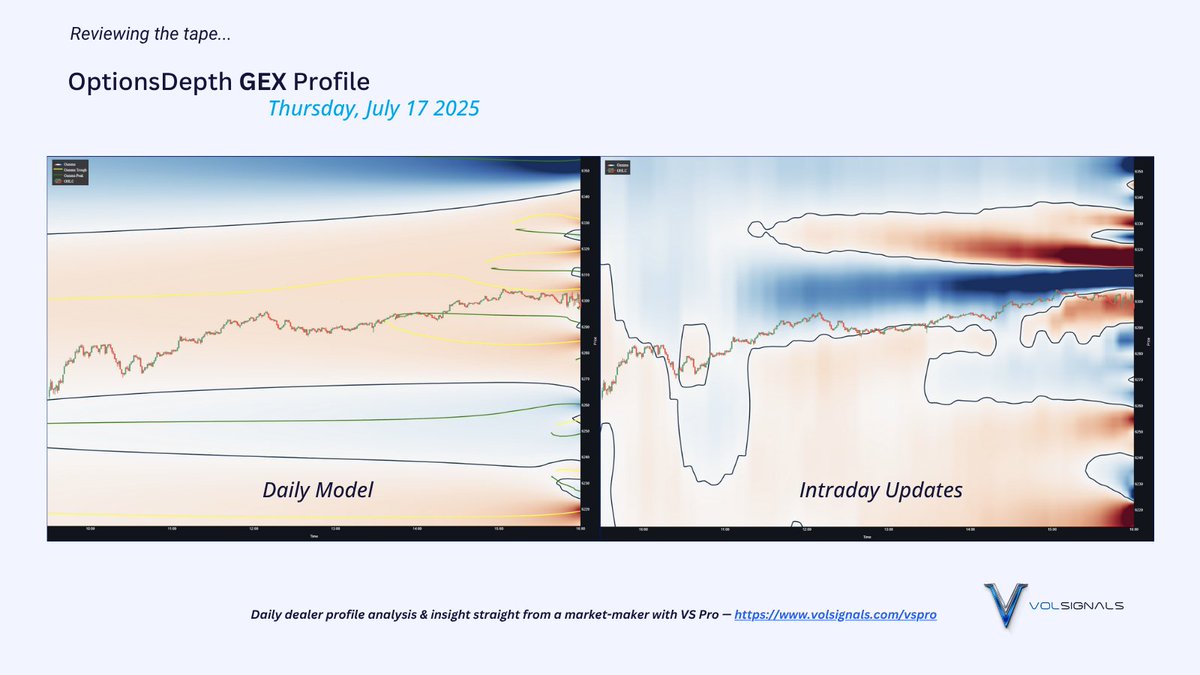
First, why was yesterday so boring compared to Wednesday?
Well putting aside VIX expiration- we had less headline noise (market already digested Trump's Powell noise)
and we also had a far more supportive (and sticky) profile around 6300
If these look mechanical- they are.
Well putting aside VIX expiration- we had less headline noise (market already digested Trump's Powell noise)
and we also had a far more supportive (and sticky) profile around 6300
If these look mechanical- they are.

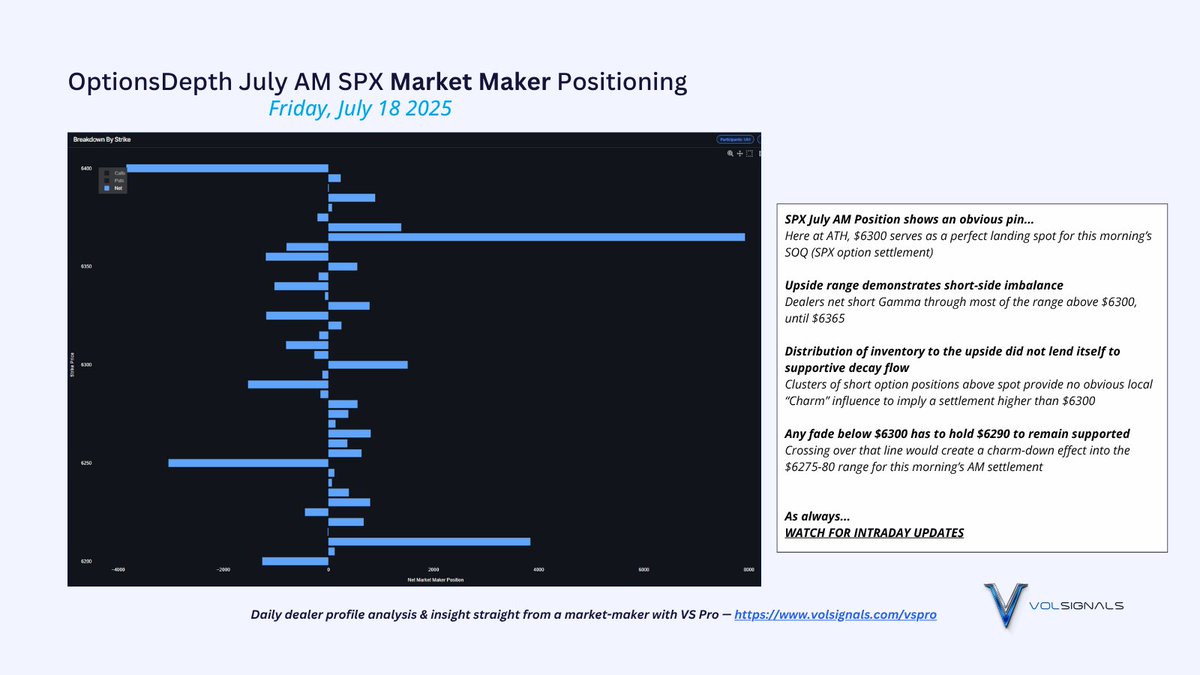
In last night's Mentorship call we discussed the most likely pin for this morning.
Every reasonable interpretation of the dealer position suggested 6300 AM settlement.
(Sorry if you were looking for 6382 this morning 👀)
Why?
Take a look at the AM SPX July position:
Every reasonable interpretation of the dealer position suggested 6300 AM settlement.
(Sorry if you were looking for 6382 this morning 👀)
Why?
Take a look at the AM SPX July position:
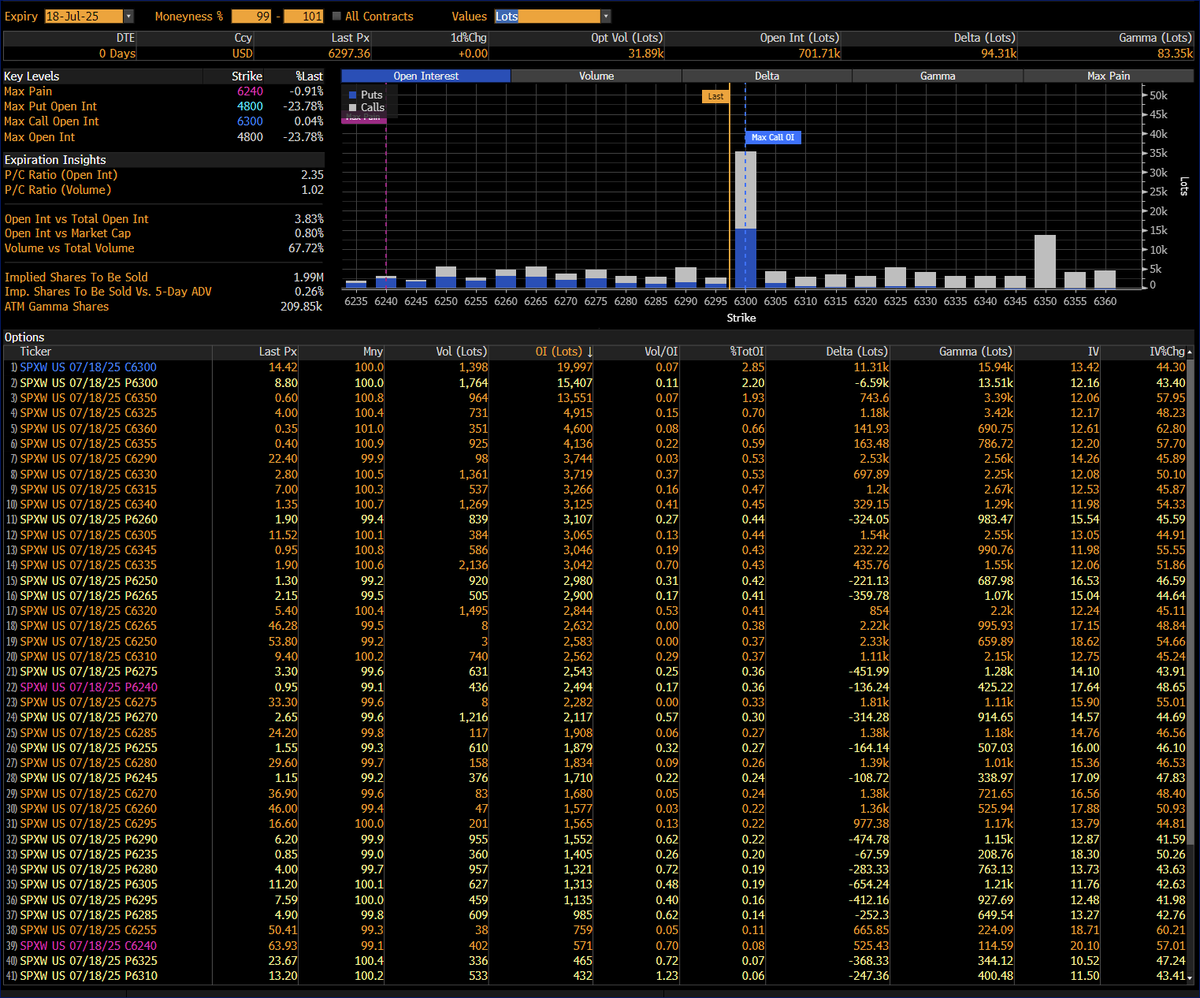
I know you may be used to seeing much bigger numbers... like the BBG OPX Screen below—
(If you don't know why this OI doesn't matter- you need to listen to this morning's meeting)
(If you don't know why this OI doesn't matter- you need to listen to this morning's meeting)
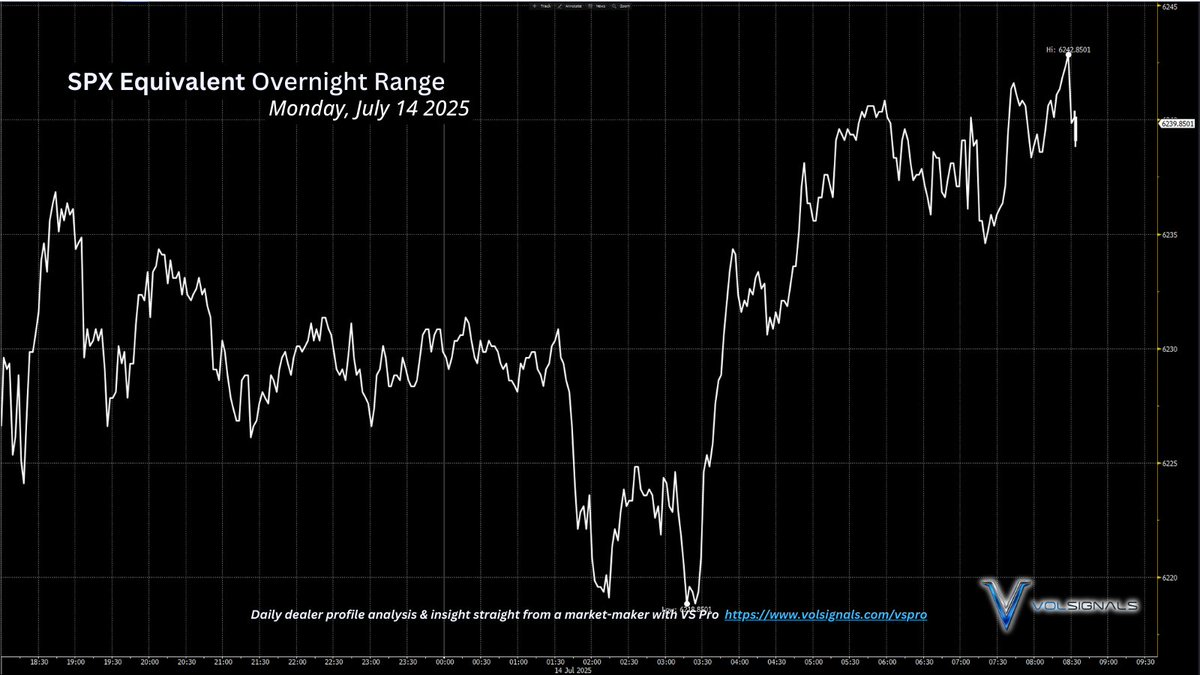
What's happened so far overnight?
The index failed to clear an important cluster of dealer short options, and has reverted right back to its only balancing point in range: $6300
The index failed to clear an important cluster of dealer short options, and has reverted right back to its only balancing point in range: $6300
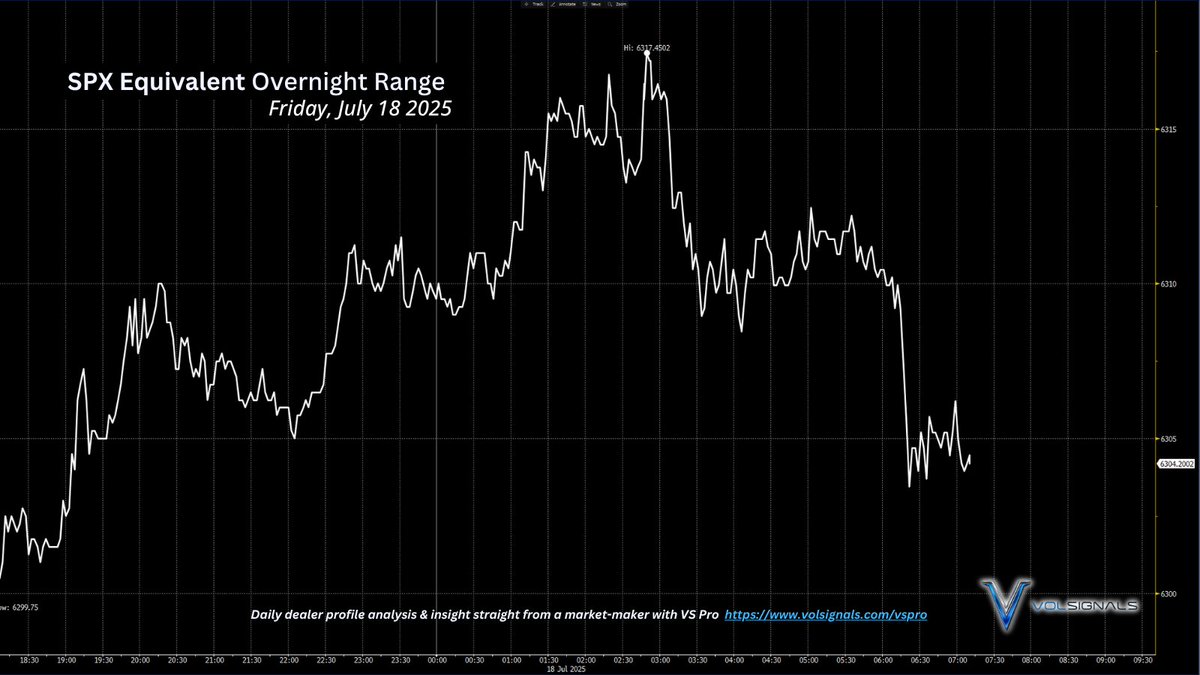
AM rolls off at 9:30 AM and has not been traded since yesterday's close.
Does it matter for today's price action?
Answer:
"in a way, yes"
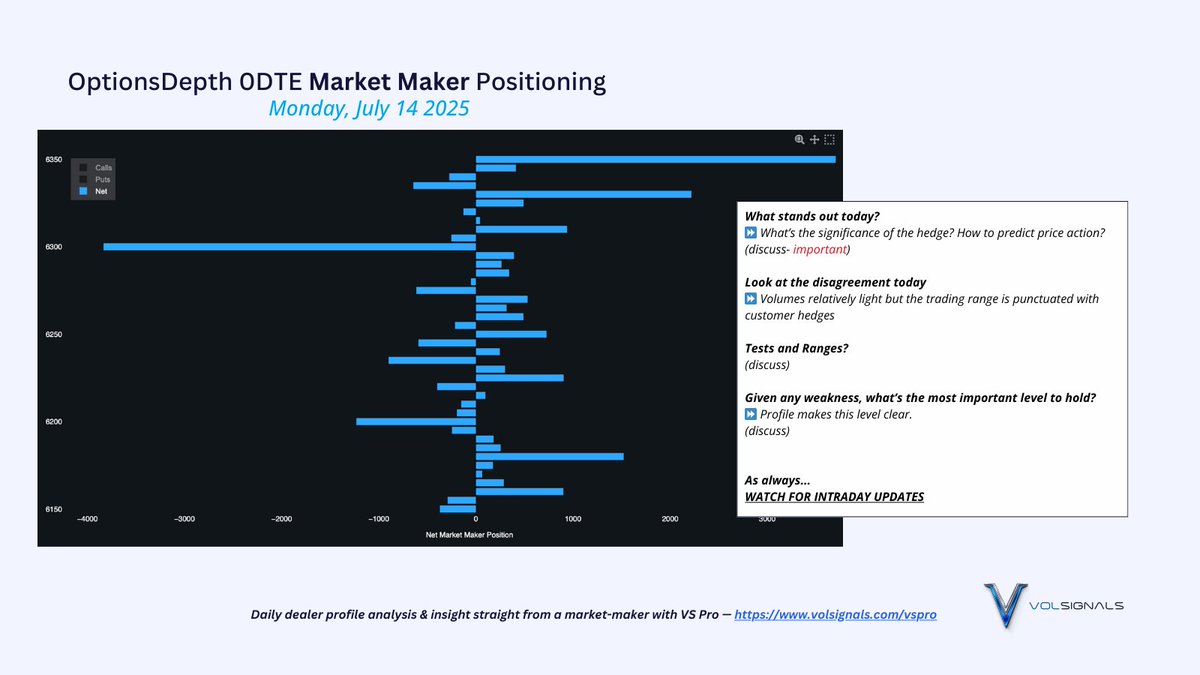
This is the PM-expiring positioning today- aka "ODTE"
These options are subject to change, but note the massive clusters of dealer longs
Does it matter for today's price action?
Answer:
"in a way, yes"
This is the PM-expiring positioning today- aka "ODTE"
These options are subject to change, but note the massive clusters of dealer longs
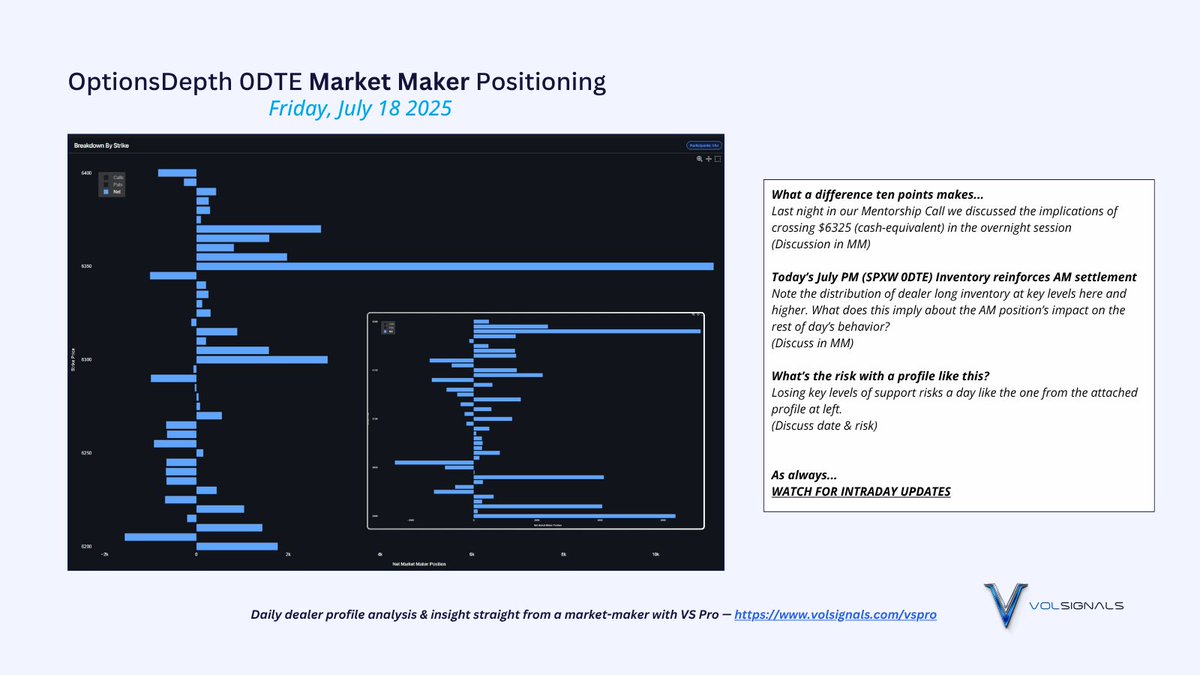
There's no generative magnetism from a strike that has 5 Delta.
That giant bar up top at $6350?
Not relevant down here at $6300.
If we squeezed above 6325 overnight...
TOTALLY different story.
and how about that inventory on the bottom right?
which date is that from?
That giant bar up top at $6350?
Not relevant down here at $6300.
If we squeezed above 6325 overnight...
TOTALLY different story.
and how about that inventory on the bottom right?
which date is that from?

did you guess Feb 21 2025?
That date also happened to be a PM expiration.
Similar price action (near ATH)
Similar VIX action that week
Similar 0DTE positioning
How did that day work out?
Similar price action (near ATH)
Similar VIX action that week
Similar 0DTE positioning
How did that day work out?
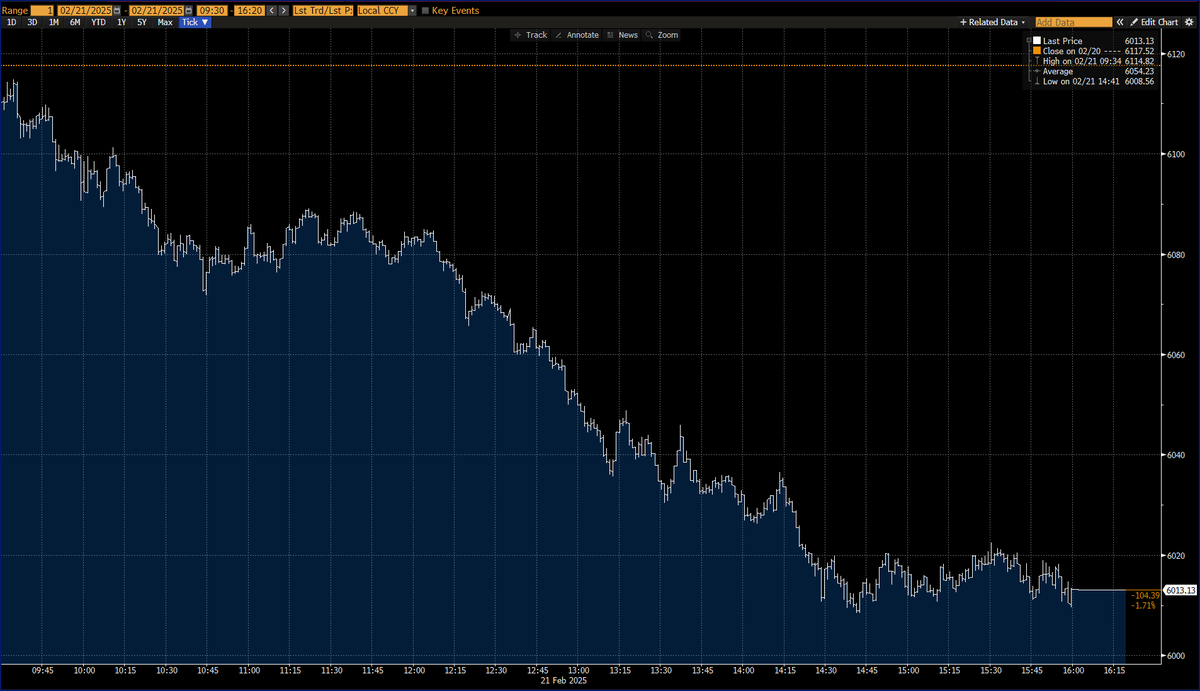
Nevermind. Let's move on.
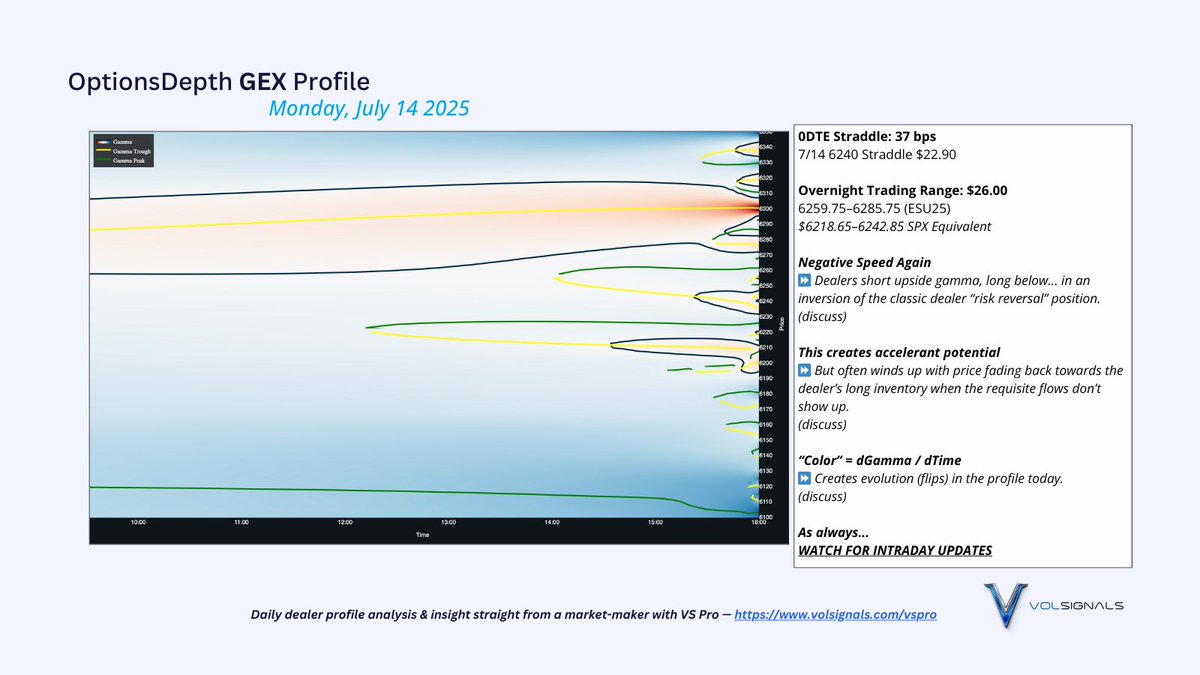
Back to the day ahead...
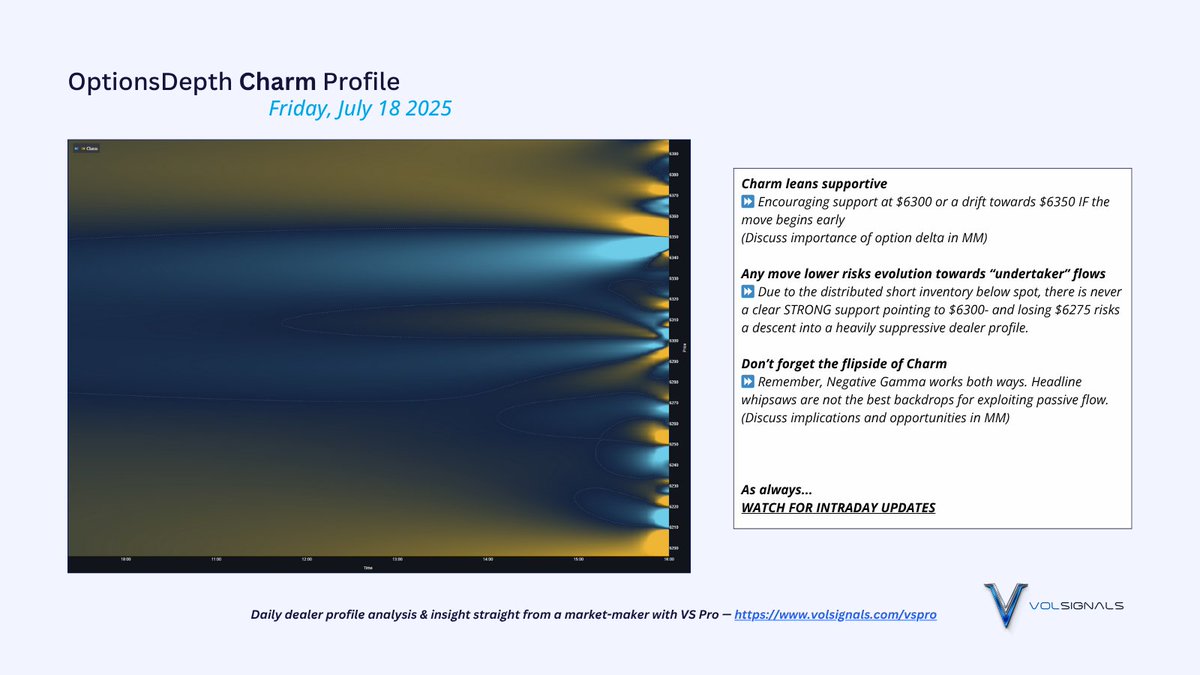
Sweeping positive speed profile but no sharp features in the inventory to provide CLEAR "tests" to the downside.
Gamma is neutral to negative through a wide range here
...unbecoming of a $23 straddle
Back to the day ahead...
Sweeping positive speed profile but no sharp features in the inventory to provide CLEAR "tests" to the downside.
Gamma is neutral to negative through a wide range here
...unbecoming of a $23 straddle
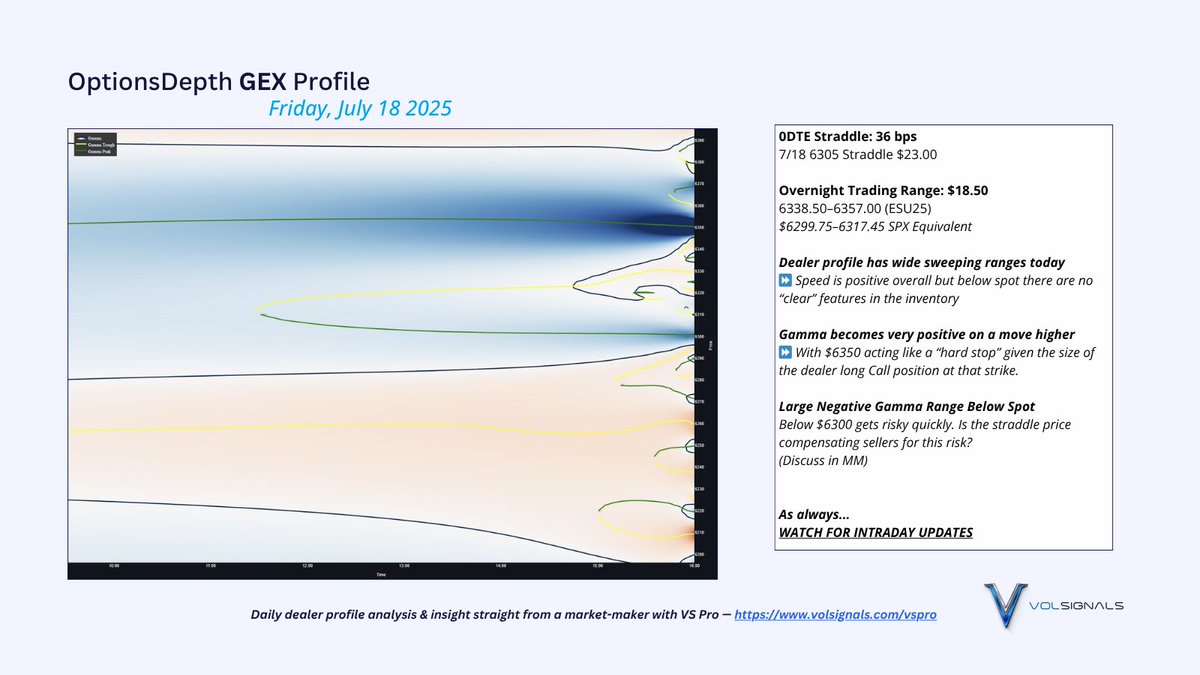
And with no clear standout positions to the downside, we don't ever find STRONG support from the decay flow that would encourage holding $6300
If we lose that level after the settlement, it's going to get hard to stay buoyant quickly to the downside
If we lose that level after the settlement, it's going to get hard to stay buoyant quickly to the downside
Takeaways?
We'll cover in this morning's meeting.
Listen to today's call LIVE at 9:05 AM
volsignals.com/vspro
Join the Mentorship
for apprenticeship + domain expertise
volsignals.com/vip-mentorship
Trial RTM for live institutional quality signals
volsignals.com/rtm
We'll cover in this morning's meeting.
Listen to today's call LIVE at 9:05 AM
volsignals.com/vspro
Join the Mentorship
for apprenticeship + domain expertise
volsignals.com/vip-mentorship
Trial RTM for live institutional quality signals
volsignals.com/rtm
• • •
Missing some Tweet in this thread? You can try to
force a refresh